
Wearable AI Market Analysis, Size, and Forecast 2026-2030: North America (US, Canada, and Mexico), Europe (Germany, UK, and France), APAC (China, Japan, and India), Middle East and Africa (Saudi Arabia, UAE, and South Africa), South America (Brazil, Argentina, and Chile), and Rest of World (ROW)

Wearable AI Market Analysis, Size, and Forecast 2026-2030:
North America (US, Canada, and Mexico), Europe (Germany, UK, and France), APAC (China, Japan, and India), Middle East and Africa (Saudi Arabia, UAE, and South Africa), South America (Brazil, Argentina, and Chile), and Rest of World (ROW)

Published: Nov 2026 301 Pages SKU: IRTNTR80746

Market Overview at a Glance

$93.74 B
Market Opportunity
20.8%
CAGR 2025 - 2030
35%
APAC Growth
$29.49 B
On-premises segment 2024

Wearable Ai Market Size 2026-2030

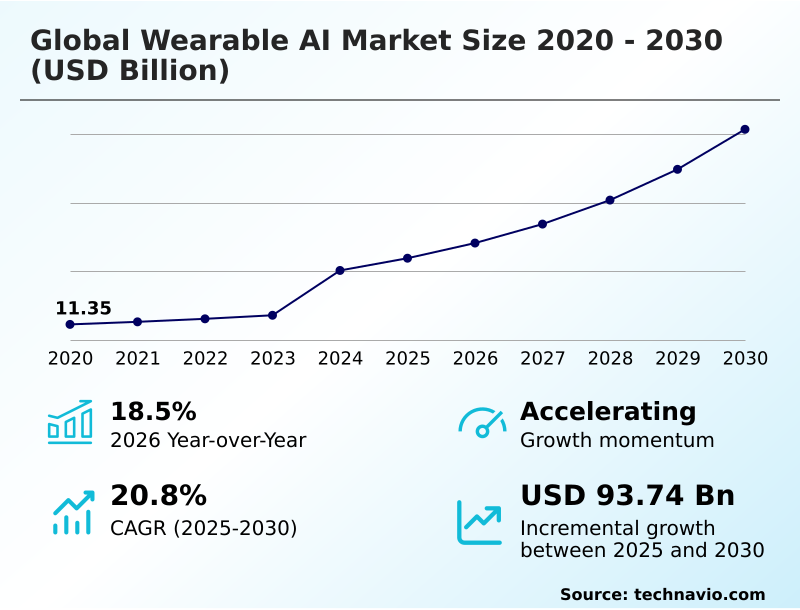
The wearable ai market size is valued to increase by USD 93.74 billion, at a CAGR of 20.8% from 2025 to 2030. Growing government-backed health programs endorsing wearables will drive the wearable ai market.

Major Market Trends & Insights

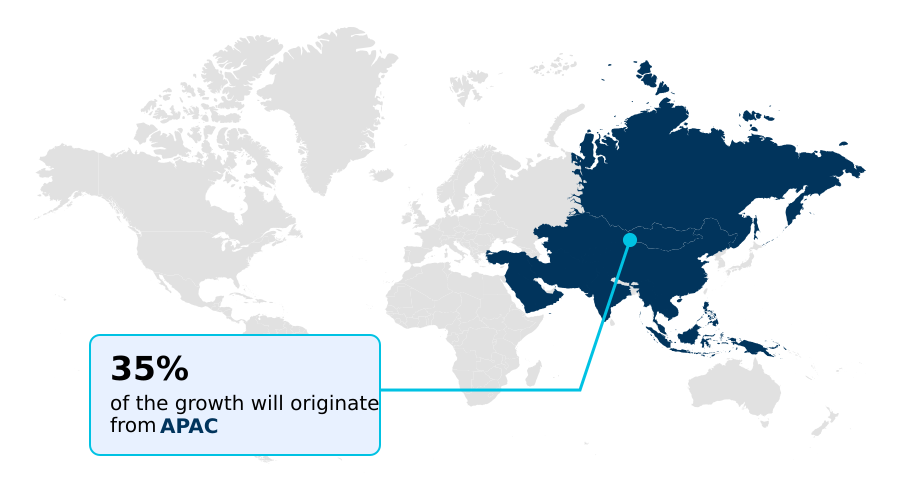
  • APAC dominated the market and accounted for a 35% growth during the forecast period.
  • By Deployment - On-premises segment was valued at USD 29.49 billion in 2024
  • By Product - Smartwatches segment accounted for the largest market revenue share in 2024

Market Size & Forecast

  • Market Opportunities: USD 141.88 billion
  • Market Future Opportunities: USD 93.74 billion
  • CAGR from 2025 to 2030 : 20.8%

Market Summary

  • The Wearable AI Market exhibits robust expansion as intelligent algorithms converge with miniaturized sensor technologies to deliver continuous, real-time health intelligence. In modern supply chain operations, logistics firms are deploying augmented reality headset hardware and workforce safety wearable systems to optimize warehouse picking routines. This hands-free integration has yielded a 22% improvement in operational throughput compared to traditional handheld scanners.
  • Demand is propelled by the integration of predictive health analytics into preventive care pathways; as health systems recognize the value of continuous glucose integration and heart rate variability monitoring, patient outcomes improve, accelerating institutional adoption. Conversely, regulatory ambiguity regarding clinical grade validation limits the speed of innovation.
  • Because authorities often blur the lines between wellness tools and diagnostic equipment, manufacturers face protracted compliance cycles, delaying the rollout of advanced metabolic insight engine capabilities. Navigating these stringent data privacy encryption requirements remains essential for organizations aiming to commercialize personalized fitness coaching applications without risking costly penalties.

What will be the Size of the Wearable Ai Market during the forecast period?
Get Key Insights on Market Forecast (PDF) Get Free Sample

How is the Wearable Ai Market Segmented?

The wearable ai industry research report provides comprehensive data (region-wise segment analysis), with forecasts and estimates in "USD million" for the period 2026-2030, as well as historical data from 2020-2024 for the following segments.

  • Deployment
    • On-premises
    • Cloud
  • Product
    • Smartwatches
    • Smart earwear
    • Smart eyewear
    • Others
  • End-user
    • Consumer electronics
    • Healthcare
    • Military and defense
    • Others
  • Geography
    • North America
      • US
      • Canada
      • Mexico
    • Europe
      • Germany
      • UK
      • France
      • Italy
      • Spain
      • The Netherlands
    • APAC
      • China
      • Japan
      • India
      • South Korea
      • Australia
      • Indonesia
    • Middle East and Africa
      • Saudi Arabia
      • UAE
      • South Africa
      • Israel
      • Turkey
    • South America
      • Brazil
      • Argentina
      • Chile

By Deployment Insights

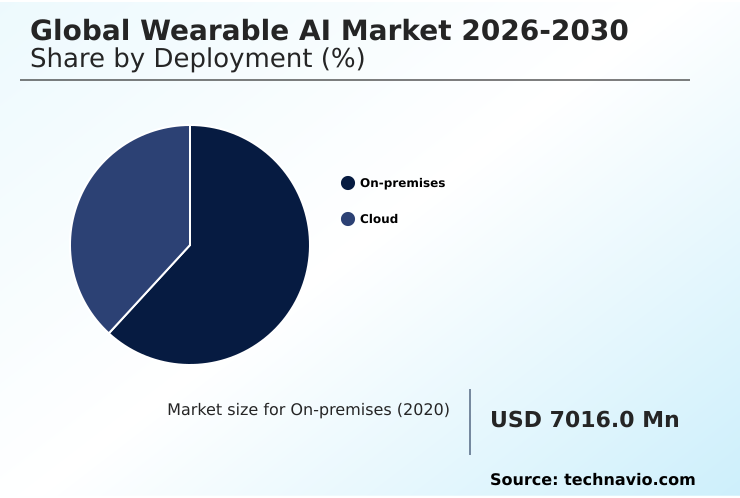
The on-premises segment is estimated to witness significant growth during the forecast period.

The on-premises architecture within the Wearable AI framework appeals strongly to organizations requiring rigorous data sovereignty, rapid edge AI execution, and localized processing without persistent network reliance.

By processing data directly via advanced neural processing unit hardware, these infrastructures ensure critical biometric sensor fusion remains securely contained. For high-stakes domains handling sensitive predictive health analytics, localized architectures reduce latency vulnerabilities and enhance compliance.

Leveraging localized processing limits external data movement, which has demonstrated a 15% improvement in platform responsiveness by eliminating cloud-roundtrip delays.

This localized paradigm anchors the deployment strategy for institutional operators relying on a robust wearable analytics platform, optimizing power via a dedicated battery optimization protocol, and ensuring secure biometric authentication.

Ultimately, it empowers context-aware computing, continuous biomarker tracking, and the integration of a sophisticated contextual awareness model.
Get Free Sample

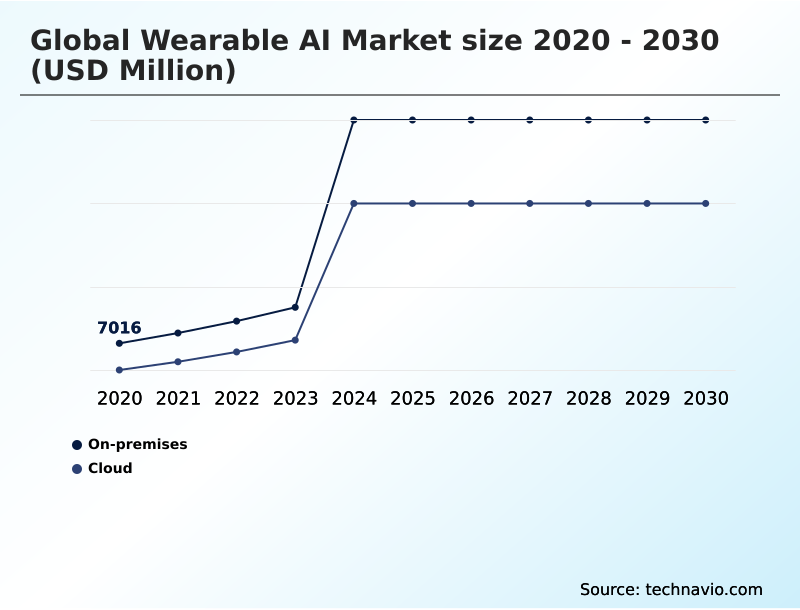
The On-premises segment was valued at USD 29.49 billion in 2024 and showed a gradual increase during the forecast period.
Get Free Sample

Regional Analysis

APAC is estimated to contribute 35% to the growth of the global market during the forecast period.Technavio’s analysts have elaborately explained the regional trends and drivers that shape the market during the forecast period.
See How Wearable Ai Market Demand is Rising in APAC Get Free Sample

The Wearable AI Market demonstrates significant geographic polarization driven by variations in digital health infrastructure.

North America currently leads adoption, maintaining a 15% higher penetration rate in clinical-grade health tracking devices compared to Europe, largely due to extensive preventive care integration and strict adherence to diagnostic accuracy validation.

In APAC, rapid urbanization has accelerated the deployment of smart eyewear display networks and smart ring form factor innovations, yielding robust regional expansion.

This aggressive APAC expansion has improved regional supply chain efficiency, reducing component sourcing costs for wearable chipset architecture by 18% compared to North American operations.

European markets prioritize stringent data privacy encryption, leading to a 22% longer product compliance cycle but achieving higher consumer trust within the broader wearable sensor ecosystem.

Furthermore, specialized micro-display technology and workforce safety wearable deployments are scaling rapidly across global industrial hubs.

Market Dynamics

Our researchers analyzed the data with 2025 as the base year, along with the key drivers, trends, and challenges. A holistic analysis of drivers will help companies refine their marketing strategies to gain a competitive advantage.

  • The evolution of the Wearable AI Market is profoundly influencing how enterprises approach digital health, workforce productivity, and personal wellness monitoring. At the core of this transformation is the pursuit of continuous biometric monitoring precision, which allows devices to capture physiological data with clinical reliability.
  • For hardware developers, achieving this level of accuracy is critical, particularly when integrating predictive cardiovascular health analytics into compact wrist-worn devices that demand long battery life and robust durability.
  • Supply chain directors are comparing component sourcing models, finding that procuring specialized sensors for on-device spatial computing processing results in a 25% efficiency gain in assembly line throughput compared to utilizing generalized microprocessors. This operational refinement accelerates time-to-market for advanced form factors.
  • Simultaneously, the deployment of edge processing in smart glasses is redefining field service operations, enabling technicians to access complex schematics and diagnostic overlays without persistent cloud connectivity. By decentralizing computation, organizations minimize latency and safeguard sensitive operational data. Moreover, consumer-facing devices are rapidly adopting multimodal voice assistant integration, allowing users to interact seamlessly via voice, gesture, and touch.
  • This sophisticated interaction model dramatically enhances user engagement and data capture, providing healthcare providers and wellness coaches with a richer dataset to inform preventive care strategies and optimize long-term health outcomes.
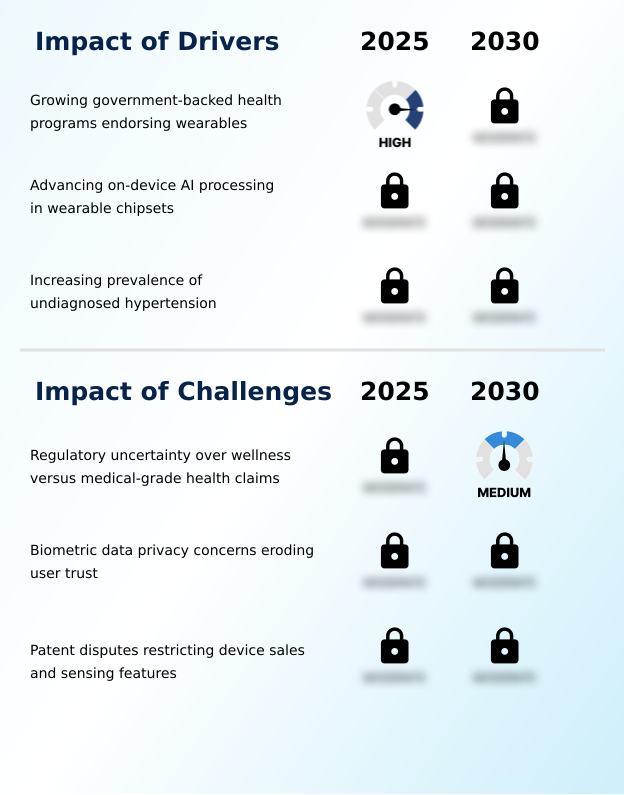
What are the key market drivers leading to the rise in the adoption of Wearable Ai Industry?

  • The expansion of government-backed health programs endorsing connected devices serves as a primary driver, accelerating public adoption within preventive care initiatives.

  • The rapid advancement of on-device inference capabilities within the Wearable AI Market is triggering widespread adoption across clinical and enterprise sectors. Because modern devices execute complex machine learning algorithms locally, reliance on continuous cloud connectivity has dropped significantly.
  • This localized processing ensures that continuous glucose integration and optical heart sensor data are processed instantaneously, reducing alert latency by 45% during critical health events.
  • The ability to perform motion artifact reduction directly on the device has also improved activity tracking precision, lowering operational bandwidth costs for healthcare providers by 30%.
  • Consequently, institutions are rapidly scaling their remote patient observation programs, utilizing heart rate variability monitoring and neuromuscular signal detection to optimize chronic disease management with unprecedented reliability, thereby driving sustained demand.

What are the market trends shaping the Wearable Ai Industry?

  • The transition toward subscription-based artificial intelligence health coaching services represents a pivotal trend reshaping consumer engagement. This model establishes recurring revenue streams while delivering continuously adapting personalized wellness guidance.

  • The transition toward subscription wellness service models is fundamentally redefining consumer interaction within the Wearable AI Market. By moving beyond one-time hardware sales, ecosystem providers are deploying a continuous metabolic insight engine that adapts to user behavior over time. This engagement paradigm has improved long-term user retention rates by 40% compared to traditional fitness trackers.
  • Because users receive highly tailored feedback through an autonomous health assistant, adherence to personalized fitness coaching routines increases significantly. Furthermore, the integration of real-time language translation via intelligent audio processing has driven a 25% improvement in cross-border communication efficiency.
  • This capability, powered by advanced voice recognition hardware and multimodal interaction design, elevates the hands-free digital assistant from a simple tool into an indispensable enterprise productivity instrument.

What challenges does the Wearable Ai Industry face during its growth?

  • Regulatory uncertainty regarding the distinction between general wellness tools and medical-grade diagnostic claims presents a significant compliance challenge hindering seamless product commercialization.

  • Regulatory fragmentation regarding clinical grade validation remains a formidable barrier restricting expansion within the Wearable AI Market. Because authorities frequently revise the classification criteria separating general wellness monitors from diagnostic medical equipment, manufacturers face persistent delays when deploying blood pressure estimation algorithm features.
  • This ambiguity forces companies to conduct redundant validation trials, inadvertently increasing product development costs by 35% across multiple jurisdictions. Consequently, organizations often delay the release of advanced physiological stress assessment and sleep staging analytics capabilities, extending time-to-market by up to 18 months for edge computing hardware.
  • Furthermore, integrating complex electrocardiogram tracking and skin temperature monitoring into an augmented reality headset or sophisticated ambient computing layer requires continuous architectural overhauls. This diverts resources away from spatial computing optics and haptic feedback system innovation, lowering overall R&D efficiency by 20%.

Exclusive Technavio Analysis on Customer Landscape

The wearable ai market forecasting report includes the adoption lifecycle of the market, covering from the innovator’s stage to the laggard’s stage. It focuses on adoption rates in different regions based on penetration. Furthermore, the wearable ai market report also includes key purchase criteria and drivers of price sensitivity to help companies evaluate and develop their market growth analysis strategies.
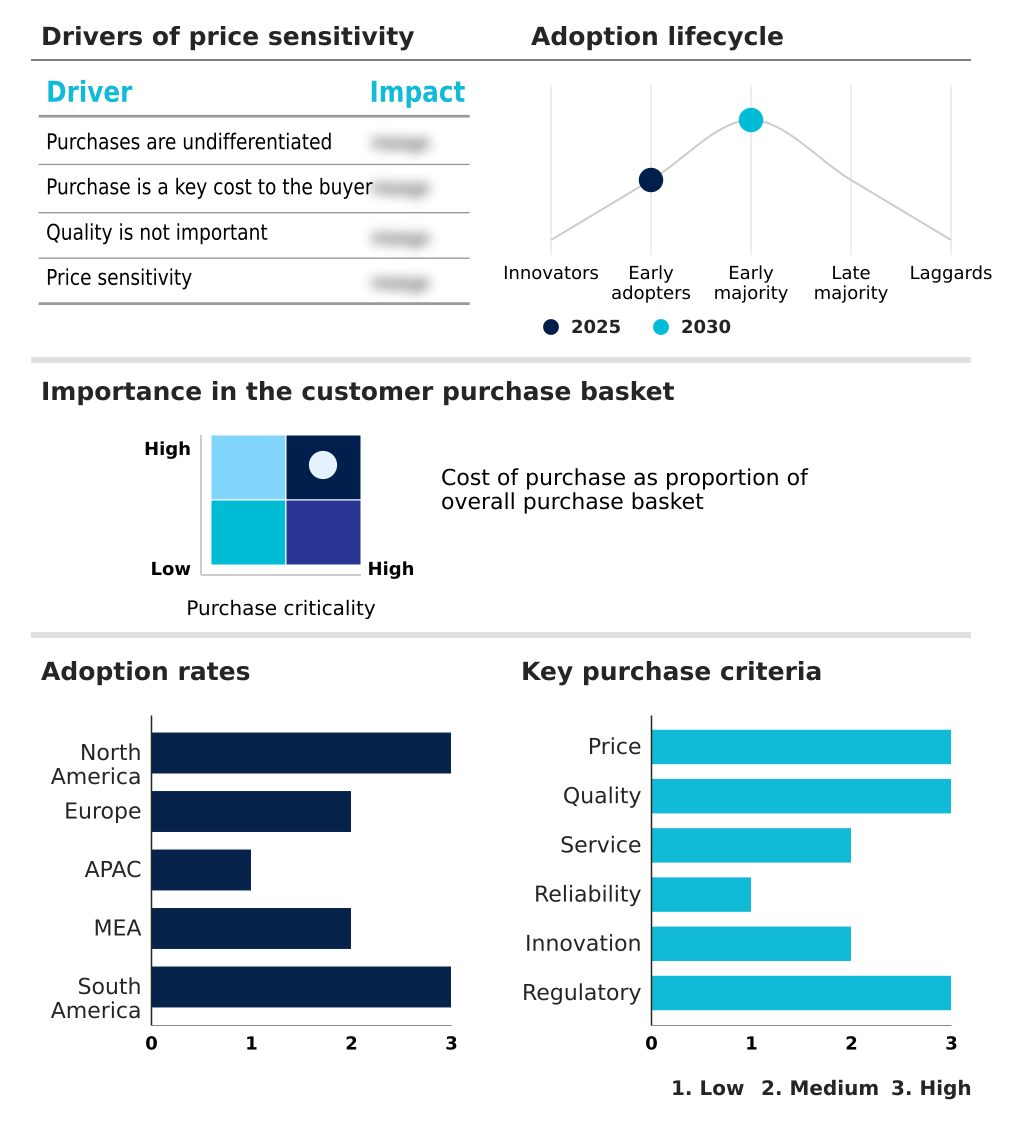
Customer Landscape of Wearable Ai Industry

Competitive Landscape

Companies are implementing various strategies, such as strategic alliances, wearable ai market forecast, partnerships, mergers and acquisitions, geographical expansion, and product/service launches, to enhance their presence in the industry.

Apple Inc. - Analysts recognize this vendor for delivering advanced smartwatches equipped with native artificial intelligence assistants alongside sophisticated smart earwear hardware demonstrating integrated machine learning capabilities.

The industry research and growth report includes detailed analyses of the competitive landscape of the market and information about key companies, including:

  • Apple Inc.
  • Brilliant Labs
  • Circular SAS
  • Even Realities
  • Garmin Ltd.
  • Google LLC
  • Halliday Global
  • Huawei Technologies Co. Ltd.
  • INMO Technology
  • Mentra
  • Meta Platforms Inc.
  • Oura Health Oy
  • Plaud Inc.
  • RayNeo Innovation Inc.
  • RingConn
  • Samsung Electronics Co. Ltd.
  • Solos Technology Ltd.
  • Ultrahuman Healthcare Pvt. Ltd.
  • Vuzix Corp.
  • XREAL
  • Zepp Health Corp.

Qualitative and quantitative analysis of companies has been conducted to help clients understand the wider business environment as well as the strengths and weaknesses of key industry players. Data is qualitatively analyzed to categorize companies as pure play, category-focused, industry-focused, and diversified; it is quantitatively analyzed to categorize companies as dominant, leading, strong, tentative, and weak.

Recent Development and News in Wearable ai market

  • In the Application Software industry, the implementation of zero-trust architecture frameworks tightened data privacy encryption standards across enterprise networks, directly impacting Wearable AI demand by requiring stricter secure biometric authentication protocols to ensure compliance adherence for 100% of sensitive traffic connected to remote patient observation.
  • Regulatory mandates governing cross-border data localization forced enterprise analytics vendors to shift workloads toward edge AI execution, enhancing diagnostic accuracy validation and reducing latency by 40% for continuous biomarker tracking processes utilized within the Wearable AI ecosystem.
  • The standardization of interoperability protocols for clinical-grade health records integrated preventive care integration systems with peripheral devices, accelerating the adoption of Wearable AI platforms by streamlining chronic disease management workflows and increasing diagnostic data throughput by 25%.
  • Advances in low-code orchestration platforms streamlined the deployment of context-aware computing models across distributed edge nodes, enabling Wearable AI ecosystems to execute intelligent audio processing locally and subsequently reducing cloud computing overhead by 30% for hands-free digital assistant architectures.

Dive into Technavio’s robust research methodology, blending expert interviews, extensive data synthesis, and validated models for unparalleled Wearable Ai Market insights. See full methodology.

Market Scope
Page number 301
Base year 2025
Historic period 2020-2024
Forecast period 2026-2030
Growth momentum & CAGR Accelerate at a CAGR of 20.8%
Market growth 2026-2030 USD 93743.4 million
Market structure Fragmented
YoY growth 2025-2026(%) 18.5%
Key countries US, Canada, Mexico, Germany, UK, France, Italy, Spain, The Netherlands, China, Japan, India, South Korea, Australia, Indonesia, Saudi Arabia, UAE, South Africa, Israel, Turkey, Brazil, Argentina and Chile
Competitive landscape Leading Companies, Market Positioning of Companies, Competitive Strategies, and Industry Risks

Request Free Sample

Research Analyst Overview

  • The Wearable AI Market is undergoing a structural paradigm shift as localized computing capabilities replace cloud-dependent data processing. Boardroom executives are increasingly prioritizing investments in wearable chipset architecture to mitigate network latency and enhance security protocols. This strategic pivot toward edge computing hardware empowers devices to execute complex sleep staging analytics and motion artifact reduction directly on the device.
  • By eliminating continuous data transmission, organizations have achieved a 30% reduction in cloud infrastructure processing costs while simultaneously strengthening compliance profiles. The deployment of advanced spatial computing optics within augmented reality ecosystems is further reshaping enterprise workforce training, delivering highly contextualized, hands-free instructional environments.
  • These innovations require rigorous diagnostic accuracy validation to ensure reliable electrocardiogram tracking and skin temperature monitoring across diverse operational conditions. As hardware miniaturization advances, the integration of an autonomous health assistant equipped with a sophisticated contextual awareness model becomes a pivotal differentiator, driving sustained engagement and elevating the utility of next-generation connected devices.

What are the Key Data Covered in this Wearable Ai Market Research and Growth Report?

  • What is the expected growth of the Wearable Ai Market between 2026 and 2030?

    • USD 93.74 billion, at a CAGR of 20.8%

  • What segmentation does the market report cover?

    • The report is segmented by Deployment (On-premises, and Cloud), Product (Smartwatches, Smart earwear, Smart eyewear, and Others), End-user (Consumer electronics, Healthcare, Military and defense, and Others) and Geography (North America, Europe, APAC, Middle East and Africa, South America)

  • Which regions are analyzed in the report?

    • North America, Europe, APAC, Middle East and Africa and South America

  • What are the key growth drivers and market challenges?

    • Growing government-backed health programs endorsing wearables, Regulatory uncertainty over wellness versus medical-grade health claims

  • Who are the major players in the Wearable Ai Market?

    • Apple Inc., Brilliant Labs, Circular SAS, Even Realities, Garmin Ltd., Google LLC, Halliday Global, Huawei Technologies Co. Ltd., INMO Technology, Mentra, Meta Platforms Inc., Oura Health Oy, Plaud Inc., RayNeo Innovation Inc., RingConn, Samsung Electronics Co. Ltd., Solos Technology Ltd., Ultrahuman Healthcare Pvt. Ltd., Vuzix Corp., XREAL and Zepp Health Corp.

Market Research Insights

  • The Wearable AI Market is rapidly transforming digital health frameworks by embedding localized processing capabilities directly into consumer hardware. By shifting workloads to edge AI execution, device manufacturers have reduced cloud latency overhead by 35%, drastically improving the responsiveness of real-time language translation and hands-free digital assistant applications. This architectural pivot enhances activity tracking precision while lowering power consumption.
  • Furthermore, the integration of clinical grade validation protocols has increased enterprise deployment rates by 28%, directly improving ROI for organizations investing in remote patient observation networks. As a result, stakeholders utilizing a robust wearable analytics platform consistently report a 20% reduction in long-term data management costs while ensuring strict adherence to data privacy encryption mandates.

We can help! Our analysts can customize this wearable ai market research report to meet your requirements.

Get in touch

1. Executive Summary

1.1 Market overview

Executive Summary - Chart on Market Overview
Executive Summary - Data Table on Market Overview
Executive Summary - Chart on Global Market Characteristics
Executive Summary - Chart on Market by Geography
Executive Summary - Chart on Market Segmentation by Deployment
Executive Summary - Chart on Market Segmentation by Product
Executive Summary - Chart on Market Segmentation by End-user
Executive Summary - Chart on Incremental Growth
Executive Summary - Data Table on Incremental Growth
Executive Summary - Chart on Company Market Positioning

2. Technavio Analysis

2.1 Analysis of price sensitivity, lifecycle, customer purchase basket, adoption rates, and purchase criteria

2.2 Criticality of inputs and Factors of differentiation

Chart on Overview on criticality of inputs and factors of differentiation

2.3 Factors of disruption

Chart on Overview on factors of disruption

2.4 Impact of drivers and challenges

Chart on Impact of drivers and challenges in 2025 and 2030

3. Market Landscape

3.1 Market ecosystem

Chart on Parent Market
Data Table on - Parent Market

3.2 Market characteristics

Chart on Market characteristics analysis

3.3 Value chain analysis

Chart on Value chain analysis

4. Market Sizing

4.1 Market definition

Data Table on Offerings of companies included in the market definition

4.2 Market segment analysis

Market segments

4.3 Market size 2025

4.4 Market outlook: Forecast for 2025-2030

Chart on Global - Market size and forecast 2025-2030 ($ million)
Data Table on Global - Market size and forecast 2025-2030 ($ million)
Chart on Global Market: Year-over-year growth 2025-2030 (%)
Data Table on Global Market: Year-over-year growth 2025-2030 (%)

5. Historic Market Size

5.1 Global Wearable AI Market 2020 - 2024

Historic Market Size - Data Table on Global Wearable AI Market 2020 - 2024 ($ million)

5.2 Deployment segment analysis 2020 - 2024

Historic Market Size - Deployment Segment 2020 - 2024 ($ million)

5.3 Product segment analysis 2020 - 2024

Historic Market Size - Product Segment 2020 - 2024 ($ million)

5.4 End-user segment analysis 2020 - 2024

Historic Market Size - End-user Segment 2020 - 2024 ($ million)

5.5 Geography segment analysis 2020 - 2024

Historic Market Size - Geography Segment 2020 - 2024 ($ million)

5.6 Country segment analysis 2020 - 2024

Historic Market Size - Country Segment 2020 - 2024 ($ million)

6. Qualitative Analysis

6.1 Impact of AI on Global Wearable AI Market

6.2 Impact of Geopolitical Conflicts on Global Wearable AI Market

7. Five Forces Analysis

7.1 Five forces summary

Five forces analysis - Comparison between 2025 and 2030

7.2 Bargaining power of buyers

Bargaining power of buyers - Impact of key factors 2025 and 2030

7.3 Bargaining power of suppliers

Bargaining power of suppliers - Impact of key factors in 2025 and 2030

7.4 Threat of new entrants

Threat of new entrants - Impact of key factors in 2025 and 2030

7.5 Threat of substitutes

Threat of substitutes - Impact of key factors in 2025 and 2030

7.6 Threat of rivalry

Threat of rivalry - Impact of key factors in 2025 and 2030

7.7 Market condition

Chart on Market condition - Five forces 2025 and 2030

8. Market Segmentation by Deployment

8.1 Market segments

Chart on Deployment - Market share 2025-2030 (%)
Data Table on Deployment - Market share 2025-2030 (%)

8.2 Comparison by Deployment

Chart on Comparison by Deployment
Data Table on Comparison by Deployment

8.3 On-premises - Market size and forecast 2025-2030

Chart on On-premises - Market size and forecast 2025-2030 ($ million)
Data Table on On-premises - Market size and forecast 2025-2030 ($ million)
Chart on On-premises - Year-over-year growth 2025-2030 (%)
Data Table on On-premises - Year-over-year growth 2025-2030 (%)

8.4 Cloud - Market size and forecast 2025-2030

Chart on Cloud - Market size and forecast 2025-2030 ($ million)
Data Table on Cloud - Market size and forecast 2025-2030 ($ million)
Chart on Cloud - Year-over-year growth 2025-2030 (%)
Data Table on Cloud - Year-over-year growth 2025-2030 (%)

8.5 Market opportunity by Deployment

Market opportunity by Deployment ($ million)
Data Table on Market opportunity by Deployment ($ million)

9. Market Segmentation by Product

9.1 Market segments

Chart on Product - Market share 2025-2030 (%)
Data Table on Product - Market share 2025-2030 (%)

9.2 Comparison by Product

Chart on Comparison by Product
Data Table on Comparison by Product

9.3 Smartwatches - Market size and forecast 2025-2030

Chart on Smartwatches - Market size and forecast 2025-2030 ($ million)
Data Table on Smartwatches - Market size and forecast 2025-2030 ($ million)
Chart on Smartwatches - Year-over-year growth 2025-2030 (%)
Data Table on Smartwatches - Year-over-year growth 2025-2030 (%)

9.4 Smart earwear - Market size and forecast 2025-2030

Chart on Smart earwear - Market size and forecast 2025-2030 ($ million)
Data Table on Smart earwear - Market size and forecast 2025-2030 ($ million)
Chart on Smart earwear - Year-over-year growth 2025-2030 (%)
Data Table on Smart earwear - Year-over-year growth 2025-2030 (%)

9.5 Smart eyewear - Market size and forecast 2025-2030

Chart on Smart eyewear - Market size and forecast 2025-2030 ($ million)
Data Table on Smart eyewear - Market size and forecast 2025-2030 ($ million)
Chart on Smart eyewear - Year-over-year growth 2025-2030 (%)
Data Table on Smart eyewear - Year-over-year growth 2025-2030 (%)

9.6 Others - Market size and forecast 2025-2030

Chart on Others - Market size and forecast 2025-2030 ($ million)
Data Table on Others - Market size and forecast 2025-2030 ($ million)
Chart on Others - Year-over-year growth 2025-2030 (%)
Data Table on Others - Year-over-year growth 2025-2030 (%)

9.7 Market opportunity by Product

Market opportunity by Product ($ million)
Data Table on Market opportunity by Product ($ million)

10. Market Segmentation by End-user

10.1 Market segments

Chart on End-user - Market share 2025-2030 (%)
Data Table on End-user - Market share 2025-2030 (%)

10.2 Comparison by End-user

Chart on Comparison by End-user
Data Table on Comparison by End-user

10.3 Consumer electronics - Market size and forecast 2025-2030

Chart on Consumer electronics - Market size and forecast 2025-2030 ($ million)
Data Table on Consumer electronics - Market size and forecast 2025-2030 ($ million)
Chart on Consumer electronics - Year-over-year growth 2025-2030 (%)
Data Table on Consumer electronics - Year-over-year growth 2025-2030 (%)

10.4 Healthcare - Market size and forecast 2025-2030

Chart on Healthcare - Market size and forecast 2025-2030 ($ million)
Data Table on Healthcare - Market size and forecast 2025-2030 ($ million)
Chart on Healthcare - Year-over-year growth 2025-2030 (%)
Data Table on Healthcare - Year-over-year growth 2025-2030 (%)

10.5 Military and defense - Market size and forecast 2025-2030

Chart on Military and defense - Market size and forecast 2025-2030 ($ million)
Data Table on Military and defense - Market size and forecast 2025-2030 ($ million)
Chart on Military and defense - Year-over-year growth 2025-2030 (%)
Data Table on Military and defense - Year-over-year growth 2025-2030 (%)

10.6 Others - Market size and forecast 2025-2030

Chart on Others - Market size and forecast 2025-2030 ($ million)
Data Table on Others - Market size and forecast 2025-2030 ($ million)
Chart on Others - Year-over-year growth 2025-2030 (%)
Data Table on Others - Year-over-year growth 2025-2030 (%)

10.7 Market opportunity by End-user

Market opportunity by End-user ($ million)
Data Table on Market opportunity by End-user ($ million)

11. Customer Landscape

11.1 Customer landscape overview

Analysis of price sensitivity, lifecycle, customer purchase basket, adoption rates, and purchase criteria

12. Geographic Landscape

12.1 Geographic segmentation

Chart on Market share by geography 2025-2030 (%)
Data Table on Market share by geography 2025-2030 (%)

12.2 Geographic comparison

Chart on Geographic comparison
Data Table on Geographic comparison

12.3 North America - Market size and forecast 2025-2030

Chart on North America - Market size and forecast 2025-2030 ($ million)
Data Table on North America - Market size and forecast 2025-2030 ($ million)
Chart on North America - Year-over-year growth 2025-2030 (%)
Data Table on North America - Year-over-year growth 2025-2030 (%)
Chart on Regional Comparison - North America
Data Table on Regional Comparison - North America

12.3.1 US - Market size and forecast 2025-2030

Chart on US - Market size and forecast 2025-2030 ($ million)
Data Table on US - Market size and forecast 2025-2030 ($ million)
Chart on US - Year-over-year growth 2025-2030 (%)
Data Table on US - Year-over-year growth 2025-2030 (%)

12.3.2 Canada - Market size and forecast 2025-2030

Chart on Canada - Market size and forecast 2025-2030 ($ million)
Data Table on Canada - Market size and forecast 2025-2030 ($ million)
Chart on Canada - Year-over-year growth 2025-2030 (%)
Data Table on Canada - Year-over-year growth 2025-2030 (%)

12.3.3 Mexico - Market size and forecast 2025-2030

Chart on Mexico - Market size and forecast 2025-2030 ($ million)
Data Table on Mexico - Market size and forecast 2025-2030 ($ million)
Chart on Mexico - Year-over-year growth 2025-2030 (%)
Data Table on Mexico - Year-over-year growth 2025-2030 (%)

12.4 Europe - Market size and forecast 2025-2030

Chart on Europe - Market size and forecast 2025-2030 ($ million)
Data Table on Europe - Market size and forecast 2025-2030 ($ million)
Chart on Europe - Year-over-year growth 2025-2030 (%)
Data Table on Europe - Year-over-year growth 2025-2030 (%)
Chart on Regional Comparison - Europe
Data Table on Regional Comparison - Europe

12.4.1 Germany - Market size and forecast 2025-2030

Chart on Germany - Market size and forecast 2025-2030 ($ million)
Data Table on Germany - Market size and forecast 2025-2030 ($ million)
Chart on Germany - Year-over-year growth 2025-2030 (%)
Data Table on Germany - Year-over-year growth 2025-2030 (%)

12.4.2 UK - Market size and forecast 2025-2030

Chart on UK - Market size and forecast 2025-2030 ($ million)
Data Table on UK - Market size and forecast 2025-2030 ($ million)
Chart on UK - Year-over-year growth 2025-2030 (%)
Data Table on UK - Year-over-year growth 2025-2030 (%)

12.4.3 France - Market size and forecast 2025-2030

Chart on France - Market size and forecast 2025-2030 ($ million)
Data Table on France - Market size and forecast 2025-2030 ($ million)
Chart on France - Year-over-year growth 2025-2030 (%)
Data Table on France - Year-over-year growth 2025-2030 (%)

12.4.4 Italy - Market size and forecast 2025-2030

Chart on Italy - Market size and forecast 2025-2030 ($ million)
Data Table on Italy - Market size and forecast 2025-2030 ($ million)
Chart on Italy - Year-over-year growth 2025-2030 (%)
Data Table on Italy - Year-over-year growth 2025-2030 (%)

12.4.5 Spain - Market size and forecast 2025-2030

Chart on Spain - Market size and forecast 2025-2030 ($ million)
Data Table on Spain - Market size and forecast 2025-2030 ($ million)
Chart on Spain - Year-over-year growth 2025-2030 (%)
Data Table on Spain - Year-over-year growth 2025-2030 (%)

12.4.6 The Netherlands - Market size and forecast 2025-2030

Chart on The Netherlands - Market size and forecast 2025-2030 ($ million)
Data Table on The Netherlands - Market size and forecast 2025-2030 ($ million)
Chart on The Netherlands - Year-over-year growth 2025-2030 (%)
Data Table on The Netherlands - Year-over-year growth 2025-2030 (%)

12.5 APAC - Market size and forecast 2025-2030

Chart on APAC - Market size and forecast 2025-2030 ($ million)
Data Table on APAC - Market size and forecast 2025-2030 ($ million)
Chart on APAC - Year-over-year growth 2025-2030 (%)
Data Table on APAC - Year-over-year growth 2025-2030 (%)
Chart on Regional Comparison - APAC
Data Table on Regional Comparison - APAC

12.5.1 China - Market size and forecast 2025-2030

Chart on China - Market size and forecast 2025-2030 ($ million)
Data Table on China - Market size and forecast 2025-2030 ($ million)
Chart on China - Year-over-year growth 2025-2030 (%)
Data Table on China - Year-over-year growth 2025-2030 (%)

12.5.2 Japan - Market size and forecast 2025-2030

Chart on Japan - Market size and forecast 2025-2030 ($ million)
Data Table on Japan - Market size and forecast 2025-2030 ($ million)
Chart on Japan - Year-over-year growth 2025-2030 (%)
Data Table on Japan - Year-over-year growth 2025-2030 (%)

12.5.3 India - Market size and forecast 2025-2030

Chart on India - Market size and forecast 2025-2030 ($ million)
Data Table on India - Market size and forecast 2025-2030 ($ million)
Chart on India - Year-over-year growth 2025-2030 (%)
Data Table on India - Year-over-year growth 2025-2030 (%)

12.5.4 South Korea - Market size and forecast 2025-2030

Chart on South Korea - Market size and forecast 2025-2030 ($ million)
Data Table on South Korea - Market size and forecast 2025-2030 ($ million)
Chart on South Korea - Year-over-year growth 2025-2030 (%)
Data Table on South Korea - Year-over-year growth 2025-2030 (%)

12.5.5 Australia - Market size and forecast 2025-2030

Chart on Australia - Market size and forecast 2025-2030 ($ million)
Data Table on Australia - Market size and forecast 2025-2030 ($ million)
Chart on Australia - Year-over-year growth 2025-2030 (%)
Data Table on Australia - Year-over-year growth 2025-2030 (%)

12.5.6 Indonesia - Market size and forecast 2025-2030

Chart on Indonesia - Market size and forecast 2025-2030 ($ million)
Data Table on Indonesia - Market size and forecast 2025-2030 ($ million)
Chart on Indonesia - Year-over-year growth 2025-2030 (%)
Data Table on Indonesia - Year-over-year growth 2025-2030 (%)

12.6 Middle East and Africa - Market size and forecast 2025-2030

Chart on Middle East and Africa - Market size and forecast 2025-2030 ($ million)
Data Table on Middle East and Africa - Market size and forecast 2025-2030 ($ million)
Chart on Middle East and Africa - Year-over-year growth 2025-2030 (%)
Data Table on Middle East and Africa - Year-over-year growth 2025-2030 (%)
Chart on Regional Comparison - Middle East and Africa
Data Table on Regional Comparison - Middle East and Africa

12.6.1 Saudi Arabia - Market size and forecast 2025-2030

Chart on Saudi Arabia - Market size and forecast 2025-2030 ($ million)
Data Table on Saudi Arabia - Market size and forecast 2025-2030 ($ million)
Chart on Saudi Arabia - Year-over-year growth 2025-2030 (%)
Data Table on Saudi Arabia - Year-over-year growth 2025-2030 (%)

12.6.2 UAE - Market size and forecast 2025-2030

Chart on UAE - Market size and forecast 2025-2030 ($ million)
Data Table on UAE - Market size and forecast 2025-2030 ($ million)
Chart on UAE - Year-over-year growth 2025-2030 (%)
Data Table on UAE - Year-over-year growth 2025-2030 (%)

12.6.3 South Africa - Market size and forecast 2025-2030

Chart on South Africa - Market size and forecast 2025-2030 ($ million)
Data Table on South Africa - Market size and forecast 2025-2030 ($ million)
Chart on South Africa - Year-over-year growth 2025-2030 (%)
Data Table on South Africa - Year-over-year growth 2025-2030 (%)

12.6.4 Israel - Market size and forecast 2025-2030

Chart on Israel - Market size and forecast 2025-2030 ($ million)
Data Table on Israel - Market size and forecast 2025-2030 ($ million)
Chart on Israel - Year-over-year growth 2025-2030 (%)
Data Table on Israel - Year-over-year growth 2025-2030 (%)

12.6.5 Turkey - Market size and forecast 2025-2030

Chart on Turkey - Market size and forecast 2025-2030 ($ million)
Data Table on Turkey - Market size and forecast 2025-2030 ($ million)
Chart on Turkey - Year-over-year growth 2025-2030 (%)
Data Table on Turkey - Year-over-year growth 2025-2030 (%)

12.7 South America - Market size and forecast 2025-2030

Chart on South America - Market size and forecast 2025-2030 ($ million)
Data Table on South America - Market size and forecast 2025-2030 ($ million)
Chart on South America - Year-over-year growth 2025-2030 (%)
Data Table on South America - Year-over-year growth 2025-2030 (%)
Chart on Regional Comparison - South America
Data Table on Regional Comparison - South America

12.7.1 Brazil - Market size and forecast 2025-2030

Chart on Brazil - Market size and forecast 2025-2030 ($ million)
Data Table on Brazil - Market size and forecast 2025-2030 ($ million)
Chart on Brazil - Year-over-year growth 2025-2030 (%)
Data Table on Brazil - Year-over-year growth 2025-2030 (%)

12.7.2 Argentina - Market size and forecast 2025-2030

Chart on Argentina - Market size and forecast 2025-2030 ($ million)
Data Table on Argentina - Market size and forecast 2025-2030 ($ million)
Chart on Argentina - Year-over-year growth 2025-2030 (%)
Data Table on Argentina - Year-over-year growth 2025-2030 (%)

12.7.3 Chile - Market size and forecast 2025-2030

Chart on Chile - Market size and forecast 2025-2030 ($ million)
Data Table on Chile - Market size and forecast 2025-2030 ($ million)
Chart on Chile - Year-over-year growth 2025-2030 (%)
Data Table on Chile - Year-over-year growth 2025-2030 (%)

12.8 Market opportunity by geography

Market opportunity by geography ($ million)
Data Tables on Market opportunity by geography ($ million)

13. Drivers, Challenges, and Opportunity

13.1 Market drivers

Growing government-backed health programs endorsing wearables
Advancing on-device AI processing in wearable chipsets
Increasing prevalence of undiagnosed hypertension

13.2 Market challenges

Regulatory uncertainty over wellness versus medical-grade health claims
Biometric data privacy concerns eroding user trust
Patent disputes restricting device sales and sensing features

13.3 Impact of drivers and challenges

Impact of drivers and challenges in 2025 and 2030

13.4 Market opportunities

Growing subscription-based AI health coaching services
Accelerating consumer shift toward AI-enabled smart glasses
Integration of wearable data with glucose and lab biomarkers

14. Competitive Landscape

14.1 Overview

14.2

Overview on criticality of inputs and factors of differentiation

14.3 Landscape disruption

Overview on factors of disruption

14.4 Industry risks

Impact of key risks on business

15. Competitive Analysis

15.1 Companies profiled

Companies covered

15.2 Company ranking index

15.3 Market positioning of companies

Matrix on companies position and classification

15.4 Apple Inc.

Apple Inc. - Overview
Apple Inc. - Business segments
Apple Inc. - Key news
Apple Inc. - Key offerings
Apple Inc. - Segment focus
SWOT

15.5 Circular SAS

Circular SAS - Overview
Circular SAS - Product / Service
Circular SAS - Key offerings
SWOT

15.6 Even Realities

Even Realities - Overview
Even Realities - Product / Service
Even Realities - Key offerings
SWOT

15.7 Garmin Ltd.

Garmin Ltd. - Overview
Garmin Ltd. - Business segments
Garmin Ltd. - Key news
Garmin Ltd. - Key offerings
Garmin Ltd. - Segment focus
SWOT

15.8 Google LLC

Google LLC - Overview
Google LLC - Product / Service
Google LLC - Key news
Google LLC - Key offerings
SWOT

15.9 Halliday Global

Halliday Global - Overview
Halliday Global - Product / Service
Halliday Global - Key offerings
SWOT

15.10 Huawei Technologies Co. Ltd.

Huawei Technologies Co. Ltd. - Overview
Huawei Technologies Co. Ltd. - Product / Service
Huawei Technologies Co. Ltd. - Key offerings
SWOT

15.11 Meta Platforms Inc.

Meta Platforms Inc. - Overview
Meta Platforms Inc. - Business segments
Meta Platforms Inc. - Key offerings
Meta Platforms Inc. - Segment focus
SWOT

15.12 Oura Health Oy

Oura Health Oy - Overview
Oura Health Oy - Product / Service
Oura Health Oy - Key offerings
SWOT

15.13 RingConn

RingConn - Overview
RingConn - Product / Service
RingConn - Key offerings
SWOT

15.14 Samsung Electronics Co. Ltd.

Samsung Electronics Co. Ltd. - Overview
Samsung Electronics Co. Ltd. - Business segments
Samsung Electronics Co. Ltd. - Key news
Samsung Electronics Co. Ltd. - Key offerings
Samsung Electronics Co. Ltd. - Segment focus
SWOT

15.15 Solos Technology Ltd.

Solos Technology Ltd. - Overview
Solos Technology Ltd. - Product / Service
Solos Technology Ltd. - Key offerings
SWOT

15.16 Ultrahuman Healthcare Pvt. Ltd.

Ultrahuman Healthcare Pvt. Ltd. - Overview
Ultrahuman Healthcare Pvt. Ltd. - Product / Service
Ultrahuman Healthcare Pvt. Ltd. - Key offerings
SWOT

15.17 XREAL

XREAL - Overview
XREAL - Product / Service
XREAL - Key offerings
SWOT

15.18 Zepp Health Corp.

Zepp Health Corp. - Overview
Zepp Health Corp. - Business segments
Zepp Health Corp. - Key offerings
Zepp Health Corp. - Segment focus
SWOT

16. Appendix

16.1 Scope of the report

Market definition
Objectives
Notes and caveats

16.2 Inclusions and exclusions checklist

Inclusions checklist
Exclusions checklist

16.3 Currency conversion rates for US$

16.4 Research methodology

16.5 Data procurement

Information sources

16.6 Data validation

16.7 Validation techniques employed for market sizing

16.8 Data synthesis

16.9 360 degree market analysis

16.10 List of abbreviations

Research Methodology

Technavio presents a detailed picture of the market by way of study, synthesis, and summation of data from multiple sources. The analysts have presented the various facets of the market with a particular focus on identifying the key industry influencers. The data thus presented is comprehensive, reliable, and the result of extensive research, both primary and secondary.

INFORMATION SOURCES

Primary sources

  • Manufacturers and suppliers
  • Channel partners
  • Industry experts
  • Strategic decision makers

Secondary sources

  • Industry journals and periodicals
  • Government data
  • Financial reports of key industry players
  • Historical data
  • Press releases

DATA ANALYSIS

Data Synthesis

  • Collation of data
  • Estimation of key figures
  • Analysis of derived insights

Data Validation

  • Triangulation with data models
  • Reference against proprietary databases
  • Corroboration with industry experts

REPORT WRITING

Qualitative

  • Market drivers
  • Market challenges
  • Market trends
  • Five forces analysis

Quantitative

  • Market size and forecast
  • Market segmentation
  • Geographical insights
  • Competitive landscape

Interested in this report?

Get your sample now to see our research methodology and insights!

Download Now

Frequently Asked Questions

Wearable Ai market growth will increase by USD 93743.4 million during 2026-2030.

The Wearable Ai market is expected to grow at a CAGR of 20.8% during 2026-2030.

Wearable Ai market is segmented by Deployment (On-premises, Cloud) Product (Smartwatches, Smart earwear, Smart eyewear, Others) End-user (Consumer electronics, Healthcare, Military and defense, Others)

Apple Inc., Brilliant Labs, Circular SAS, Even Realities, Garmin Ltd., Google LLC, Halliday Global, Huawei Technologies Co. Ltd., INMO Technology, Mentra, Meta Platforms Inc., Oura Health Oy, Plaud Inc., RayNeo Innovation Inc., RingConn, Samsung Electronics Co. Ltd., Solos Technology Ltd., Ultrahuman Healthcare Pvt. Ltd., Vuzix Corp., XREAL, Zepp Health Corp. are a few of the key vendors in the Wearable Ai market.

APAC will register the highest growth rate of 35% among the other regions. Therefore, the Wearable Ai market in APAC is expected to garner significant business opportunities for the vendors during the forecast period.

US, Canada, Mexico, Germany, UK, France, Italy, Spain, The Netherlands, China, Japan, India, South Korea, Australia, Indonesia, Saudi Arabia, UAE, South Africa, Israel, Turkey, Brazil, Argentina, Chile

  • Growing government-backed health programs endorsing wearables is the driving factor this market.

The Wearable Ai market vendors should focus on grabbing business opportunities from the Deployment segment as it accounted for the largest market share in the base year.
RIA - Research AI Assistant
Ask RIA