Vortex Flowmeter Market Analysis, Size, and Forecast 2026-2030: Europe (Germany, UK, and France), North America (US, Canada, and Mexico), APAC (China, Japan, and India), South America (Brazil, Argentina, and Chile), Middle East and Africa (Saudi Arabia, UAE, and South Africa), and Rest of World (ROW)

Vortex Flowmeter Market Analysis, Size, and Forecast 2026-2030:
Europe (Germany, UK, and France), North America (US, Canada, and Mexico), APAC (China, Japan, and India), South America (Brazil, Argentina, and Chile), Middle East and Africa (Saudi Arabia, UAE, and South Africa), and Rest of World (ROW)

Published: Nov 2026 314 Pages SKU: IRTNTR73516

Market Overview at a Glance

$183.44 Mn
Market Opportunity
6.1%
CAGR 2025 - 2030
29.8%
APAC Growth
$112.96 Mn
Oil and gas industry segment 2024

Vortex Flowmeter Market Size 2026-2030

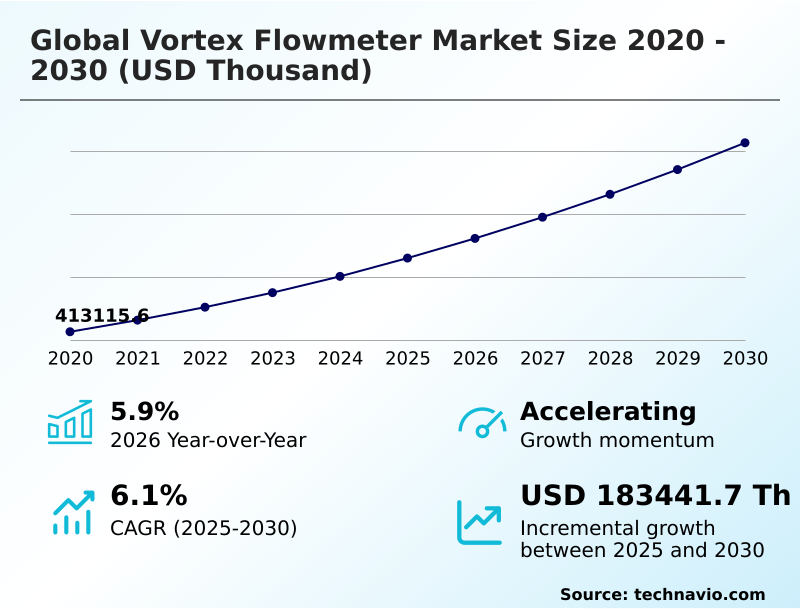
The vortex flowmeter market size is valued to increase by USD 183.44 million, at a CAGR of 6.1% from 2025 to 2030. Increasing mandatory energy management obligations for industrial steam systems will drive the vortex flowmeter market.

Major Market Trends & Insights

  • APAC dominated the market and accounted for a 29.8% growth during the forecast period.
  • By End-user - Oil and gas industry segment was valued at USD 112.96 million in 2024
  • By Type - Inline vortex flowmeter segment accounted for the largest market revenue share in 2024

Market Size & Forecast

  • Market Opportunities:
  • Market Future Opportunities: USD 183.44 million
  • CAGR from 2025 to 2030 : 6.1%

Market Summary

  • The Vortex Flowmeter Market demonstrates robust expansion driven by the critical necessity for accurate fluid and steam measurement across continuous process industries. Process operators consistently leverage these instruments to track utility consumption and validate thermal efficiency.
  • In a typical chemical manufacturing scenario, facilities replacing traditional mechanical meters with advanced vortex technology achieve a 25% improvement in long-term measurement stability, drastically reducing routine maintenance interventions. The increasing implementation of mandatory energy management obligations directly propels demand, as industrial plants must accurately quantify steam usage to comply with stringent emissions and efficiency regulations.
  • Conversely, supply chain vulnerabilities present a substantial structural challenge. Tariff-driven surcharges on imported precision assemblies and piezoelectric sensing elements inflate capital expenditure, forcing engineering contractors to continuously adjust project budgets. By navigating these cost constraints, manufacturers prioritize integrating multivariable sensing capabilities that eliminate the need for secondary transmitters.
  • This strategic consolidation ultimately streamlines piping infrastructure, ensuring that modernized facilities maintain high operational uptime while meeting comprehensive decarbonization targets.

What will be the Size of the Vortex Flowmeter Market during the forecast period?
Get Key Insights on Market Forecast (PDF) Get Free Sample

How is the Vortex Flowmeter Market Segmented?

The vortex flowmeter industry research report provides comprehensive data (region-wise segment analysis), with forecasts and estimates in "USD thousand" for the period 2026-2030, as well as historical data from 2020-2024 for the following segments.

  • End-user
    • Oil and gas industry
    • Power industry
    • Chemical and petrochemical
    • Food and beverage
    • Others
  • Type
    • Inline vortex flowmeter
    • Massflow vortex flowmeter
    • Insertion vortex flowmeter
  • Application
    • Liquids
    • Gases
    • Steam
    • Corrosive fluids and slurries
  • Geography
    • Europe
      • Germany
      • UK
      • France
      • Italy
      • Spain
      • The Netherlands
    • North America
      • US
      • Canada
      • Mexico
    • APAC
      • China
      • Japan
      • India
      • South Korea
      • Australia
      • Indonesia
    • South America
      • Brazil
      • Argentina
      • Chile
    • Middle East and Africa
      • Saudi Arabia
      • UAE
      • South Africa
      • Turkey
      • Israel

By End-user Insights

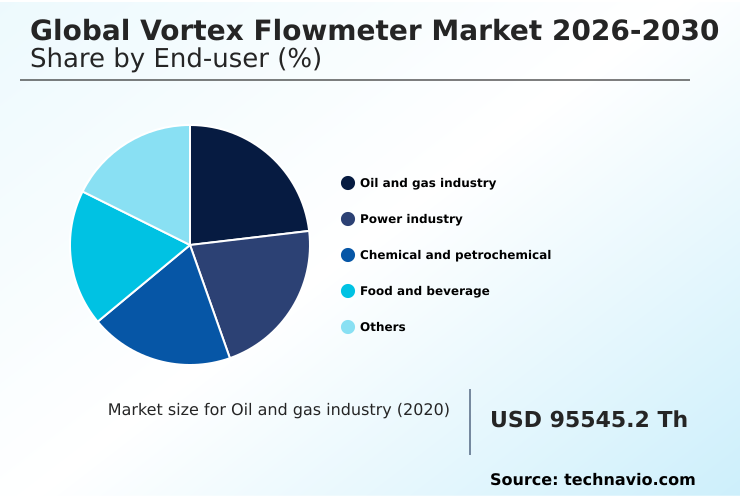
The oil and gas industry segment is estimated to witness significant growth during the forecast period.

The oil and gas segment of the Vortex Flowmeter market demands high-precision fluid monitoring to optimize refinery operations and upstream extraction.

Engineers increasingly rely on the piezoelectric sensing element and refined bluff body geometry to capture accurate data across varying thermal conditions. Upgrading from traditional orifice plates achieves a 15% pressure loss reduction, directly enhancing pipeline throughput.

Facilities implement multivariable transmitter integration to calculate density compensated mass flow without external computing hardware.

While meeting the strict reynolds number threshold is critical for stable readings, operators address installation constraints by managing the straight pipe run requirement and applying velocity profile correction.

Advanced pipeline vibration dampening limits false signals, effectively overcoming the standard low flow cutoff and ensuring dependable process control during continuous hydrocarbon processing.
Get Free Sample

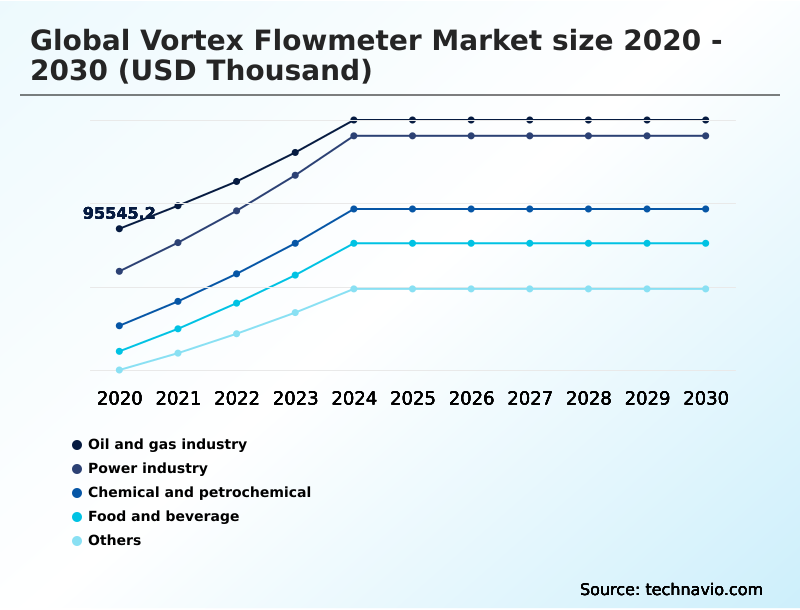
The Oil and gas industry segment was valued at USD 112.96 million in 2024 and showed a gradual increase during the forecast period.
Get Free Sample

Regional Analysis

APAC is estimated to contribute 29.8% to the growth of the global market during the forecast period.Technavio’s analysts have elaborately explained the regional trends and drivers that shape the market during the forecast period.
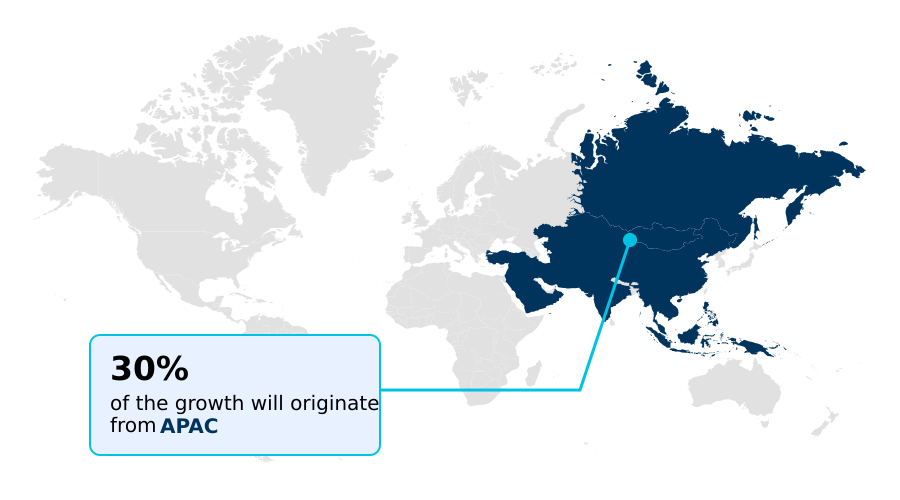
See How Vortex Flowmeter Market Demand is Rising in APAC Get Free Sample

The geographic adoption of the Vortex Flowmeter reveals distinct modernization strategies between established and emerging industrial hubs. North America demonstrates a 20% higher integration rate of the ethernet advanced physical layer compared to South America, enabling faster plant-wide data transmission.

European facilities heavily favor saturated steam metering upgrades, replacing aging mechanical devices with a robust flanged inline meter or a compact wafer style instrument to secure a 15% efficiency gain in utility tracking.

To accommodate complex piping, APAC operators increasingly deploy a reduced bore design and utilize hot tap insertion, minimizing facility downtime during critical maintenance.

Across all regions, precise vortex shedding frequency detection and advanced signal noise filtering ensure highly accurate process variable calculation.

Furthermore, customizing wetted part metallurgy allows regional chemical plants to handle aggressive fluids, directly extending equipment lifespan and cutting long-term operational costs by 18%.

Market Dynamics

Our researchers analyzed the data with 2025 as the base year, along with the key drivers, trends, and challenges. A holistic analysis of drivers will help companies refine their marketing strategies to gain a competitive advantage.

  • The operational landscape for fluid measurement is rapidly evolving as process facilities prioritize holistic energy management over simple volumetric tracking. Modern industrial complexes increasingly rely on precise multivariable steam energy calculation to allocate thermal costs accurately across diverse production units.
  • By upgrading to advanced vortex technologies, facility managers can achieve a 20% enhancement in utility tracking accuracy compared to legacy differential pressure setups. This precision is particularly crucial during high temperature saturated steam monitoring, where real-time compensation for density fluctuations prevents massive billing discrepancies in shared steam networks.
  • Similarly, the integration of inline gas mass flow measurement enables petrochemical operators to account for varying process pressures instantly, ensuring tighter stoichiometric control during combustion processes. To guarantee data reliability in heavy pump and compressor environments, engineers emphasize pipeline vibration signal noise reduction, filtering out mechanical interference that typically causes false flow registrations.
  • Furthermore, as regulatory scrutiny intensifies regarding worker safety in explosive atmospheres, the specification of hazardous area certified flow instrumentation has become a non-negotiable procurement standard. These interconnected technical requirements compel manufacturing plants to treat flowmeters not merely as localized sensors, but as foundational pillars of their broader digital transformation and compliance strategies.
  • Consequently, plant reliability engineers are standardizing these robust sensing solutions across all critical utility circuits. By completely eliminating moving parts from the fluid stream, facilities inherently reduce the frequency of mandatory maintenance shutdowns, delivering a measurable boost to overall plant availability.
  • Ultimately, the seamless convergence of multivariable sensing and ruggedized hardware ensures that industrial operators can sustain aggressive production targets while strictly adhering to internal sustainability benchmarks and global safety directives.
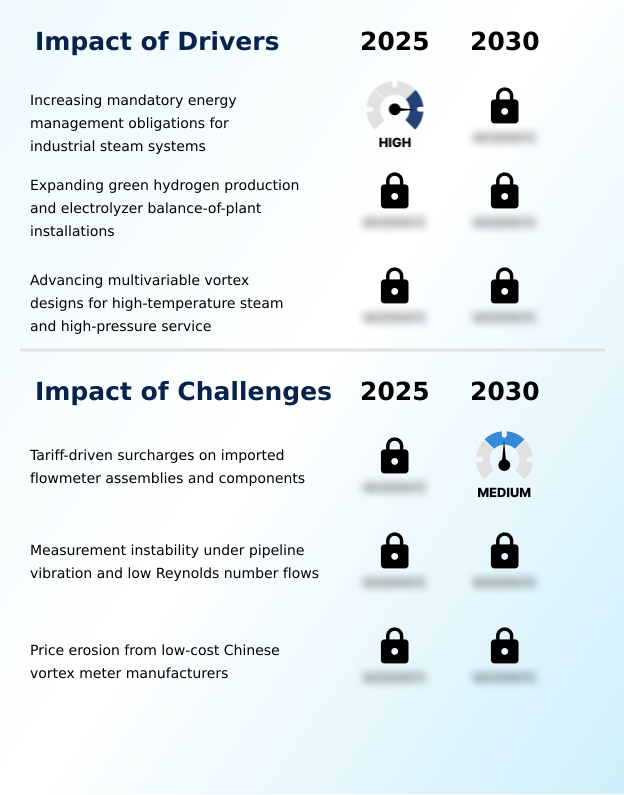
What are the key market drivers leading to the rise in the adoption of Vortex Flowmeter Industry?

  • The increasing implementation of mandatory energy management obligations for industrial steam systems serves as a primary catalyst for market expansion.

  • Strict environmental mandates and the rapid transition toward sustainable energy sources act as the primary catalysts accelerating Vortex Flowmeter deployment.
  • Facilities are upgrading flare gas monitoring systems and measuring every condensate return line to achieve a 20% improvement in overall boiler performance optimization.
  • The emerging hydrogen economy heavily dictates demand, as the electrolyzer balance of plant requires exceptionally precise measurement of demineralized feed water to maintain safe gas generation.
  • Additionally, power plants utilizing these instruments to track the cogeneration heat rate have improved energy efficiency tracking by 15%.
  • This structural shift is underpinned by the widespread adoption of the hart communication protocol and the foundation fieldbus interface, which seamlessly feed data into control rooms.
  • The subsequent move toward profinet digital integration empowers operators to execute predictive condition based maintenance, drastically lowering unplanned downtime and elevating long-term process reliability.

What are the market trends shaping the Vortex Flowmeter Industry?

  • The growing integration of Ethernet-APL connectivity in field instrumentation represents a major trend. This advancement enables high-speed digital communication and seamless diagnostic access across hazardous industrial areas.

  • The Vortex Flowmeter technology is undergoing a transformative shift toward autonomous asset management and resilient material construction. Industrial plants now demand comprehensive in situ verification and continuous sensor health diagnostics, which together have reduced manual calibration requirements by 30%.
  • This digital transition facilitates precise superheated steam allocation and improves wet steam tolerance, ensuring thermal energy is accurately tracked across complex distribution headers. By achieving complete paddle wear elimination, these solid-state sensors lower mechanical failure rates by 25% compared to legacy turbine devices.
  • Furthermore, manufacturers are upgrading instrument housings with an explosion proof housing and securing stringent hazardous area certification to comply with rigorous safety integrity level standards. To combat severe chemical corrosion in petrochemical facilities, the adoption of premium materials like duplex stainless steel and nickel alloy hastelloy has surged, effectively extending the operational lifecycle of measurement assets and safeguarding process continuity.

What challenges does the Vortex Flowmeter Industry face during its growth?

  • Tariff-driven surcharges on imported assemblies and specialized sensor components pose a significant challenge to overall industry profitability and supply chain stability.

  • Despite robust technological advancements, extreme application environments and stringent regulatory frameworks present significant operational challenges for the Vortex Flowmeter market. Operators managing a sprawling district heating network often struggle with fluctuating velocity profiles, where conducting an accurate thermal mass comparison becomes highly complex during low-demand periods.
  • Implementing reliable biogas anaerobic digestion measurement is equally demanding, as variable gas compositions and low-pressure conditions force plants to accept a 15% reduction in usable turndown ratios. Furthermore, executing precise cryogenic fluid measurement requires specialized sensor calibration that dramatically inflates initial deployment costs.
  • Facilities bound by a strict energy management standard face immense pressure to ensure flawless steam trap leak detection and rigorous fugitive emission tracking. Any calibration drift in these environments severely compromises compliance with mandatory carbon emission reporting, highlighting the continuous need for advanced signal processing to maintain measurement integrity under adverse process conditions.

Exclusive Technavio Analysis on Customer Landscape

The vortex flowmeter market forecasting report includes the adoption lifecycle of the market, covering from the innovator’s stage to the laggard’s stage. It focuses on adoption rates in different regions based on penetration. Furthermore, the vortex flowmeter market report also includes key purchase criteria and drivers of price sensitivity to help companies evaluate and develop their market growth analysis strategies.
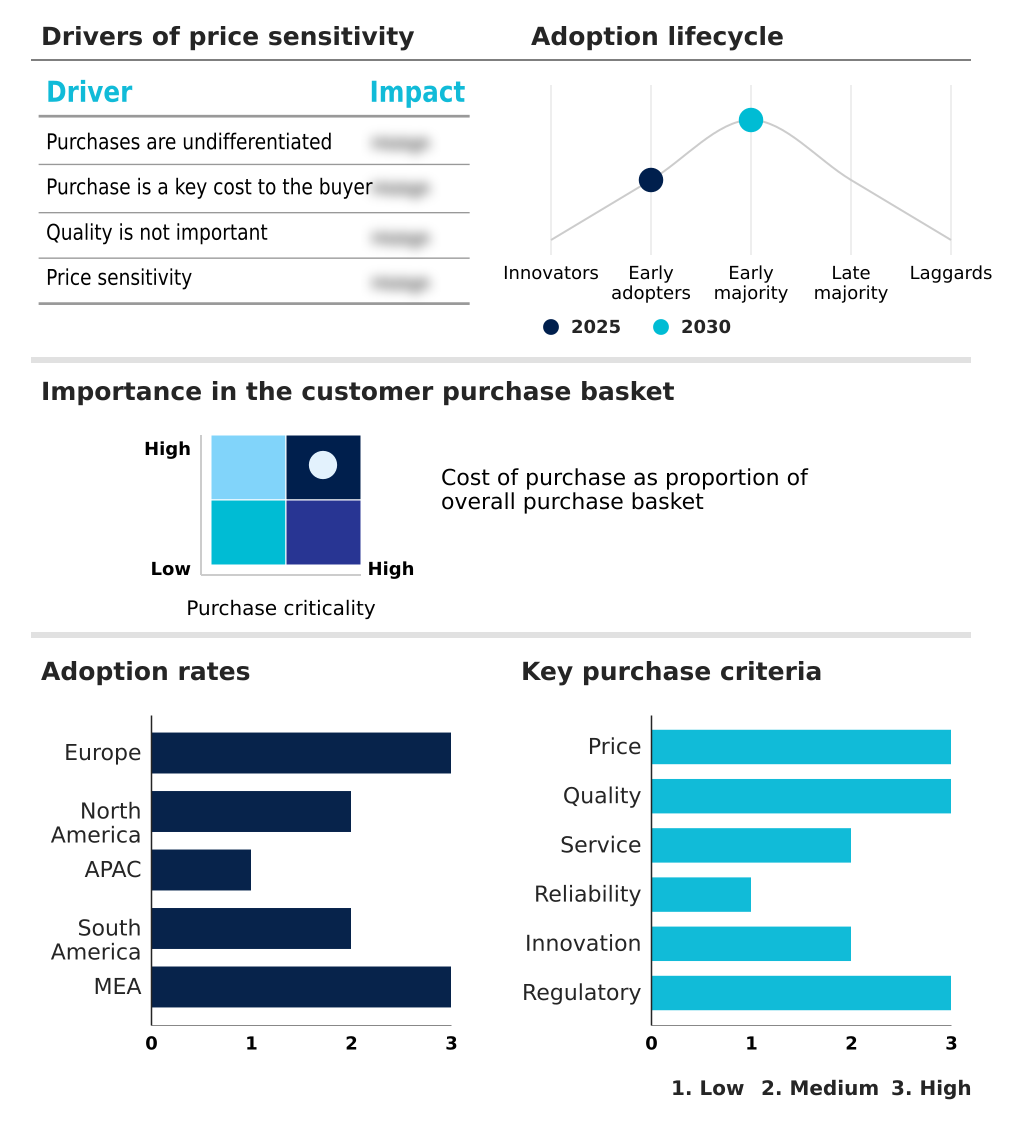
Customer Landscape of Vortex Flowmeter Industry

Competitive Landscape

Companies are implementing various strategies, such as strategic alliances, vortex flowmeter market forecast, partnerships, mergers and acquisitions, geographical expansion, and product/service launches, to enhance their presence in the industry.

ABB Ltd. - The key offering encompasses advanced flow measurement instrumentation designed to accurately monitor volumetric and mass flow rates across diverse industrial processes, enhancing operational control and utility management.

The industry research and growth report includes detailed analyses of the competitive landscape of the market and information about key companies, including:

  • ABB Ltd.
  • Azbil Corp.
  • Badger Meter Inc.
  • Baker Hughes Co.
  • Bopp and Reuther Messtechnik GmbH
  • Emerson Electric Co.
  • Endress Hauser Grp Services
  • Honeywell International Inc.
  • Hontzsch GmbH
  • ifm electronic gmbh
  • KOBOLD Instrumentatie BV
  • KROHNE Group
  • OVAL Corp.
  • Schneider Electric SE
  • Siemens AG
  • Sierra Instruments Inc.
  • Spirax Sarco Ltd.
  • Supmea Automation Co. Ltd.
  • SUTO iTEC GmbH
  • TOKYO KEISO CO. LTD.
  • VorTek Instruments LLC
  • Yokogawa Electric Corp.

Qualitative and quantitative analysis of companies has been conducted to help clients understand the wider business environment as well as the strengths and weaknesses of key industry players. Data is qualitatively analyzed to categorize companies as pure play, category-focused, industry-focused, and diversified; it is quantitatively analyzed to categorize companies as dominant, leading, strong, tentative, and weak.

Recent Development and News in Vortex flowmeter market

  • In the Electrical Components and Equipment industry, the aggressive transition toward digital plant architectures has driven a 20% increase in demand for intelligent field devices, directly impacting Vortex Flowmeter adoption by requiring a flanged inline meter with native foundation fieldbus interface and hart communication protocol capabilities to enable seamless data integration.
  • The enforcement of the EU Corporate Sustainability Reporting Directive has compelled industrial operators to establish strict energy management standard protocols, significantly accelerating the deployment of instruments capable of steam trap leak detection to verify carbon emission reporting and optimize boiler performance optimization.
  • Widespread integration of modular hydrogen electrolysis blocks has shifted balance-of-plant engineering specifications, generating a 30% rise in requirements for robust tools utilizing duplex stainless steel and nickel alloy hastelloy construction alongside hazardous area certification to safely monitor volatile gas streams.
  • Advancements in industrial automation networking have catalyzed the shift from legacy analog systems toward profinet digital integration, prompting process plants to upgrade utility architectures with advanced sensors meeting strict safety integrity level criteria capable of executing condition based maintenance algorithms.

Dive into Technavio’s robust research methodology, blending expert interviews, extensive data synthesis, and validated models for unparalleled Vortex Flowmeter Market insights. See full methodology.

Market Scope
Page number 314
Base year 2025
Historic period 2020-2024
Forecast period 2026-2030
Growth momentum & CAGR Accelerate at a CAGR of 6.1%
Market growth 2026-2030 USD 183441.7 thousand
Market structure Fragmented
YoY growth 2025-2026(%) 5.9%
Key countries Germany, UK, France, Italy, Spain, The Netherlands, US, Canada, Mexico, China, Japan, India, South Korea, Australia, Indonesia, Brazil, Argentina, Chile, Saudi Arabia, UAE, South Africa, Turkey and Israel
Competitive landscape Leading Companies, Market Positioning of Companies, Competitive Strategies, and Industry Risks

Request Free Sample

Research Analyst Overview

  • The Vortex Flowmeter domain is experiencing a structural pivot toward fully autonomous process monitoring, fundamentally altering how industrial facilities execute utility tracking. Plant engineering teams increasingly specify devices featuring a highly sensitive piezoelectric sensing element capable of capturing the precise vortex shedding frequency even under adverse hydraulic conditions.
  • By standardizing multivariable transmitter integration, facility managers eliminate the need for redundant temperature and pressure sensors, effectively reducing physical pipeline penetrations and lowering installation costs by 18% compared to traditional multi-instrument configurations. This architectural simplification directly supports accurate density compensated mass flow tracking, a critical factor for optimizing thermal energy budgets.
  • Furthermore, the integration of advanced in situ verification and continuous sensor health diagnostics allows maintenance crews to validate instrument performance without halting active production lines. Coupled with complete paddle wear elimination, these solid-state measurement solutions empower corporate executives to enforce stricter compliance frameworks, ensuring that energy allocation data remains indisputable during rigorous environmental audits and operational reviews.

What are the Key Data Covered in this Vortex Flowmeter Market Research and Growth Report?

  • What is the expected growth of the Vortex Flowmeter Market between 2026 and 2030?

    • USD 183.44 million, at a CAGR of 6.1%

  • What segmentation does the market report cover?

    • The report is segmented by End-user (Oil and gas industry, Power industry, Chemical and petrochemical, Food and beverage, and Others), Type (Inline vortex flowmeter, Massflow vortex flowmeter, and Insertion vortex flowmeter), Application (Liquids, Gases, Steam, and Corrosive fluids and slurries) and Geography (Europe, North America, APAC, South America, Middle East and Africa)

  • Which regions are analyzed in the report?

    • Europe, North America, APAC, South America and Middle East and Africa

  • What are the key growth drivers and market challenges?

    • Increasing mandatory energy management obligations for industrial steam systems, Tariff-driven surcharges on imported flowmeter assemblies and components

  • Who are the major players in the Vortex Flowmeter Market?

    • ABB Ltd., Azbil Corp., Badger Meter Inc., Baker Hughes Co., Bopp and Reuther Messtechnik GmbH, Emerson Electric Co., Endress Hauser Grp Services, Honeywell International Inc., Hontzsch GmbH, ifm electronic gmbh, KOBOLD Instrumentatie BV, KROHNE Group, OVAL Corp., Schneider Electric SE, Siemens AG, Sierra Instruments Inc., Spirax Sarco Ltd., Supmea Automation Co. Ltd., SUTO iTEC GmbH, TOKYO KEISO CO. LTD., VorTek Instruments LLC and Yokogawa Electric Corp.

Market Research Insights

  • The Vortex Flowmeter Market is fundamentally reshaping utility measurement by delivering highly reliable fluid monitoring without mechanical wear. Facilities adopting a wafer style instrument alongside a specialized reduced bore design have recorded a 20% increase in low-flow detection accuracy, translating directly to reduced energy waste.
  • Furthermore, upgrading wetted part metallurgy to withstand highly corrosive media has lowered premature equipment failure rates by 15%, securing critical process uptime. The implementation of hot tap insertion techniques further supports operational continuity, allowing engineers to service meters without halting production and yielding a 30% reduction in unplanned maintenance downtime.
  • These precise flow tracking capabilities empower industrial operators to optimize thermal energy distribution and ensure continuous regulatory compliance.

We can help! Our analysts can customize this vortex flowmeter market research report to meet your requirements.

Get in touch

1. Executive Summary

1.1 Market overview

Executive Summary - Chart on Market Overview
Executive Summary - Data Table on Market Overview
Executive Summary - Chart on Global Market Characteristics
Executive Summary - Chart on Market by Geography
Executive Summary - Chart on Market Segmentation by End-user
Executive Summary - Chart on Market Segmentation by Type
Executive Summary - Chart on Market Segmentation by Application
Executive Summary - Chart on Incremental Growth
Executive Summary - Data Table on Incremental Growth
Executive Summary - Chart on Company Market Positioning

2. Technavio Analysis

2.1 Analysis of price sensitivity, lifecycle, customer purchase basket, adoption rates, and purchase criteria

2.2 Criticality of inputs and Factors of differentiation

Chart on Overview on criticality of inputs and factors of differentiation

2.3 Factors of disruption

Chart on Overview on factors of disruption

2.4 Impact of drivers and challenges

Chart on Impact of drivers and challenges in 2025 and 2030

3. Market Landscape

3.1 Market ecosystem

Chart on Parent Market
Data Table on - Parent Market

3.2 Market characteristics

Chart on Market characteristics analysis

3.3 Value chain analysis

Chart on Value chain analysis

4. Market Sizing

4.1 Market definition

Data Table on Offerings of companies included in the market definition

4.2 Market segment analysis

Market segments

4.3 Market size 2025

4.4 Market outlook: Forecast for 2025-2030

Chart on Global - Market size and forecast 2025-2030 ($ thousand)
Data Table on Global - Market size and forecast 2025-2030 ($ thousand)
Chart on Global Market: Year-over-year growth 2025-2030 (%)
Data Table on Global Market: Year-over-year growth 2025-2030 (%)

5. Historic Market Size

5.1 Global Vortex Flowmeter Market 2020 - 2024

Historic Market Size - Data Table on Global Vortex Flowmeter Market 2020 - 2024 ($ thousand)

5.2 End-user segment analysis 2020 - 2024

Historic Market Size - End-user Segment 2020 - 2024 ($ thousand)

5.3 Type segment analysis 2020 - 2024

Historic Market Size - Type Segment 2020 - 2024 ($ thousand)

5.4 Application segment analysis 2020 - 2024

Historic Market Size - Application Segment 2020 - 2024 ($ thousand)

5.5 Geography segment analysis 2020 - 2024

Historic Market Size - Geography Segment 2020 - 2024 ($ thousand)

5.6 Country segment analysis 2020 - 2024

Historic Market Size - Country Segment 2020 - 2024 ($ thousand)

6. Qualitative Analysis

6.1 Impact of AI on global vortex flowmeter market

6.2 Impact of geopolitical conflicts on global vortex flowmeter market

7. Five Forces Analysis

7.1 Five forces summary

Five forces analysis - Comparison between 2025 and 2030

7.2 Bargaining power of buyers

Bargaining power of buyers - Impact of key factors 2025 and 2030

7.3 Bargaining power of suppliers

Bargaining power of suppliers - Impact of key factors in 2025 and 2030

7.4 Threat of new entrants

Threat of new entrants - Impact of key factors in 2025 and 2030

7.5 Threat of substitutes

Threat of substitutes - Impact of key factors in 2025 and 2030

7.6 Threat of rivalry

Threat of rivalry - Impact of key factors in 2025 and 2030

7.7 Market condition

Chart on Market condition - Five forces 2025 and 2030

8. Market Segmentation by End-user

8.1 Market segments

Chart on End-user - Market share 2025-2030 (%)
Data Table on End-user - Market share 2025-2030 (%)

8.2 Comparison by End-user

Chart on Comparison by End-user
Data Table on Comparison by End-user

8.3 Oil and gas industry - Market size and forecast 2025-2030

Chart on Oil and gas industry - Market size and forecast 2025-2030 ($ thousand)
Data Table on Oil and gas industry - Market size and forecast 2025-2030 ($ thousand)
Chart on Oil and gas industry - Year-over-year growth 2025-2030 (%)
Data Table on Oil and gas industry - Year-over-year growth 2025-2030 (%)

8.4 Power industry - Market size and forecast 2025-2030

Chart on Power industry - Market size and forecast 2025-2030 ($ thousand)
Data Table on Power industry - Market size and forecast 2025-2030 ($ thousand)
Chart on Power industry - Year-over-year growth 2025-2030 (%)
Data Table on Power industry - Year-over-year growth 2025-2030 (%)

8.5 Chemical and petrochemical - Market size and forecast 2025-2030

Chart on Chemical and petrochemical - Market size and forecast 2025-2030 ($ thousand)
Data Table on Chemical and petrochemical - Market size and forecast 2025-2030 ($ thousand)
Chart on Chemical and petrochemical - Year-over-year growth 2025-2030 (%)
Data Table on Chemical and petrochemical - Year-over-year growth 2025-2030 (%)

8.6 Food and beverage - Market size and forecast 2025-2030

Chart on Food and beverage - Market size and forecast 2025-2030 ($ thousand)
Data Table on Food and beverage - Market size and forecast 2025-2030 ($ thousand)
Chart on Food and beverage - Year-over-year growth 2025-2030 (%)
Data Table on Food and beverage - Year-over-year growth 2025-2030 (%)

8.7 Others - Market size and forecast 2025-2030

Chart on Others - Market size and forecast 2025-2030 ($ thousand)
Data Table on Others - Market size and forecast 2025-2030 ($ thousand)
Chart on Others - Year-over-year growth 2025-2030 (%)
Data Table on Others - Year-over-year growth 2025-2030 (%)

8.8 Market opportunity by End-user

Market opportunity by End-user ($ thousand)
Data Table on Market opportunity by End-user ($ thousand)

9. Market Segmentation by Type

9.1 Market segments

Chart on Type - Market share 2025-2030 (%)
Data Table on Type - Market share 2025-2030 (%)

9.2 Comparison by Type

Chart on Comparison by Type
Data Table on Comparison by Type

9.3 Inline vortex flowmeter - Market size and forecast 2025-2030

Chart on Inline vortex flowmeter - Market size and forecast 2025-2030 ($ thousand)
Data Table on Inline vortex flowmeter - Market size and forecast 2025-2030 ($ thousand)
Chart on Inline vortex flowmeter - Year-over-year growth 2025-2030 (%)
Data Table on Inline vortex flowmeter - Year-over-year growth 2025-2030 (%)

9.4 Massflow vortex flowmeter - Market size and forecast 2025-2030

Chart on Massflow vortex flowmeter - Market size and forecast 2025-2030 ($ thousand)
Data Table on Massflow vortex flowmeter - Market size and forecast 2025-2030 ($ thousand)
Chart on Massflow vortex flowmeter - Year-over-year growth 2025-2030 (%)
Data Table on Massflow vortex flowmeter - Year-over-year growth 2025-2030 (%)

9.5 Insertion vortex flowmeter - Market size and forecast 2025-2030

Chart on Insertion vortex flowmeter - Market size and forecast 2025-2030 ($ thousand)
Data Table on Insertion vortex flowmeter - Market size and forecast 2025-2030 ($ thousand)
Chart on Insertion vortex flowmeter - Year-over-year growth 2025-2030 (%)
Data Table on Insertion vortex flowmeter - Year-over-year growth 2025-2030 (%)

9.6 Market opportunity by Type

Market opportunity by Type ($ thousand)
Data Table on Market opportunity by Type ($ thousand)

10. Market Segmentation by Application

10.1 Market segments

Chart on Application - Market share 2025-2030 (%)
Data Table on Application - Market share 2025-2030 (%)

10.2 Comparison by Application

Chart on Comparison by Application
Data Table on Comparison by Application

10.3 Liquids - Market size and forecast 2025-2030

Chart on Liquids - Market size and forecast 2025-2030 ($ thousand)
Data Table on Liquids - Market size and forecast 2025-2030 ($ thousand)
Chart on Liquids - Year-over-year growth 2025-2030 (%)
Data Table on Liquids - Year-over-year growth 2025-2030 (%)

10.4 Gases - Market size and forecast 2025-2030

Chart on Gases - Market size and forecast 2025-2030 ($ thousand)
Data Table on Gases - Market size and forecast 2025-2030 ($ thousand)
Chart on Gases - Year-over-year growth 2025-2030 (%)
Data Table on Gases - Year-over-year growth 2025-2030 (%)

10.5 Steam - Market size and forecast 2025-2030

Chart on Steam - Market size and forecast 2025-2030 ($ thousand)
Data Table on Steam - Market size and forecast 2025-2030 ($ thousand)
Chart on Steam - Year-over-year growth 2025-2030 (%)
Data Table on Steam - Year-over-year growth 2025-2030 (%)

10.6 Corrosive fluids and slurries - Market size and forecast 2025-2030

Chart on Corrosive fluids and slurries - Market size and forecast 2025-2030 ($ thousand)
Data Table on Corrosive fluids and slurries - Market size and forecast 2025-2030 ($ thousand)
Chart on Corrosive fluids and slurries - Year-over-year growth 2025-2030 (%)
Data Table on Corrosive fluids and slurries - Year-over-year growth 2025-2030 (%)

10.7 Market opportunity by Application

Market opportunity by Application ($ thousand)
Data Table on Market opportunity by Application ($ thousand)

11. Customer Landscape

11.1 Customer landscape overview

Analysis of price sensitivity, lifecycle, customer purchase basket, adoption rates, and purchase criteria

12. Geographic Landscape

12.1 Geographic segmentation

Chart on Market share by geography 2025-2030 (%)
Data Table on Market share by geography 2025-2030 (%)

12.2 Geographic comparison

Chart on Geographic comparison
Data Table on Geographic comparison

12.3 Europe - Market size and forecast 2025-2030

Chart on Europe - Market size and forecast 2025-2030 ($ thousand)
Data Table on Europe - Market size and forecast 2025-2030 ($ thousand)
Chart on Europe - Year-over-year growth 2025-2030 (%)
Data Table on Europe - Year-over-year growth 2025-2030 (%)
Chart on Regional Comparison - Europe
Data Table on Regional Comparison - Europe

12.3.1 Germany - Market size and forecast 2025-2030

Chart on Germany - Market size and forecast 2025-2030 ($ thousand)
Data Table on Germany - Market size and forecast 2025-2030 ($ thousand)
Chart on Germany - Year-over-year growth 2025-2030 (%)
Data Table on Germany - Year-over-year growth 2025-2030 (%)

12.3.2 UK - Market size and forecast 2025-2030

Chart on UK - Market size and forecast 2025-2030 ($ thousand)
Data Table on UK - Market size and forecast 2025-2030 ($ thousand)
Chart on UK - Year-over-year growth 2025-2030 (%)
Data Table on UK - Year-over-year growth 2025-2030 (%)

12.3.3 France - Market size and forecast 2025-2030

Chart on France - Market size and forecast 2025-2030 ($ thousand)
Data Table on France - Market size and forecast 2025-2030 ($ thousand)
Chart on France - Year-over-year growth 2025-2030 (%)
Data Table on France - Year-over-year growth 2025-2030 (%)

12.3.4 Italy - Market size and forecast 2025-2030

Chart on Italy - Market size and forecast 2025-2030 ($ thousand)
Data Table on Italy - Market size and forecast 2025-2030 ($ thousand)
Chart on Italy - Year-over-year growth 2025-2030 (%)
Data Table on Italy - Year-over-year growth 2025-2030 (%)

12.3.5 Spain - Market size and forecast 2025-2030

Chart on Spain - Market size and forecast 2025-2030 ($ thousand)
Data Table on Spain - Market size and forecast 2025-2030 ($ thousand)
Chart on Spain - Year-over-year growth 2025-2030 (%)
Data Table on Spain - Year-over-year growth 2025-2030 (%)

12.3.6 The Netherlands - Market size and forecast 2025-2030

Chart on The Netherlands - Market size and forecast 2025-2030 ($ thousand)
Data Table on The Netherlands - Market size and forecast 2025-2030 ($ thousand)
Chart on The Netherlands - Year-over-year growth 2025-2030 (%)
Data Table on The Netherlands - Year-over-year growth 2025-2030 (%)

12.4 North America - Market size and forecast 2025-2030

Chart on North America - Market size and forecast 2025-2030 ($ thousand)
Data Table on North America - Market size and forecast 2025-2030 ($ thousand)
Chart on North America - Year-over-year growth 2025-2030 (%)
Data Table on North America - Year-over-year growth 2025-2030 (%)
Chart on Regional Comparison - North America
Data Table on Regional Comparison - North America

12.4.1 US - Market size and forecast 2025-2030

Chart on US - Market size and forecast 2025-2030 ($ thousand)
Data Table on US - Market size and forecast 2025-2030 ($ thousand)
Chart on US - Year-over-year growth 2025-2030 (%)
Data Table on US - Year-over-year growth 2025-2030 (%)

12.4.2 Canada - Market size and forecast 2025-2030

Chart on Canada - Market size and forecast 2025-2030 ($ thousand)
Data Table on Canada - Market size and forecast 2025-2030 ($ thousand)
Chart on Canada - Year-over-year growth 2025-2030 (%)
Data Table on Canada - Year-over-year growth 2025-2030 (%)

12.4.3 Mexico - Market size and forecast 2025-2030

Chart on Mexico - Market size and forecast 2025-2030 ($ thousand)
Data Table on Mexico - Market size and forecast 2025-2030 ($ thousand)
Chart on Mexico - Year-over-year growth 2025-2030 (%)
Data Table on Mexico - Year-over-year growth 2025-2030 (%)

12.5 APAC - Market size and forecast 2025-2030

Chart on APAC - Market size and forecast 2025-2030 ($ thousand)
Data Table on APAC - Market size and forecast 2025-2030 ($ thousand)
Chart on APAC - Year-over-year growth 2025-2030 (%)
Data Table on APAC - Year-over-year growth 2025-2030 (%)
Chart on Regional Comparison - APAC
Data Table on Regional Comparison - APAC

12.5.1 China - Market size and forecast 2025-2030

Chart on China - Market size and forecast 2025-2030 ($ thousand)
Data Table on China - Market size and forecast 2025-2030 ($ thousand)
Chart on China - Year-over-year growth 2025-2030 (%)
Data Table on China - Year-over-year growth 2025-2030 (%)

12.5.2 Japan - Market size and forecast 2025-2030

Chart on Japan - Market size and forecast 2025-2030 ($ thousand)
Data Table on Japan - Market size and forecast 2025-2030 ($ thousand)
Chart on Japan - Year-over-year growth 2025-2030 (%)
Data Table on Japan - Year-over-year growth 2025-2030 (%)

12.5.3 India - Market size and forecast 2025-2030

Chart on India - Market size and forecast 2025-2030 ($ thousand)
Data Table on India - Market size and forecast 2025-2030 ($ thousand)
Chart on India - Year-over-year growth 2025-2030 (%)
Data Table on India - Year-over-year growth 2025-2030 (%)

12.5.4 South Korea - Market size and forecast 2025-2030

Chart on South Korea - Market size and forecast 2025-2030 ($ thousand)
Data Table on South Korea - Market size and forecast 2025-2030 ($ thousand)
Chart on South Korea - Year-over-year growth 2025-2030 (%)
Data Table on South Korea - Year-over-year growth 2025-2030 (%)

12.5.5 Australia - Market size and forecast 2025-2030

Chart on Australia - Market size and forecast 2025-2030 ($ thousand)
Data Table on Australia - Market size and forecast 2025-2030 ($ thousand)
Chart on Australia - Year-over-year growth 2025-2030 (%)
Data Table on Australia - Year-over-year growth 2025-2030 (%)

12.5.6 Indonesia - Market size and forecast 2025-2030

Chart on Indonesia - Market size and forecast 2025-2030 ($ thousand)
Data Table on Indonesia - Market size and forecast 2025-2030 ($ thousand)
Chart on Indonesia - Year-over-year growth 2025-2030 (%)
Data Table on Indonesia - Year-over-year growth 2025-2030 (%)

12.6 South America - Market size and forecast 2025-2030

Chart on South America - Market size and forecast 2025-2030 ($ thousand)
Data Table on South America - Market size and forecast 2025-2030 ($ thousand)
Chart on South America - Year-over-year growth 2025-2030 (%)
Data Table on South America - Year-over-year growth 2025-2030 (%)
Chart on Regional Comparison - South America
Data Table on Regional Comparison - South America

12.6.1 Brazil - Market size and forecast 2025-2030

Chart on Brazil - Market size and forecast 2025-2030 ($ thousand)
Data Table on Brazil - Market size and forecast 2025-2030 ($ thousand)
Chart on Brazil - Year-over-year growth 2025-2030 (%)
Data Table on Brazil - Year-over-year growth 2025-2030 (%)

12.6.2 Argentina - Market size and forecast 2025-2030

Chart on Argentina - Market size and forecast 2025-2030 ($ thousand)
Data Table on Argentina - Market size and forecast 2025-2030 ($ thousand)
Chart on Argentina - Year-over-year growth 2025-2030 (%)
Data Table on Argentina - Year-over-year growth 2025-2030 (%)

12.6.3 Chile - Market size and forecast 2025-2030

Chart on Chile - Market size and forecast 2025-2030 ($ thousand)
Data Table on Chile - Market size and forecast 2025-2030 ($ thousand)
Chart on Chile - Year-over-year growth 2025-2030 (%)
Data Table on Chile - Year-over-year growth 2025-2030 (%)

12.7 Middle East and Africa - Market size and forecast 2025-2030

Chart on Middle East and Africa - Market size and forecast 2025-2030 ($ thousand)
Data Table on Middle East and Africa - Market size and forecast 2025-2030 ($ thousand)
Chart on Middle East and Africa - Year-over-year growth 2025-2030 (%)
Data Table on Middle East and Africa - Year-over-year growth 2025-2030 (%)
Chart on Regional Comparison - Middle East and Africa
Data Table on Regional Comparison - Middle East and Africa

12.7.1 Saudi Arabia - Market size and forecast 2025-2030

Chart on Saudi Arabia - Market size and forecast 2025-2030 ($ thousand)
Data Table on Saudi Arabia - Market size and forecast 2025-2030 ($ thousand)
Chart on Saudi Arabia - Year-over-year growth 2025-2030 (%)
Data Table on Saudi Arabia - Year-over-year growth 2025-2030 (%)

12.7.2 UAE - Market size and forecast 2025-2030

Chart on UAE - Market size and forecast 2025-2030 ($ thousand)
Data Table on UAE - Market size and forecast 2025-2030 ($ thousand)
Chart on UAE - Year-over-year growth 2025-2030 (%)
Data Table on UAE - Year-over-year growth 2025-2030 (%)

12.7.3 South Africa - Market size and forecast 2025-2030

Chart on South Africa - Market size and forecast 2025-2030 ($ thousand)
Data Table on South Africa - Market size and forecast 2025-2030 ($ thousand)
Chart on South Africa - Year-over-year growth 2025-2030 (%)
Data Table on South Africa - Year-over-year growth 2025-2030 (%)

12.7.4 Turkey - Market size and forecast 2025-2030

Chart on Turkey - Market size and forecast 2025-2030 ($ thousand)
Data Table on Turkey - Market size and forecast 2025-2030 ($ thousand)
Chart on Turkey - Year-over-year growth 2025-2030 (%)
Data Table on Turkey - Year-over-year growth 2025-2030 (%)

12.7.5 Israel - Market size and forecast 2025-2030

Chart on Israel - Market size and forecast 2025-2030 ($ thousand)
Data Table on Israel - Market size and forecast 2025-2030 ($ thousand)
Chart on Israel - Year-over-year growth 2025-2030 (%)
Data Table on Israel - Year-over-year growth 2025-2030 (%)

12.8 Market opportunity by geography

Market opportunity by geography ($ thousand)
Data Tables on Market opportunity by geography ($ thousand)

13. Drivers, Challenges, and Opportunity

13.1 Market drivers

Increasing mandatory energy management obligations for industrial steam systems
Expanding green hydrogen production and electrolyzer balance-of-plant installations
Advancing multivariable vortex designs for high-temperature steam and high-pressure service

13.2 Market challenges

Tariff-driven surcharges on imported flowmeter assemblies and components
Measurement instability under pipeline vibration and low Reynolds number flows
Price erosion from low-cost Chinese vortex meter manufacturers

13.3 Impact of drivers and challenges

Impact of drivers and challenges in 2025 and 2030

13.4 Market opportunities

Growing integration of Ethernet-APL connectivity in field vortex flowmeters
Increasing shift toward in-situ verification replacing removal-based recalibration
Expanding use of compact vortex sensors for machine-level cooling water monitoring

14. Competitive Landscape

14.1 Overview

14.2

Overview on criticality of inputs and factors of differentiation

14.3 Landscape disruption

Overview on factors of disruption

14.4 Industry risks

Impact of key risks on business

15. Competitive Analysis

15.1 Companies profiled

Companies covered

15.2 Company ranking index

15.3 Market positioning of companies

Matrix on companies position and classification

15.4 ABB Ltd.

ABB Ltd. - Overview
ABB Ltd. - Business segments
ABB Ltd. - Key news
ABB Ltd. - Key offerings
ABB Ltd. - Segment focus
SWOT

15.5 Azbil Corp.

Azbil Corp. - Overview
Azbil Corp. - Business segments
Azbil Corp. - Key offerings
Azbil Corp. - Segment focus
SWOT

15.6 Badger Meter Inc.

Badger Meter Inc. - Overview
Badger Meter Inc. - Product / Service
Badger Meter Inc. - Key offerings
SWOT

15.7 Baker Hughes Co.

Baker Hughes Co. - Overview
Baker Hughes Co. - Business segments
Baker Hughes Co. - Key news
Baker Hughes Co. - Key offerings
Baker Hughes Co. - Segment focus
SWOT

15.8 Bopp and Reuther Messtechnik GmbH

Bopp and Reuther Messtechnik GmbH - Overview
Bopp and Reuther Messtechnik GmbH - Product / Service
Bopp and Reuther Messtechnik GmbH - Key offerings
SWOT

15.9 Emerson Electric Co.

Emerson Electric Co. - Overview
Emerson Electric Co. - Business segments
Emerson Electric Co. - Key news
Emerson Electric Co. - Key offerings
Emerson Electric Co. - Segment focus
SWOT

15.10 Endress Hauser Grp Services

Endress Hauser Grp Services - Overview
Endress Hauser Grp Services - Product / Service
Endress Hauser Grp Services - Key offerings
SWOT

15.11 Honeywell International Inc.

Honeywell International Inc. - Overview
Honeywell International Inc. - Business segments
Honeywell International Inc. - Key news
Honeywell International Inc. - Key offerings
Honeywell International Inc. - Segment focus
SWOT

15.12 KOBOLD Instrumentatie BV

KOBOLD Instrumentatie BV - Overview
KOBOLD Instrumentatie BV - Product / Service
KOBOLD Instrumentatie BV - Key offerings
SWOT

15.13 KROHNE Group

KROHNE Group - Overview
KROHNE Group - Product / Service
KROHNE Group - Key offerings
SWOT

15.14 OVAL Corp.

OVAL Corp. - Overview
OVAL Corp. - Product / Service
OVAL Corp. - Key offerings
SWOT

15.15 Schneider Electric SE

Schneider Electric SE - Overview
Schneider Electric SE - Business segments
Schneider Electric SE - Key news
Schneider Electric SE - Key offerings
Schneider Electric SE - Segment focus
SWOT

15.16 Siemens AG

Siemens AG - Overview
Siemens AG - Business segments
Siemens AG - Key news
Siemens AG - Key offerings
Siemens AG - Segment focus
SWOT

15.17 TOKYO KEISO CO. LTD.

TOKYO KEISO CO. LTD. - Overview
TOKYO KEISO CO. LTD. - Product / Service
TOKYO KEISO CO. LTD. - Key offerings
SWOT

15.18 Yokogawa Electric Corp.

Yokogawa Electric Corp. - Overview
Yokogawa Electric Corp. - Business segments
Yokogawa Electric Corp. - Key offerings
Yokogawa Electric Corp. - Segment focus
SWOT

16. Appendix

16.1 Scope of the report

Market definition
Objectives
Notes and caveats

16.2 Inclusions and exclusions checklist

Inclusions checklist
Exclusions checklist

16.3 Currency conversion rates for US$

16.4 Research methodology

16.5 Data procurement

Information sources

16.6 Data validation

16.7 Validation techniques employed for market sizing

16.8 Data synthesis

16.9 360 degree market analysis

16.10 List of abbreviations

Research Methodology

Technavio presents a detailed picture of the market by way of study, synthesis, and summation of data from multiple sources. The analysts have presented the various facets of the market with a particular focus on identifying the key industry influencers. The data thus presented is comprehensive, reliable, and the result of extensive research, both primary and secondary.

INFORMATION SOURCES

Primary sources

  • Manufacturers and suppliers
  • Channel partners
  • Industry experts
  • Strategic decision makers

Secondary sources

  • Industry journals and periodicals
  • Government data
  • Financial reports of key industry players
  • Historical data
  • Press releases

DATA ANALYSIS

Data Synthesis

  • Collation of data
  • Estimation of key figures
  • Analysis of derived insights

Data Validation

  • Triangulation with data models
  • Reference against proprietary databases
  • Corroboration with industry experts

REPORT WRITING

Qualitative

  • Market drivers
  • Market challenges
  • Market trends
  • Five forces analysis

Quantitative

  • Market size and forecast
  • Market segmentation
  • Geographical insights
  • Competitive landscape

Interested in this report?

Get your sample now to see our research methodology and insights!

Download Now

Frequently Asked Questions

Vortex Flowmeter market growth will increase by USD 183441.7 thousand thousand during 2026-2030.

The Vortex Flowmeter market is expected to grow at a CAGR of 6.1% during 2026-2030.

Vortex Flowmeter market is segmented by End-user (Oil and gas industry, Power industry, Chemical and petrochemical, Food and beverage, Others) Type (Inline vortex flowmeter, Massflow vortex flowmeter, Insertion vortex flowmeter) Application (Liquids, Gases, Steam, Corrosive fluids and slurries)

ABB Ltd., Azbil Corp., Badger Meter Inc., Baker Hughes Co., Bopp and Reuther Messtechnik GmbH, Emerson Electric Co., Endress Hauser Grp Services, Honeywell International Inc., Hontzsch GmbH, ifm electronic gmbh, KOBOLD Instrumentatie BV, KROHNE Group, OVAL Corp., Schneider Electric SE, Siemens AG, Sierra Instruments Inc., Spirax Sarco Ltd., Supmea Automation Co. Ltd., SUTO iTEC GmbH, TOKYO KEISO CO. LTD., VorTek Instruments LLC, Yokogawa Electric Corp. are a few of the key vendors in the Vortex Flowmeter market.

APAC will register the highest growth rate of 29.8% among the other regions. Therefore, the Vortex Flowmeter market in APAC is expected to garner significant business opportunities for the vendors during the forecast period.

Germany, UK, France, Italy, Spain, The Netherlands, US, Canada, Mexico, China, Japan, India, South Korea, Australia, Indonesia, Brazil, Argentina, Chile, Saudi Arabia, UAE, South Africa, Turkey, Israel

  • Increasing mandatory energy management obligations for industrial steam systems is the driving factor this market.

The Vortex Flowmeter market vendors should focus on grabbing business opportunities from the End-user segment as it accounted for the largest market share in the base year.
RIA - Research AI Assistant
Ask RIA