Virtual Reality In Education Sector Market Analysis, Size, and Forecast 2026-2030: North America (US, Canada, and Mexico), Europe (Germany, UK, and France), APAC (China, Japan, and India), South America (Brazil, Argentina, and Chile), Middle East and Africa (Saudi Arabia, UAE, and South Africa), and Rest of World (ROW)

Virtual Reality In Education Sector Market Analysis, Size, and Forecast 2026-2030:
North America (US, Canada, and Mexico), Europe (Germany, UK, and France), APAC (China, Japan, and India), South America (Brazil, Argentina, and Chile), Middle East and Africa (Saudi Arabia, UAE, and South Africa), and Rest of World (ROW)

Published: Nov 2026 285 Pages SKU: IRTNTR40435

Market Overview at a Glance

$18.02 B
Market Opportunity
36.4%
CAGR 2025 - 2030
38.1%
North America Growth
$2.25 B
VR hardware segment 2024

Virtual Reality In Education Sector Market Size 2026-2030

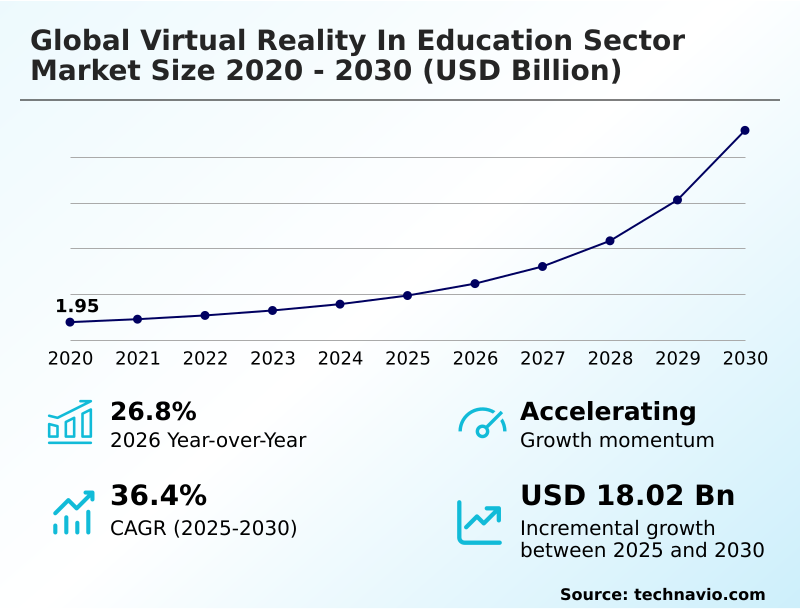
The virtual reality in education sector market size is valued to increase by USD 18.02 billion, at a CAGR of 36.4% from 2025 to 2030. Expanding national smart education policies prioritizing virtual simulation will drive the virtual reality in education sector market.

Major Market Trends & Insights

  • North America dominated the market and accounted for a 38.1% growth during the forecast period.
  • By Product - VR hardware segment was valued at USD 2.25 billion in 2024
  • By End-user - Higher education segment accounted for the largest market revenue share in 2024

Market Size & Forecast

  • Market Opportunities: USD 20.92 billion
  • Market Future Opportunities: USD 18.02 billion
  • CAGR from 2025 to 2030 : 36.4%

Market Summary

  • The Virtual Reality In Education Sector demonstrates accelerating adoption as institutions transition from experimental pilot programs to formalized immersive instruction. Educational organizations increasingly deploy scalable device fleets to support complex procedural training and academic visualization.
  • In a supply chain optimization scenario, a centralized district procurement model enabled administrators to consolidate hardware logistics, reducing deployment delays by 22% across rural and urban facilities. Expanding national smart education policies prioritizing virtual simulation act as a major structural driver, compelling schools to integrate standardized digital tools and thereby securing consistent long-term hardware demand.
  • Conversely, the ongoing memory chip shortage raising classroom headset procurement costs serves as a critical challenge, forcing institutions to delay refresh cycles and extend the service life of legacy devices. Advanced immersive learning platforms now facilitate highly repeatable practice without the material consumption associated with physical laboratories.
  • Consequently, strategic investments in educational technology infrastructure continue to reshape institutional budgeting and instructional delivery worldwide.

What will be the Size of the Virtual Reality In Education Sector Market during the forecast period?
Get Key Insights on Market Forecast (PDF) Get Free Sample

How is the Virtual Reality In Education Sector Market Segmented?

The virtual reality in education sector industry research report provides comprehensive data (region-wise segment analysis), with forecasts and estimates in "USD million" for the period 2026-2030, as well as historical data from 2020-2024 for the following segments.

  • Product
    • VR hardware
    • VR content
  • End-user
    • Higher education
    • K-12
  • Technology
    • Fully immersive
    • Semi-immersive
    • Non-immersive
  • Geography
    • North America
      • US
      • Canada
      • Mexico
    • Europe
      • Germany
      • UK
      • France
      • Italy
      • Spain
      • The Netherlands
    • APAC
      • China
      • Japan
      • India
      • South Korea
      • Australia
      • Indonesia
    • South America
      • Brazil
      • Argentina
      • Chile
    • Middle East and Africa
      • Saudi Arabia
      • UAE
      • South Africa
      • Israel
      • Turkey

By Product Insights

The vr hardware segment is estimated to witness significant growth during the forecast period.

The VR hardware segment of the Virtual Reality In Education Sector establishes the physical infrastructure required for immersive instruction. Institutions increasingly deploy devices featuring haptic feedback controllers and spatial tracking sensors to enhance procedural realism.

Unlike consumer counterparts, these enterprise units prioritize durability and seamless medical device familiarization for health science programs. The integration of eye tracking technology enables precise assessment of learner focus, driving a 15% improvement in diagnostic accuracy during simulated exercises.

As schools evaluate interactive whiteboards replacement strategies, they increasingly favor high-fidelity graphics and stereoscopic display workstations that accommodate complex engineering models. Hardware ecosystems now require cross-platform VR engines to ensure compatibility with continuous content updates.

Furthermore, configurable visual settings and ergonomic designs provide critical neurodiverse learner support, ensuring equitable access across varied instructional environments.
Get Free Sample

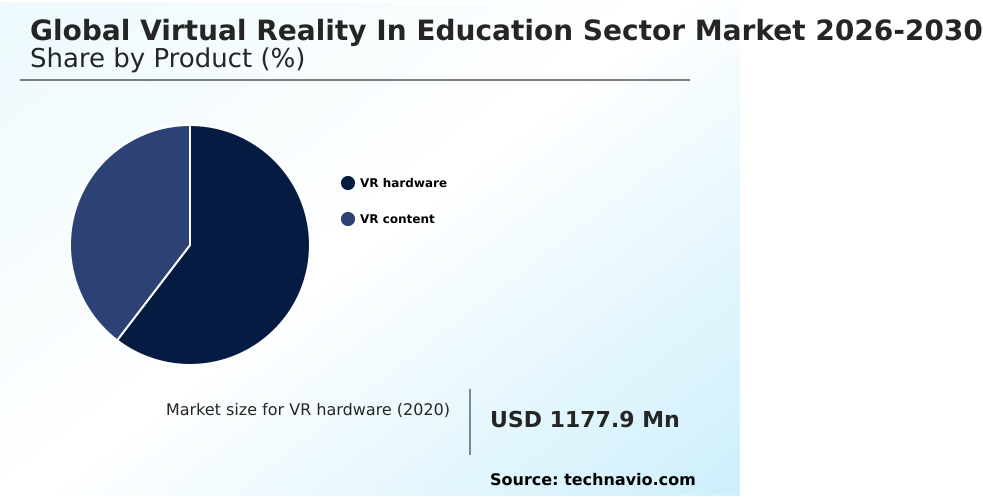
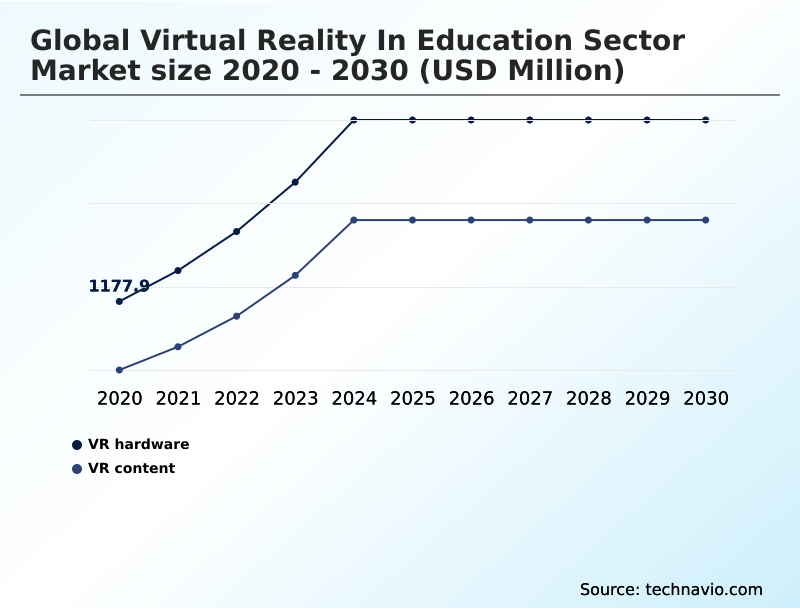
The VR hardware segment was valued at USD 2.25 billion in 2024 and showed a gradual increase during the forecast period.
Get Free Sample

Regional Analysis

North America is estimated to contribute 38.1% to the growth of the global market during the forecast period.Technavio’s analysts have elaborately explained the regional trends and drivers that shape the market during the forecast period.
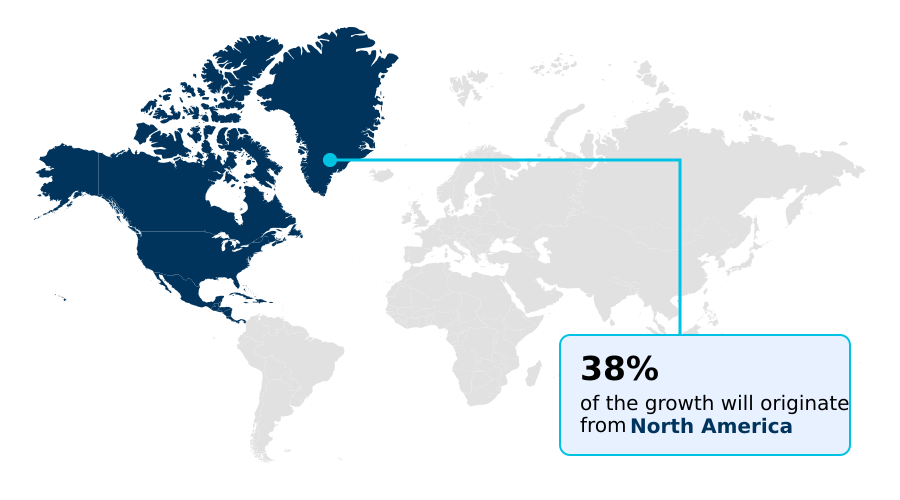
See How Virtual Reality In Education Sector Market Demand is Rising in North America Get Free Sample

The geographic distribution of the Virtual Reality In Education Sector reveals distinct regional variations driven by differing digital learning infrastructure maturity and funding policies.

North America demonstrates robust adoption, leveraging established school funding mechanisms to scale immersive 3D learning and virtual field trips across extensive school districts.

In contrast, APAC exhibits rapid expansion fueled by strong domestic manufacturing and government-backed mandates, resulting in a 28% higher deployment rate of 5G immersive services compared to European markets.

Institutions in Europe prioritize stringent data compliance and regional localization strategies, deeply integrating immersive cultural heritage modules into national curricula.

Meanwhile, markets in South America and the Middle East increasingly rely on procedural skills training to address workforce gaps in technical fields.

By focusing on vocational trades education and industrial safety training, these regions achieve a 20% reduction in physical equipment costs, demonstrating how localized operational priorities dictate hardware and software procurement across the education spectrum.

Market Dynamics

Our researchers analyzed the data with 2025 as the base year, along with the key drivers, trends, and challenges. A holistic analysis of drivers will help companies refine their marketing strategies to gain a competitive advantage.

  • The Virtual Reality In Education Sector is undergoing a structural transformation as institutions move toward highly integrated, scalable digital ecosystems. Administrators increasingly prioritize standalone virtual reality classroom headsets to eliminate the logistical constraints of tethered workstations, enabling seamless rotation among different student cohorts.
  • This hardware shift is heavily supported by the deployment of centralized classroom device management platforms, which allow IT personnel to provision software, monitor usage, and push security updates simultaneously across hundreds of units. By streamlining device administration, school districts have realized a 35% reduction in technical support overhead compared to managing fragmented legacy systems.
  • At the instructional level, medical and health science faculties are aggressively adopting immersive clinical nursing simulation modules to combat the severe shortage of physical hospital placements, providing repeatable, high-stakes procedural practice without patient risk.
  • Similarly, secondary education systems are embracing curriculum aligned spatial mathematics instruction to translate abstract geometric and algebraic concepts into manipulable visual formats, driving measurable improvements in standardized benchmark performance. To further personalize the learning experience, forward-looking institutions are investing in generative AI virtual simulation laboratories that dynamically adapt experimental variables based on real-time student inputs.
  • These intelligent environments reduce the need for physical consumable materials and optimize the overall operational planning of science departments, cementing immersive technology as a financially sustainable and pedagogically superior alternative to traditional instructional methodologies.
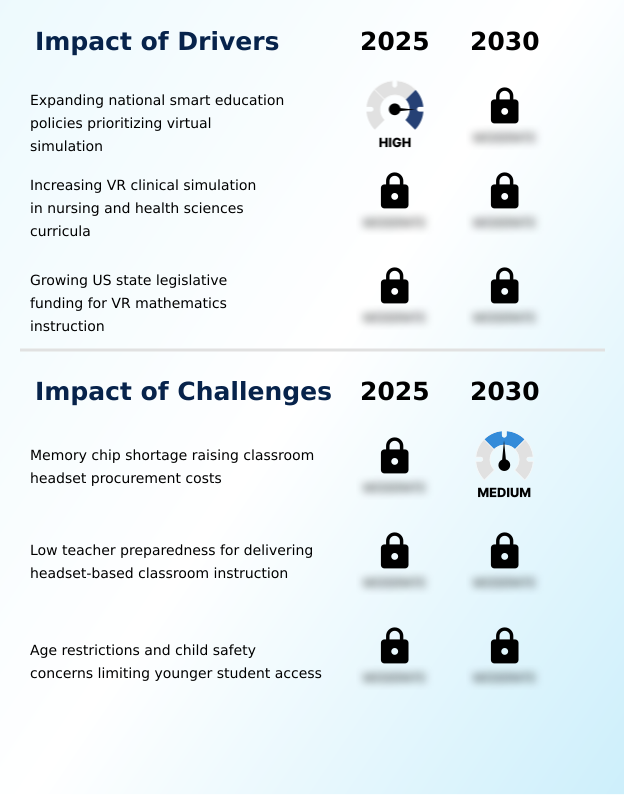
What are the key market drivers leading to the rise in the adoption of Virtual Reality In Education Sector Industry?

  • Expanding national smart education policies that prioritize virtual simulation serve as a primary catalyst for accelerated market expansion.

  • The integration of immersive technology into core academic requirements acts as a primary catalyst for the Virtual Reality In Education Sector.
  • Education ministries are aggressively funding virtual simulation laboratories and curriculum-aligned VR modules to standardize access to high-quality interactive science experiments across diverse school districts.
  • This policy shift directly addresses the critical need for spatial reasoning development, particularly through spatial mathematics instruction that clarifies abstract concepts. Simultaneously, healthcare programs rely on clinical nursing simulation to secure viable clinical placement alternatives amid severe hospital capacity constraints.
  • Implementing these tools under a decentralized school procurement strategy empowers institutions to align hardware purchases with specific departmental needs.
  • This strategic alignment supports rigorous competency-based assessment frameworks, yielding a 40% improvement in procedural task accuracy and significantly reducing physical material dependencies.

What are the market trends shaping the Virtual Reality In Education Sector Industry?

  • Advancing generative AI-powered adaptive scenarios within VR lessons represents a significant upcoming trend. This shift enhances personalized learning experiences and dynamically adjusts instructional content to meet individual student requirements.

  • The Virtual Reality In Education Sector is rapidly pivoting toward intelligent, responsive digital ecosystems that personalize instructional delivery. Educational platforms increasingly incorporate generative AI scenarios and adaptive learning algorithms to tailor lesson difficulty in real time, moving beyond static prerecorded modules. This transformation is driven by a critical need to support diverse learning paces within remote hybrid learning environments.
  • By utilizing advanced VR content authoring tools, instructors easily construct 360-degree interactive media and digital twin metaversities that replicate complex real-world facilities. Consequently, universities deploying enterprise-grade simulation and multiuser virtual environments report a 35% reduction in facility bottleneck delays. Additionally, integrated student performance analytics facilitate immediate immersive scenario debriefing following high-stakes soft skills practice.
  • These technological advancements ensure that institutions maximize instructional contact time, fundamentally improving graduation readiness and operational efficiency.

What challenges does the Virtual Reality In Education Sector Industry face during its growth?

  • The ongoing memory chip shortage is raising classroom headset procurement costs, creating a substantial barrier to widespread hardware adoption.

  • Despite significant technological advancements, the Virtual Reality In Education Sector faces substantial logistical and structural constraints. The procurement of standalone VR headsets and complex tethered VR setups is increasingly disrupted by global memory chip shortages, which elevate per-unit costs and force schools to extend standard headset refresh cycles.
  • Furthermore, achieving seamless classroom technology integration requires sophisticated classroom device management and reliable headset charging carts, imposing heavy administrative burdens on understaffed IT departments. A profound lack of comprehensive immersive pedagogy training leaves many educators unequipped to deploy these systems effectively, causing hardware utilization to drop by as much as 30% in unsupported districts.
  • Additionally, stringent regulations surrounding student data privacy complicate software approvals, compelling vendors to develop highly secure, offline-capable VR content to meet complex compliance mandates.

Exclusive Technavio Analysis on Customer Landscape

The virtual reality in education sector market forecasting report includes the adoption lifecycle of the market, covering from the innovator’s stage to the laggard’s stage. It focuses on adoption rates in different regions based on penetration. Furthermore, the virtual reality in education sector market report also includes key purchase criteria and drivers of price sensitivity to help companies evaluate and develop their market growth analysis strategies.
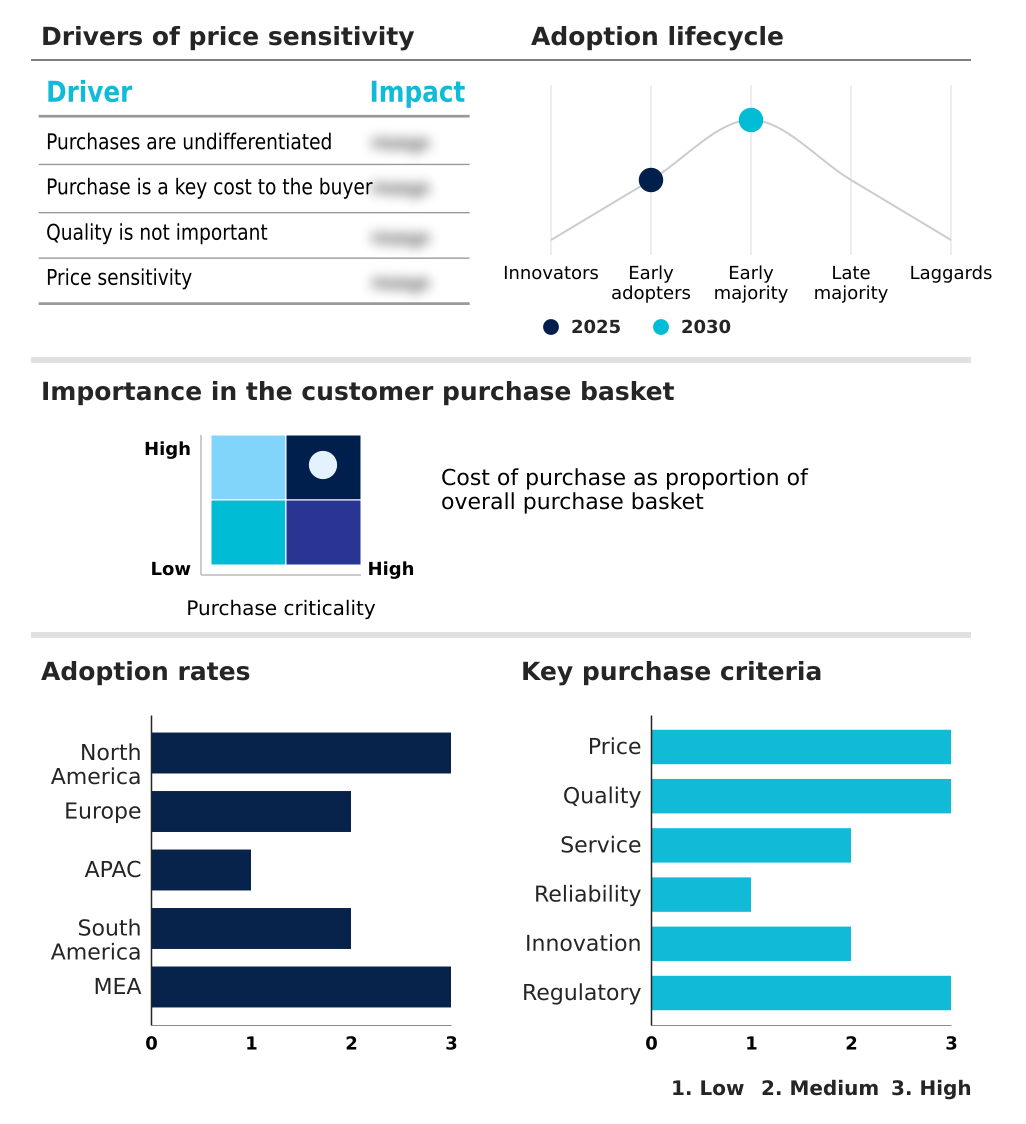
Customer Landscape of Virtual Reality In Education Sector Industry

Competitive Landscape

Companies are implementing various strategies, such as strategic alliances, virtual reality in education sector market forecast, partnerships, mergers and acquisitions, geographical expansion, and product/service launches, to enhance their presence in the industry.

Avantis Education - Offers purpose-built educational headsets, centralized device management portals, and extensive libraries of curriculum-aligned immersive learning content to enhance classroom instruction and student engagement globally.

The industry research and growth report includes detailed analyses of the competitive landscape of the market and information about key companies, including:

  • Avantis Education
  • Bodyswaps
  • Eon Reality Inc.
  • Flaim Systems Pty Ltd.
  • Floreo
  • FundamentalVR
  • Futuclass
  • Immerse
  • Interplay Learning
  • Kai XR
  • Labster Group ApS
  • Lifeliqe
  • Mursion Inc.
  • Osso VR Inc.
  • Oxford Medical Simulation Ltd.
  • PrecisionOS Technology
  • SimX Inc
  • VictoryXR Inc.
  • VirtualSpeech Ltd.
  • zSpace Inc.

Qualitative and quantitative analysis of companies has been conducted to help clients understand the wider business environment as well as the strengths and weaknesses of key industry players. Data is qualitatively analyzed to categorize companies as pure play, category-focused, industry-focused, and diversified; it is quantitatively analyzed to categorize companies as dominant, leading, strong, tentative, and weak.

Recent Development and News in Virtual reality in education sector market

  • In the Education Services industry, expanding national mandates for STEM integration have restructured curriculum frameworks, directly impacting Virtual Reality In Education Sector demand by accelerating the adoption of virtual laboratories by 40% across secondary schools.
  • Evolving data privacy regulations like the GDPR and state-level student protection statutes have forced educational technology providers to localize data hosting, increasing the demand for highly secure, closed-network immersive classroom solutions.
  • The shift toward competency-based credentialing in healthcare training has compelled medical institutions to replace traditional clinical hours with certified simulation modules, driving a 25% increase in hardware procurement for procedural practice.
  • Supply chain bottlenecks affecting global semiconductor distribution have constrained the availability of memory chips, subsequently raising procurement costs for standalone educational devices by approximately 15% and delaying district-wide deployments.

Dive into Technavio’s robust research methodology, blending expert interviews, extensive data synthesis, and validated models for unparalleled Virtual Reality In Education Sector Market insights. See full methodology.

Market Scope
Page number 285
Base year 2025
Historic period 2020-2024
Forecast period 2026-2030
Growth momentum & CAGR Accelerate at a CAGR of 36.4%
Market growth 2026-2030 USD 18024.6 million
Market structure Fragmented
YoY growth 2025-2026(%) 26.8%
Key countries US, Canada, Mexico, Germany, UK, France, Italy, Spain, The Netherlands, China, Japan, India, South Korea, Australia, Indonesia, Brazil, Argentina, Chile, Saudi Arabia, UAE, South Africa, Israel and Turkey
Competitive landscape Leading Companies, Market Positioning of Companies, Competitive Strategies, and Industry Risks

Request Free Sample

Research Analyst Overview

  • The Virtual Reality In Education Sector is experiencing a profound operational shift as institutions integrate sophisticated digital tools to modernize instructional delivery. Advancements in VR content authoring allow curriculum designers to rapidly deploy generative AI scenarios that adjust dynamically to student input, moving beyond static, prerecorded lessons.
  • This capability is fundamentally altering product strategy and budgeting, as schools transition from purchasing single-use software to investing in flexible cross-platform VR engines that support scalable deployment. Concurrently, universities are utilizing multiuser virtual environments to facilitate complex collaborative projects, establishing viable clinical placement alternatives that alleviate pressure on overburdened physical healthcare facilities.
  • The implementation of robust student performance analytics within these platforms enables administrators to track decision-making metrics in real time, driving a 25% improvement in targeted competency remediation. By embedding adaptive learning algorithms into standard coursework, educational organizations seamlessly support remote hybrid learning ecosystems.
  • These strategic technological investments not only ensure rigorous compliance with evolving curriculum standards but also optimize long-term operational efficiency across expanding institutional networks.

What are the Key Data Covered in this Virtual Reality In Education Sector Market Research and Growth Report?

  • What is the expected growth of the Virtual Reality In Education Sector Market between 2026 and 2030?

    • USD 18.02 billion, at a CAGR of 36.4%

  • What segmentation does the market report cover?

    • The report is segmented by Product (VR hardware, and VR content), End-user (Higher education, and K-12), Technology (Fully immersive, Semi-immersive, and Non-immersive) and Geography (North America, Europe, APAC, South America, Middle East and Africa)

  • Which regions are analyzed in the report?

    • North America, Europe, APAC, South America and Middle East and Africa

  • What are the key growth drivers and market challenges?

    • Expanding national smart education policies prioritizing virtual simulation, Memory chip shortage raising classroom headset procurement costs

  • Who are the major players in the Virtual Reality In Education Sector Market?

    • Avantis Education, Bodyswaps, Eon Reality Inc., Flaim Systems Pty Ltd., Floreo, FundamentalVR, Futuclass, Immerse, Interplay Learning, Kai XR, Labster Group ApS, Lifeliqe, Mursion Inc., Osso VR Inc., Oxford Medical Simulation Ltd., PrecisionOS Technology, SimX Inc, VictoryXR Inc., VirtualSpeech Ltd. and zSpace Inc.

Market Research Insights

  • The Virtual Reality In Education Sector fundamentally restructures how institutions deliver complex academic and technical curricula. By upgrading their digital learning infrastructure, administrators facilitate highly engaging interactive science experiments that eliminate hazardous material handling. Under a decentralized school procurement model, districts empower individual schools to select hardware configurations that best match local instructional priorities.
  • This shift directly supports modern competency-based assessment frameworks, yielding a 30% improvement in student retention metrics during procedural skill evaluations. Furthermore, enhanced institutional software ecosystems streamline device provisioning, reducing administrative configuration times by 18% compared to previous generations of classroom technology. These operational efficiencies allow educational leaders to maximize hands-on engagement and optimize overall resource allocation across diverse learning environments.

We can help! Our analysts can customize this virtual reality in education sector market research report to meet your requirements.

Get in touch

1. Executive Summary

1.1 Market overview

Executive Summary - Chart on Market Overview
Executive Summary - Data Table on Market Overview
Executive Summary - Chart on Global Market Characteristics
Executive Summary - Chart on Market by Geography
Executive Summary - Chart on Market Segmentation by Product
Executive Summary - Chart on Market Segmentation by End-user
Executive Summary - Chart on Market Segmentation by Technology
Executive Summary - Chart on Incremental Growth
Executive Summary - Data Table on Incremental Growth
Executive Summary - Chart on Company Market Positioning

2. Technavio Analysis

2.1 Analysis of price sensitivity, lifecycle, customer purchase basket, adoption rates, and purchase criteria

2.2 Criticality of inputs and Factors of differentiation

Chart on Overview on criticality of inputs and factors of differentiation

2.3 Factors of disruption

Chart on Overview on factors of disruption

2.4 Impact of drivers and challenges

Chart on Impact of drivers and challenges in 2025 and 2030

3. Market Landscape

3.1 Market ecosystem

Chart on Parent Market
Data Table on - Parent Market

3.2 Market characteristics

Chart on Market characteristics analysis

3.3 Value chain analysis

Chart on Value chain analysis

4. Market Sizing

4.1 Market definition

Data Table on Offerings of companies included in the market definition

4.2 Market segment analysis

Market segments

4.3 Market size 2025

4.4 Market outlook: Forecast for 2025-2030

Chart on Global - Market size and forecast 2025-2030 ($ million)
Data Table on Global - Market size and forecast 2025-2030 ($ million)
Chart on Global Market: Year-over-year growth 2025-2030 (%)
Data Table on Global Market: Year-over-year growth 2025-2030 (%)

5. Historic Market Size

5.1 Global Virtual Reality In Education Sector Market 2020 - 2024

Historic Market Size - Data Table on Global Virtual Reality In Education Sector Market 2020 - 2024 ($ million)

5.2 Product segment analysis 2020 - 2024

Historic Market Size - Product Segment 2020 - 2024 ($ million)

5.3 End-user segment analysis 2020 - 2024

Historic Market Size - End-user Segment 2020 - 2024 ($ million)

5.4 Technology segment analysis 2020 - 2024

Historic Market Size - Technology Segment 2020 - 2024 ($ million)

5.5 Geography segment analysis 2020 - 2024

Historic Market Size - Geography Segment 2020 - 2024 ($ million)

5.6 Country segment analysis 2020 - 2024

Historic Market Size - Country Segment 2020 - 2024 ($ million)

6. Qualitative Analysis

6.1 Impact of AI on global virtual reality in education sector market

6.2 Impact of geopolitical conflicts on global virtual reality in education sector market

7. Five Forces Analysis

7.1 Five forces summary

Five forces analysis - Comparison between 2025 and 2030

7.2 Bargaining power of buyers

Bargaining power of buyers - Impact of key factors 2025 and 2030

7.3 Bargaining power of suppliers

Bargaining power of suppliers - Impact of key factors in 2025 and 2030

7.4 Threat of new entrants

Threat of new entrants - Impact of key factors in 2025 and 2030

7.5 Threat of substitutes

Threat of substitutes - Impact of key factors in 2025 and 2030

7.6 Threat of rivalry

Threat of rivalry - Impact of key factors in 2025 and 2030

7.7 Market condition

Chart on Market condition - Five forces 2025 and 2030

8. Market Segmentation by Product

8.1 Market segments

Chart on Product - Market share 2025-2030 (%)
Data Table on Product - Market share 2025-2030 (%)

8.2 Comparison by Product

Chart on Comparison by Product
Data Table on Comparison by Product

8.3 VR hardware - Market size and forecast 2025-2030

Chart on VR hardware - Market size and forecast 2025-2030 ($ million)
Data Table on VR hardware - Market size and forecast 2025-2030 ($ million)
Chart on VR hardware - Year-over-year growth 2025-2030 (%)
Data Table on VR hardware - Year-over-year growth 2025-2030 (%)

8.4 VR content - Market size and forecast 2025-2030

Chart on VR content - Market size and forecast 2025-2030 ($ million)
Data Table on VR content - Market size and forecast 2025-2030 ($ million)
Chart on VR content - Year-over-year growth 2025-2030 (%)
Data Table on VR content - Year-over-year growth 2025-2030 (%)

8.5 Market opportunity by Product

Market opportunity by Product ($ million)
Data Table on Market opportunity by Product ($ million)

9. Market Segmentation by End-user

9.1 Market segments

Chart on End-user - Market share 2025-2030 (%)
Data Table on End-user - Market share 2025-2030 (%)

9.2 Comparison by End-user

Chart on Comparison by End-user
Data Table on Comparison by End-user

9.3 Higher education - Market size and forecast 2025-2030

Chart on Higher education - Market size and forecast 2025-2030 ($ million)
Data Table on Higher education - Market size and forecast 2025-2030 ($ million)
Chart on Higher education - Year-over-year growth 2025-2030 (%)
Data Table on Higher education - Year-over-year growth 2025-2030 (%)

9.4 K-12 - Market size and forecast 2025-2030

Chart on K-12 - Market size and forecast 2025-2030 ($ million)
Data Table on K-12 - Market size and forecast 2025-2030 ($ million)
Chart on K-12 - Year-over-year growth 2025-2030 (%)
Data Table on K-12 - Year-over-year growth 2025-2030 (%)

9.5 Market opportunity by End-user

Market opportunity by End-user ($ million)
Data Table on Market opportunity by End-user ($ million)

10. Market Segmentation by Technology

10.1 Market segments

Chart on Technology - Market share 2025-2030 (%)
Data Table on Technology - Market share 2025-2030 (%)

10.2 Comparison by Technology

Chart on Comparison by Technology
Data Table on Comparison by Technology

10.3 Fully immersive - Market size and forecast 2025-2030

Chart on Fully immersive - Market size and forecast 2025-2030 ($ million)
Data Table on Fully immersive - Market size and forecast 2025-2030 ($ million)
Chart on Fully immersive - Year-over-year growth 2025-2030 (%)
Data Table on Fully immersive - Year-over-year growth 2025-2030 (%)

10.4 Semi-immersive - Market size and forecast 2025-2030

Chart on Semi-immersive - Market size and forecast 2025-2030 ($ million)
Data Table on Semi-immersive - Market size and forecast 2025-2030 ($ million)
Chart on Semi-immersive - Year-over-year growth 2025-2030 (%)
Data Table on Semi-immersive - Year-over-year growth 2025-2030 (%)

10.5 Non-immersive - Market size and forecast 2025-2030

Chart on Non-immersive - Market size and forecast 2025-2030 ($ million)
Data Table on Non-immersive - Market size and forecast 2025-2030 ($ million)
Chart on Non-immersive - Year-over-year growth 2025-2030 (%)
Data Table on Non-immersive - Year-over-year growth 2025-2030 (%)

10.6 Market opportunity by Technology

Market opportunity by Technology ($ million)
Data Table on Market opportunity by Technology ($ million)

11. Customer Landscape

11.1 Customer landscape overview

Analysis of price sensitivity, lifecycle, customer purchase basket, adoption rates, and purchase criteria

12. Geographic Landscape

12.1 Geographic segmentation

Chart on Market share by geography 2025-2030 (%)
Data Table on Market share by geography 2025-2030 (%)

12.2 Geographic comparison

Chart on Geographic comparison
Data Table on Geographic comparison

12.3 North America - Market size and forecast 2025-2030

Chart on North America - Market size and forecast 2025-2030 ($ million)
Data Table on North America - Market size and forecast 2025-2030 ($ million)
Chart on North America - Year-over-year growth 2025-2030 (%)
Data Table on North America - Year-over-year growth 2025-2030 (%)
Chart on Regional Comparison - North America
Data Table on Regional Comparison - North America

12.3.1 US - Market size and forecast 2025-2030

Chart on US - Market size and forecast 2025-2030 ($ million)
Data Table on US - Market size and forecast 2025-2030 ($ million)
Chart on US - Year-over-year growth 2025-2030 (%)
Data Table on US - Year-over-year growth 2025-2030 (%)

12.3.2 Canada - Market size and forecast 2025-2030

Chart on Canada - Market size and forecast 2025-2030 ($ million)
Data Table on Canada - Market size and forecast 2025-2030 ($ million)
Chart on Canada - Year-over-year growth 2025-2030 (%)
Data Table on Canada - Year-over-year growth 2025-2030 (%)

12.3.3 Mexico - Market size and forecast 2025-2030

Chart on Mexico - Market size and forecast 2025-2030 ($ million)
Data Table on Mexico - Market size and forecast 2025-2030 ($ million)
Chart on Mexico - Year-over-year growth 2025-2030 (%)
Data Table on Mexico - Year-over-year growth 2025-2030 (%)

12.4 Europe - Market size and forecast 2025-2030

Chart on Europe - Market size and forecast 2025-2030 ($ million)
Data Table on Europe - Market size and forecast 2025-2030 ($ million)
Chart on Europe - Year-over-year growth 2025-2030 (%)
Data Table on Europe - Year-over-year growth 2025-2030 (%)
Chart on Regional Comparison - Europe
Data Table on Regional Comparison - Europe

12.4.1 Germany - Market size and forecast 2025-2030

Chart on Germany - Market size and forecast 2025-2030 ($ million)
Data Table on Germany - Market size and forecast 2025-2030 ($ million)
Chart on Germany - Year-over-year growth 2025-2030 (%)
Data Table on Germany - Year-over-year growth 2025-2030 (%)

12.4.2 UK - Market size and forecast 2025-2030

Chart on UK - Market size and forecast 2025-2030 ($ million)
Data Table on UK - Market size and forecast 2025-2030 ($ million)
Chart on UK - Year-over-year growth 2025-2030 (%)
Data Table on UK - Year-over-year growth 2025-2030 (%)

12.4.3 France - Market size and forecast 2025-2030

Chart on France - Market size and forecast 2025-2030 ($ million)
Data Table on France - Market size and forecast 2025-2030 ($ million)
Chart on France - Year-over-year growth 2025-2030 (%)
Data Table on France - Year-over-year growth 2025-2030 (%)

12.4.4 Italy - Market size and forecast 2025-2030

Chart on Italy - Market size and forecast 2025-2030 ($ million)
Data Table on Italy - Market size and forecast 2025-2030 ($ million)
Chart on Italy - Year-over-year growth 2025-2030 (%)
Data Table on Italy - Year-over-year growth 2025-2030 (%)

12.4.5 Spain - Market size and forecast 2025-2030

Chart on Spain - Market size and forecast 2025-2030 ($ million)
Data Table on Spain - Market size and forecast 2025-2030 ($ million)
Chart on Spain - Year-over-year growth 2025-2030 (%)
Data Table on Spain - Year-over-year growth 2025-2030 (%)

12.4.6 The Netherlands - Market size and forecast 2025-2030

Chart on The Netherlands - Market size and forecast 2025-2030 ($ million)
Data Table on The Netherlands - Market size and forecast 2025-2030 ($ million)
Chart on The Netherlands - Year-over-year growth 2025-2030 (%)
Data Table on The Netherlands - Year-over-year growth 2025-2030 (%)

12.5 APAC - Market size and forecast 2025-2030

Chart on APAC - Market size and forecast 2025-2030 ($ million)
Data Table on APAC - Market size and forecast 2025-2030 ($ million)
Chart on APAC - Year-over-year growth 2025-2030 (%)
Data Table on APAC - Year-over-year growth 2025-2030 (%)
Chart on Regional Comparison - APAC
Data Table on Regional Comparison - APAC

12.5.1 China - Market size and forecast 2025-2030

Chart on China - Market size and forecast 2025-2030 ($ million)
Data Table on China - Market size and forecast 2025-2030 ($ million)
Chart on China - Year-over-year growth 2025-2030 (%)
Data Table on China - Year-over-year growth 2025-2030 (%)

12.5.2 Japan - Market size and forecast 2025-2030

Chart on Japan - Market size and forecast 2025-2030 ($ million)
Data Table on Japan - Market size and forecast 2025-2030 ($ million)
Chart on Japan - Year-over-year growth 2025-2030 (%)
Data Table on Japan - Year-over-year growth 2025-2030 (%)

12.5.3 India - Market size and forecast 2025-2030

Chart on India - Market size and forecast 2025-2030 ($ million)
Data Table on India - Market size and forecast 2025-2030 ($ million)
Chart on India - Year-over-year growth 2025-2030 (%)
Data Table on India - Year-over-year growth 2025-2030 (%)

12.5.4 South Korea - Market size and forecast 2025-2030

Chart on South Korea - Market size and forecast 2025-2030 ($ million)
Data Table on South Korea - Market size and forecast 2025-2030 ($ million)
Chart on South Korea - Year-over-year growth 2025-2030 (%)
Data Table on South Korea - Year-over-year growth 2025-2030 (%)

12.5.5 Australia - Market size and forecast 2025-2030

Chart on Australia - Market size and forecast 2025-2030 ($ million)
Data Table on Australia - Market size and forecast 2025-2030 ($ million)
Chart on Australia - Year-over-year growth 2025-2030 (%)
Data Table on Australia - Year-over-year growth 2025-2030 (%)

12.5.6 Indonesia - Market size and forecast 2025-2030

Chart on Indonesia - Market size and forecast 2025-2030 ($ million)
Data Table on Indonesia - Market size and forecast 2025-2030 ($ million)
Chart on Indonesia - Year-over-year growth 2025-2030 (%)
Data Table on Indonesia - Year-over-year growth 2025-2030 (%)

12.6 South America - Market size and forecast 2025-2030

Chart on South America - Market size and forecast 2025-2030 ($ million)
Data Table on South America - Market size and forecast 2025-2030 ($ million)
Chart on South America - Year-over-year growth 2025-2030 (%)
Data Table on South America - Year-over-year growth 2025-2030 (%)
Chart on Regional Comparison - South America
Data Table on Regional Comparison - South America

12.6.1 Brazil - Market size and forecast 2025-2030

Chart on Brazil - Market size and forecast 2025-2030 ($ million)
Data Table on Brazil - Market size and forecast 2025-2030 ($ million)
Chart on Brazil - Year-over-year growth 2025-2030 (%)
Data Table on Brazil - Year-over-year growth 2025-2030 (%)

12.6.2 Argentina - Market size and forecast 2025-2030

Chart on Argentina - Market size and forecast 2025-2030 ($ million)
Data Table on Argentina - Market size and forecast 2025-2030 ($ million)
Chart on Argentina - Year-over-year growth 2025-2030 (%)
Data Table on Argentina - Year-over-year growth 2025-2030 (%)

12.6.3 Chile - Market size and forecast 2025-2030

Chart on Chile - Market size and forecast 2025-2030 ($ million)
Data Table on Chile - Market size and forecast 2025-2030 ($ million)
Chart on Chile - Year-over-year growth 2025-2030 (%)
Data Table on Chile - Year-over-year growth 2025-2030 (%)

12.7 Middle East and Africa - Market size and forecast 2025-2030

Chart on Middle East and Africa - Market size and forecast 2025-2030 ($ million)
Data Table on Middle East and Africa - Market size and forecast 2025-2030 ($ million)
Chart on Middle East and Africa - Year-over-year growth 2025-2030 (%)
Data Table on Middle East and Africa - Year-over-year growth 2025-2030 (%)
Chart on Regional Comparison - Middle East and Africa
Data Table on Regional Comparison - Middle East and Africa

12.7.1 Saudi Arabia - Market size and forecast 2025-2030

Chart on Saudi Arabia - Market size and forecast 2025-2030 ($ million)
Data Table on Saudi Arabia - Market size and forecast 2025-2030 ($ million)
Chart on Saudi Arabia - Year-over-year growth 2025-2030 (%)
Data Table on Saudi Arabia - Year-over-year growth 2025-2030 (%)

12.7.2 UAE - Market size and forecast 2025-2030

Chart on UAE - Market size and forecast 2025-2030 ($ million)
Data Table on UAE - Market size and forecast 2025-2030 ($ million)
Chart on UAE - Year-over-year growth 2025-2030 (%)
Data Table on UAE - Year-over-year growth 2025-2030 (%)

12.7.3 South Africa - Market size and forecast 2025-2030

Chart on South Africa - Market size and forecast 2025-2030 ($ million)
Data Table on South Africa - Market size and forecast 2025-2030 ($ million)
Chart on South Africa - Year-over-year growth 2025-2030 (%)
Data Table on South Africa - Year-over-year growth 2025-2030 (%)

12.7.4 Israel - Market size and forecast 2025-2030

Chart on Israel - Market size and forecast 2025-2030 ($ million)
Data Table on Israel - Market size and forecast 2025-2030 ($ million)
Chart on Israel - Year-over-year growth 2025-2030 (%)
Data Table on Israel - Year-over-year growth 2025-2030 (%)

12.7.5 Turkey - Market size and forecast 2025-2030

Chart on Turkey - Market size and forecast 2025-2030 ($ million)
Data Table on Turkey - Market size and forecast 2025-2030 ($ million)
Chart on Turkey - Year-over-year growth 2025-2030 (%)
Data Table on Turkey - Year-over-year growth 2025-2030 (%)

12.8 Market opportunity by geography

Market opportunity by geography ($ million)
Data Tables on Market opportunity by geography ($ million)

13. Drivers, Challenges, and Opportunity

13.1 Market drivers

Expanding national smart education policies prioritizing virtual simulation
Increasing VR clinical simulation in nursing and health sciences curricula
Growing US state legislative funding for VR mathematics instruction

13.2 Market challenges

Memory chip shortage raising classroom headset procurement costs
Low teacher preparedness for delivering headset-based classroom instruction
Age restrictions and child safety concerns limiting younger student access

13.3 Impact of drivers and challenges

Impact of drivers and challenges in 2025 and 2030

13.4 Market opportunities

Advancing generative AI-powered adaptive scenarios within VR lessons
Spreading VR career exploration through community youth organizations
Evolving monthly subscription models for classroom VR kits

14. Competitive Landscape

14.1 Overview

14.2

Overview on criticality of inputs and factors of differentiation

14.3 Landscape disruption

Overview on factors of disruption

14.4 Industry risks

Impact of key risks on business

15. Competitive Analysis

15.1 Companies profiled

Companies covered

15.2 Company ranking index

15.3 Market positioning of companies

Matrix on companies position and classification

15.4 Avantis Education

Avantis Education - Overview
Avantis Education - Product / Service
Avantis Education - Key offerings
SWOT

15.5 Bodyswaps

Bodyswaps - Overview
Bodyswaps - Product / Service
Bodyswaps - Key offerings
SWOT

15.6 Eon Reality Inc.

Eon Reality Inc. - Overview
Eon Reality Inc. - Product / Service
Eon Reality Inc. - Key offerings
SWOT

15.7 Flaim Systems Pty Ltd.

Flaim Systems Pty Ltd. - Overview
Flaim Systems Pty Ltd. - Product / Service
Flaim Systems Pty Ltd. - Key offerings
SWOT

15.8 Floreo

Floreo - Overview
Floreo - Product / Service
Floreo - Key offerings
SWOT

15.9 Immerse

Immerse - Overview
Immerse - Product / Service
Immerse - Key offerings
SWOT

15.10 Interplay Learning

Interplay Learning - Overview
Interplay Learning - Product / Service
Interplay Learning - Key offerings
SWOT

15.11 Kai XR

Kai XR - Overview
Kai XR - Product / Service
Kai XR - Key offerings
SWOT

15.12 Osso VR Inc.

Osso VR Inc. - Overview
Osso VR Inc. - Product / Service
Osso VR Inc. - Key offerings
SWOT

15.13 Oxford Medical Simulation Ltd.

Oxford Medical Simulation Ltd. - Overview
Oxford Medical Simulation Ltd. - Product / Service
Oxford Medical Simulation Ltd. - Key offerings
SWOT

15.14 PrecisionOS Technology

PrecisionOS Technology - Overview
PrecisionOS Technology - Product / Service
PrecisionOS Technology - Key offerings
SWOT

15.15 SimX Inc

SimX Inc - Overview
SimX Inc - Product / Service
SimX Inc - Key offerings
SWOT

15.16 VictoryXR Inc.

VictoryXR Inc. - Overview
VictoryXR Inc. - Product / Service
VictoryXR Inc. - Key offerings
SWOT

15.17 VirtualSpeech Ltd.

VirtualSpeech Ltd. - Overview
VirtualSpeech Ltd. - Product / Service
VirtualSpeech Ltd. - Key offerings
SWOT

15.18 zSpace Inc.

zSpace Inc. - Overview
zSpace Inc. - Product / Service
zSpace Inc. - Key offerings
SWOT

16. Appendix

16.1 Scope of the report

Market definition
Objectives
Notes and caveats

16.2 Inclusions and exclusions checklist

Inclusions checklist
Exclusions checklist

16.3 Currency conversion rates for US$

16.4 Research methodology

16.5 Data procurement

Information sources

16.6 Data validation

16.7 Validation techniques employed for market sizing

16.8 Data synthesis

16.9 360 degree market analysis

16.10 List of abbreviations

Research Methodology

Technavio presents a detailed picture of the market by way of study, synthesis, and summation of data from multiple sources. The analysts have presented the various facets of the market with a particular focus on identifying the key industry influencers. The data thus presented is comprehensive, reliable, and the result of extensive research, both primary and secondary.

INFORMATION SOURCES

Primary sources

  • Manufacturers and suppliers
  • Channel partners
  • Industry experts
  • Strategic decision makers

Secondary sources

  • Industry journals and periodicals
  • Government data
  • Financial reports of key industry players
  • Historical data
  • Press releases

DATA ANALYSIS

Data Synthesis

  • Collation of data
  • Estimation of key figures
  • Analysis of derived insights

Data Validation

  • Triangulation with data models
  • Reference against proprietary databases
  • Corroboration with industry experts

REPORT WRITING

Qualitative

  • Market drivers
  • Market challenges
  • Market trends
  • Five forces analysis

Quantitative

  • Market size and forecast
  • Market segmentation
  • Geographical insights
  • Competitive landscape

Interested in this report?

Get your sample now to see our research methodology and insights!

Download Now

Frequently Asked Questions

Virtual Reality In Education Sector market growth will increase by USD 18024.6 million during 2026-2030.

The Virtual Reality In Education Sector market is expected to grow at a CAGR of 36.4% during 2026-2030.

Virtual Reality In Education Sector market is segmented by Product (VR hardware, VR content) End-user (Higher education, K-12) Technology (Fully immersive, Semi-immersive, Non-immersive)

Avantis Education, Bodyswaps, Eon Reality Inc., Flaim Systems Pty Ltd., Floreo, FundamentalVR, Futuclass, Immerse, Interplay Learning, Kai XR, Labster Group ApS, Lifeliqe, Mursion Inc., Osso VR Inc., Oxford Medical Simulation Ltd., PrecisionOS Technology, SimX Inc, VictoryXR Inc., VirtualSpeech Ltd., zSpace Inc. are a few of the key vendors in the Virtual Reality In Education Sector market.

North America will register the highest growth rate of 38.1% among the other regions. Therefore, the Virtual Reality In Education Sector market in North America is expected to garner significant business opportunities for the vendors during the forecast period.

US, Canada, Mexico, Germany, UK, France, Italy, Spain, The Netherlands, China, Japan, India, South Korea, Australia, Indonesia, Brazil, Argentina, Chile, Saudi Arabia, UAE, South Africa, Israel, Turkey

  • Expanding national smart education policies prioritizing virtual simulation is the driving factor this market.

The Virtual Reality In Education Sector market vendors should focus on grabbing business opportunities from the Product segment as it accounted for the largest market share in the base year.
RIA - Research AI Assistant
Ask RIA