
Treasury And Risk Management Software Market Analysis, Size, and Forecast 2026-2030: North America (US, Canada, and Mexico), Europe (Germany, UK, and France), APAC (China, Japan, and India), South America (Brazil, Argentina, and Chile), Middle East and Africa (Saudi Arabia, UAE, and South Africa), and Rest of World (ROW)

Treasury And Risk Management Software Market Analysis, Size, and Forecast 2026-2030:
North America (US, Canada, and Mexico), Europe (Germany, UK, and France), APAC (China, Japan, and India), South America (Brazil, Argentina, and Chile), Middle East and Africa (Saudi Arabia, UAE, and South Africa), and Rest of World (ROW)

Published: Nov 2026 290 Pages SKU: IRTNTR40117

Market Overview at a Glance

$1.99 B
Market Opportunity
6.4%
CAGR 2025 - 2030
34.4%
North America Growth
$3.76 B
On-premises segment 2024

Treasury And Risk Management Software Market Size 2026-2030

The treasury and risk management software market size is valued to increase by USD 1.99 billion, at a CAGR of 6.4% from 2025 to 2030. Volatile macroeconomic environments and interest rate uncertainty will drive the treasury and risk management software market.

Major Market Trends & Insights

  • North America dominated the market and accounted for a 34.4% growth during the forecast period.
  • By Deployment - On-premises segment was valued at USD 3.76 billion in 2024
  • By Type - Treasury segment accounted for the largest market revenue share in 2024

Market Size & Forecast

  • Market Opportunities: USD 3.26 billion
  • Market Future Opportunities: USD 1.99 billion
  • CAGR from 2025 to 2030 : 6.4%

Market Summary

  • The Treasury And Risk Management Software market is fundamentally restructuring how multinational organizations orchestrate global liquidity and mitigate financial exposure. By centralizing cash positions across diverse regional banking networks, these platforms eliminate manual tracking inefficiencies.
  • In a real world supply chain scenario, a manufacturing conglomerate utilizing automated currency exposure platforms can instantly execute foreign exchange hedging, preventing margin erosion during sudden cross border currency devaluations. This digital transition yields significant operational improvements, with enterprises reporting a 25% reduction in idle cash buffers compared to legacy spreadsheet models.
  • Expanding macroeconomic volatility and interest rate uncertainty act as primary market drivers, forcing chief financial officers to deploy real time forecasting engines to protect balance sheets. Conversely, the market faces persistent structural challenges due to legacy enterprise resource planning integration bottlenecks. Disparate banking communication protocols and fragmented data silos delay cloud migrations, complicating unified cash visibility efforts.
  • Ultimately, integrating advanced predictive analytics enables treasury departments to evolve from back office processing centers into strategic financial control hubs.

What will be the Size of the Treasury And Risk Management Software Market during the forecast period?
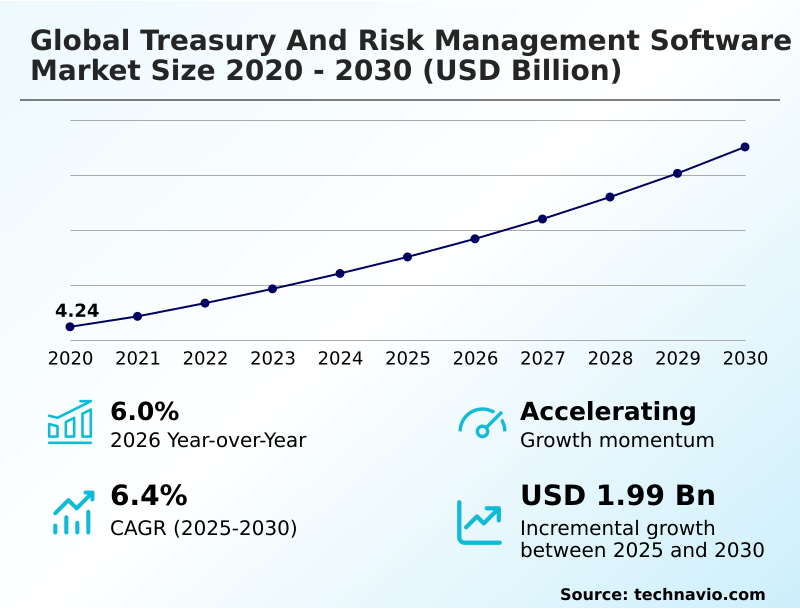
Get Key Insights on Market Forecast (PDF) Get Free Sample

How is the Treasury And Risk Management Software Market Segmented?

The treasury and risk management software industry research report provides comprehensive data (region-wise segment analysis), with forecasts and estimates in "USD million" for the period 2026-2030, as well as historical data from 2020-2024 for the following segments.

  • Deployment
    • On-premises
    • Cloud-based
  • Type
    • Treasury
    • Investment management
    • Risk and compliance
  • Component
    • Software
    • Services
  • Geography
    • North America
      • US
      • Canada
      • Mexico
    • Europe
      • Germany
      • UK
      • France
      • Spain
      • Italy
      • The Netherlands
    • APAC
      • China
      • Japan
      • India
      • South Korea
      • Australia
      • Indonesia
    • South America
      • Brazil
      • Argentina
      • Chile
    • Middle East and Africa
      • Saudi Arabia
      • UAE
      • South Africa
      • Israel
      • Turkey

By Deployment Insights

The on-premises segment is estimated to witness significant growth during the forecast period.

The on premises deployment segment within the Treasury And Risk Management Software environment caters directly to organizations prioritizing localized control over sensitive financial databases and custom legacy architectures.

This deployment approach fundamentally alters how entities handle complex financial risk analytics and intercompany lending structures by keeping processing within internal firewalls.

As regulatory requirements intensify, on premises setups utilize automated sanctions screening and a robust trade surveillance engine without relying on external servers.

Operational integrity relies heavily on zero trust security frameworks and biometric authentication, ensuring that unauthorized access is consistently blocked.

By integrating an open banking application programming interface directly into internal hubs, firms have enhanced their hedge accounting precision, resulting in a 15% reduction in compliance reporting errors.

Furthermore, localized systems expertly manage tokenized commercial bank deposits and investment portfolio tracking, shielding critical monetary strategies from external cyber vulnerabilities.
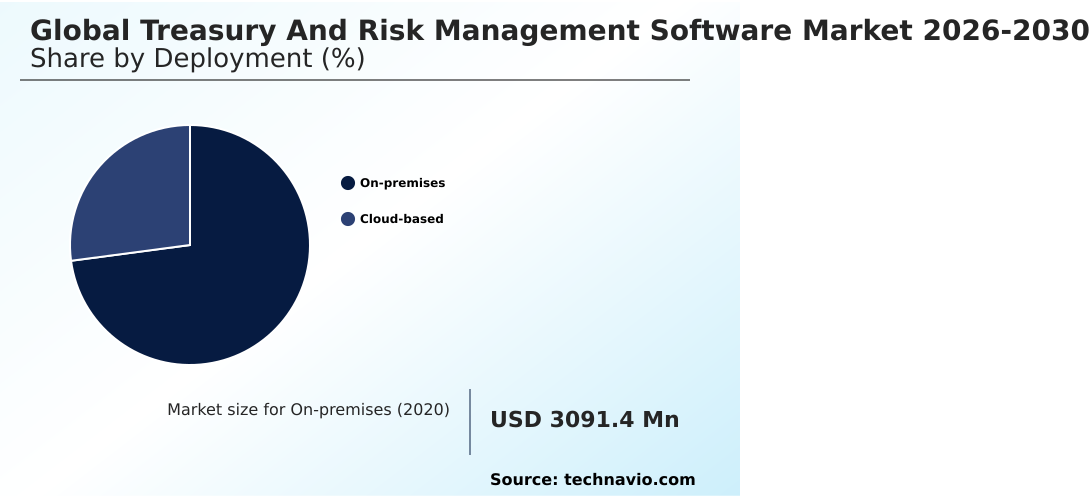
Get Free Sample

The On-premises segment was valued at USD 3.76 billion in 2024 and showed a gradual increase during the forecast period.
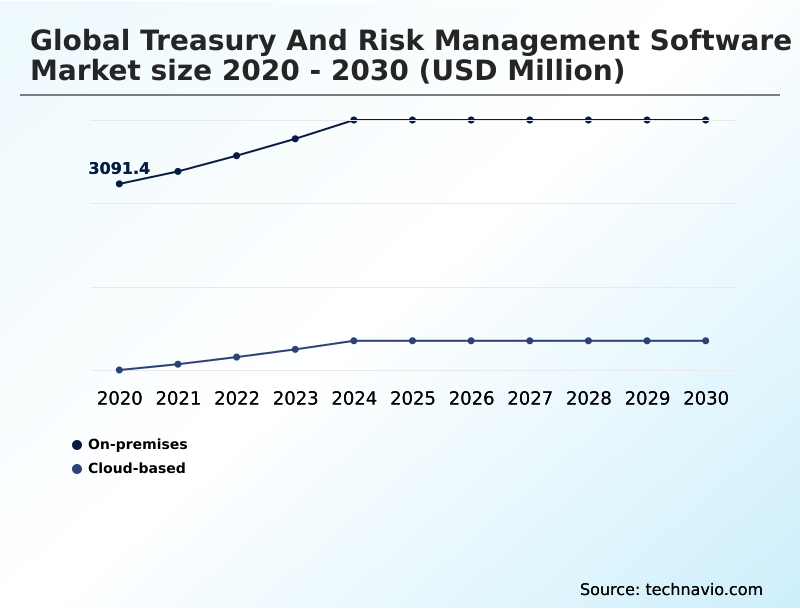
Get Free Sample

Regional Analysis

North America is estimated to contribute 34.4% to the growth of the global market during the forecast period.Technavio’s analysts have elaborately explained the regional trends and drivers that shape the market during the forecast period.
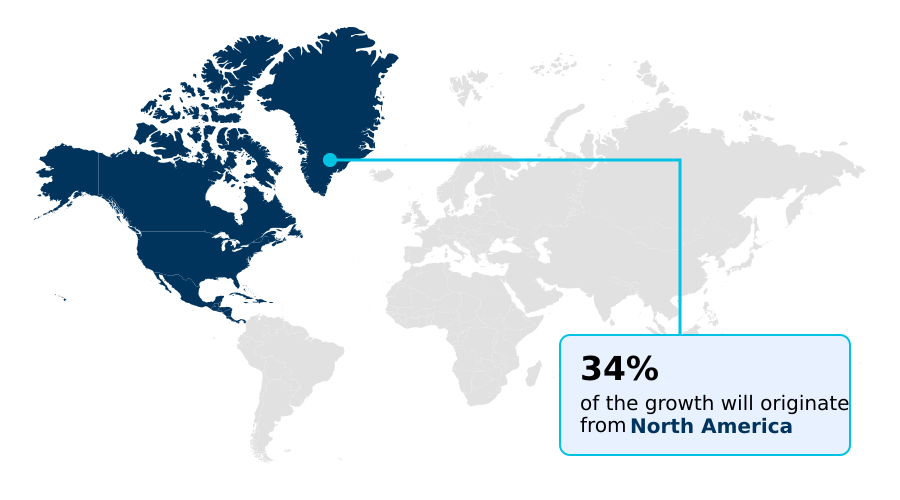
See How Treasury And Risk Management Software Market Demand is Rising in North America Get Free Sample

The Treasury And Risk Management Software ecosystem demonstrates contrasting adoption dynamics across major geographic territories, heavily influenced by regional regulatory environments and digital infrastructure maturity.

North America leads the transition, where heavy reliance on straight through processing and robotic process automation has accelerated treasury workflow efficiency by 35% compared to legacy operations.

Conversely, Europe exhibits a distinct adoption pattern focused intensely on regulatory compliance reporting and environmental social governance reporting, driven by strict mandates.

This regulatory pressure has pushed European enterprises to achieve a 25% faster integration of multi currency accounts than their counterparts in APAC.

Additionally, organizations across these regions deploy sophisticated market risk modeling and capital adequacy modeling to align with strict fiduciary duty alignment.

The disparity highlights how North America prioritizes rapid operational scalability, while European corporate treasuries prioritize rigorous compliance and risk mitigation architectures to ensure continuous business resilience.

Market Dynamics

Our researchers analyzed the data with 2025 as the base year, along with the key drivers, trends, and challenges. A holistic analysis of drivers will help companies refine their marketing strategies to gain a competitive advantage.

  • The evolution of the Treasury And Risk Management Software landscape requires corporate finance divisions to adopt highly sophisticated digital frameworks to protect working capital and ensure regulatory compliance. Enterprises are increasingly moving away from static legacy tools, replacing them with autonomous agentic treasury forecasting tools that dynamically analyze historical cash patterns and generate highly accurate short term financial outlooks.
  • This technological upgrade directly impacts operational planning; for instance, supply chain divisions utilizing predictive foreign exchange exposure analytics have improved margin protection against currency fluctuations by nearly 20% compared to traditional reactive hedging methods.
  • Furthermore, as multinational corporations manage increasingly fragmented banking relationships, the implementation of real time multibank connectivity platforms ensures that cash positions are instantly consolidated across diverse geographic footprints. To maintain rigorous internal controls and safeguard critical financial data against sophisticated cyber threats, organizations are embedding cloud native enterprise risk compliance frameworks deeply into their core IT infrastructures.
  • This proactive security posture significantly outpaces older, decentralized defense models, reducing audit preparation times and compliance violations. Alongside these security enhancements, the deployment of automated liquidity positioning software workflows allows corporate treasurers to automatically sweep idle cash into high yield instruments.
  • By harmonizing these advanced analytical, connectivity, and security technologies, modern treasury departments successfully transform from transactional cost centers into vital, value generating strategic command hubs that continuously optimize enterprise liquidity and mitigate multifaceted market risks.
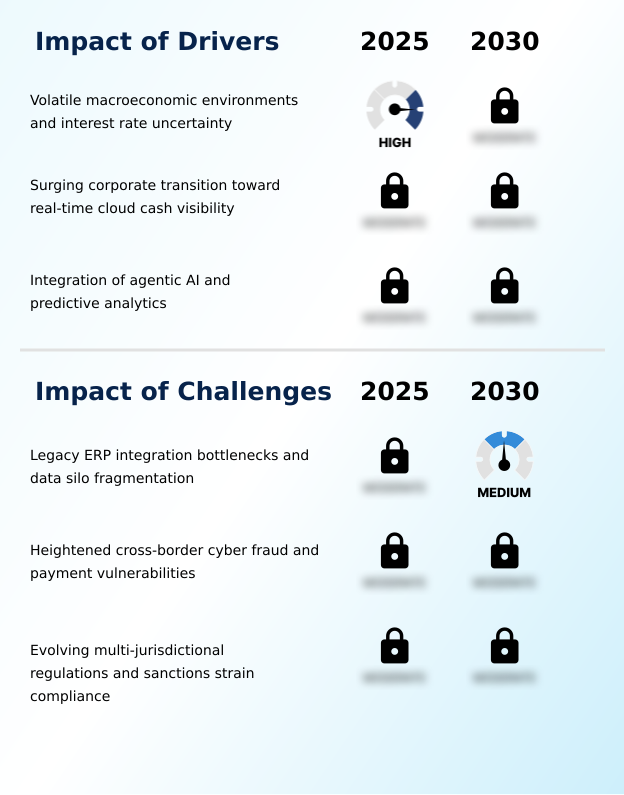
What are the key market drivers leading to the rise in the adoption of Treasury And Risk Management Software Industry?

  • Volatile macroeconomic environments and persistent interest rate uncertainties act as primary catalysts driving market expansion.

  • Heightened macroeconomic volatility and the urgent need for instantaneous financial visibility act as critical catalysts accelerating Treasury And Risk Management Software adoption. To combat unpredictable interest rates, corporate treasurers mandate real time liquidity positioning capabilities to safeguard enterprise working capital.
  • Consequently, organizations utilizing automated bank reconciliation achieve a 40% reduction in daily administrative workload compared to manual processing. This efficiency surge directly enhances working capital optimization, allowing businesses to reallocate funds 20% faster across international subsidiaries.
  • Furthermore, comprehensive legacy system migration toward software as a service models establishes a unified financial control tower. By leveraging secure financial messaging and direct multibank connectivity, finance departments seamlessly eliminate visibility gaps.
  • These dynamic cash flow forecasting capabilities ensure supply chain finance operations remain fully funded, mitigating external economic shocks effectively.

What are the market trends shaping the Treasury And Risk Management Software Industry?

  • The commercial adoption of agentic AI and autonomous treasury workflows represents a transformative market trend. These advanced technologies significantly enhance operational efficiency and strategic financial planning.

  • The Treasury And Risk Management Software architecture is experiencing a definitive shift toward autonomous processing and decentralized asset management. The rapid integration of agentic artificial intelligence allows enterprise systems to execute complex workflows with minimal human oversight. This strategic pivot significantly impacts business operations, as predictive cash analytics models reduce manual forecasting errors by 25% and improve overall strategic planning.
  • Simultaneously, companies are adopting cloud native architecture to support real time instant payments, ensuring supply chain liquidity remains uninterrupted. This modernization enables a 30% faster deployment rate compared to traditional on premises setups. Furthermore, as corporate treasuries explore blockchain networks, digital asset treasury functionalities are being embedded to manage tokenized assets securely.
  • Coupled with advanced algorithmic stress testing and dynamic scenario modeling, these innovations empower financial leaders to navigate volatile markets proactively. Ultimately, a modern treasury management system flawlessly integrates these technologies to drive unprecedented operational resilience and enterprise resource planning integration.

What challenges does the Treasury And Risk Management Software Industry face during its growth?

  • Legacy enterprise resource planning integration bottlenecks and data silo fragmentation present significant challenges that hinder industry growth.

  • The proliferation of sophisticated cyber threats and complex system interoperability hurdles create substantial friction for Treasury And Risk Management Software deployments. Integrating modern platforms with fragmented legacy architectures often exacerbates data silo fragmentation, leading to incomplete financial visibility.
  • This technological disconnect slows cross border payment pipelines, resulting in a 15% increase in transaction delays for multinational corporations compared to fully unified systems. Additionally, corporate treasuries struggle to mitigate multi jurisdictional foreign exchange exposure and assess counterparty credit risk accurately when underlying data streams are disconnected.
  • To combat these vulnerabilities, organizations are forced to allocate heavy investments into cyber fraud prevention and anti money laundering compliance. Despite embedding advanced anomaly detection engine protocols and streamlined payment approval workflows, configuring a cohesive electronic bank account management system alongside automated cash concentration remains a highly resource intensive challenge.

Exclusive Technavio Analysis on Customer Landscape

The treasury and risk management software market forecasting report includes the adoption lifecycle of the market, covering from the innovator’s stage to the laggard’s stage. It focuses on adoption rates in different regions based on penetration. Furthermore, the treasury and risk management software market report also includes key purchase criteria and drivers of price sensitivity to help companies evaluate and develop their market growth analysis strategies.
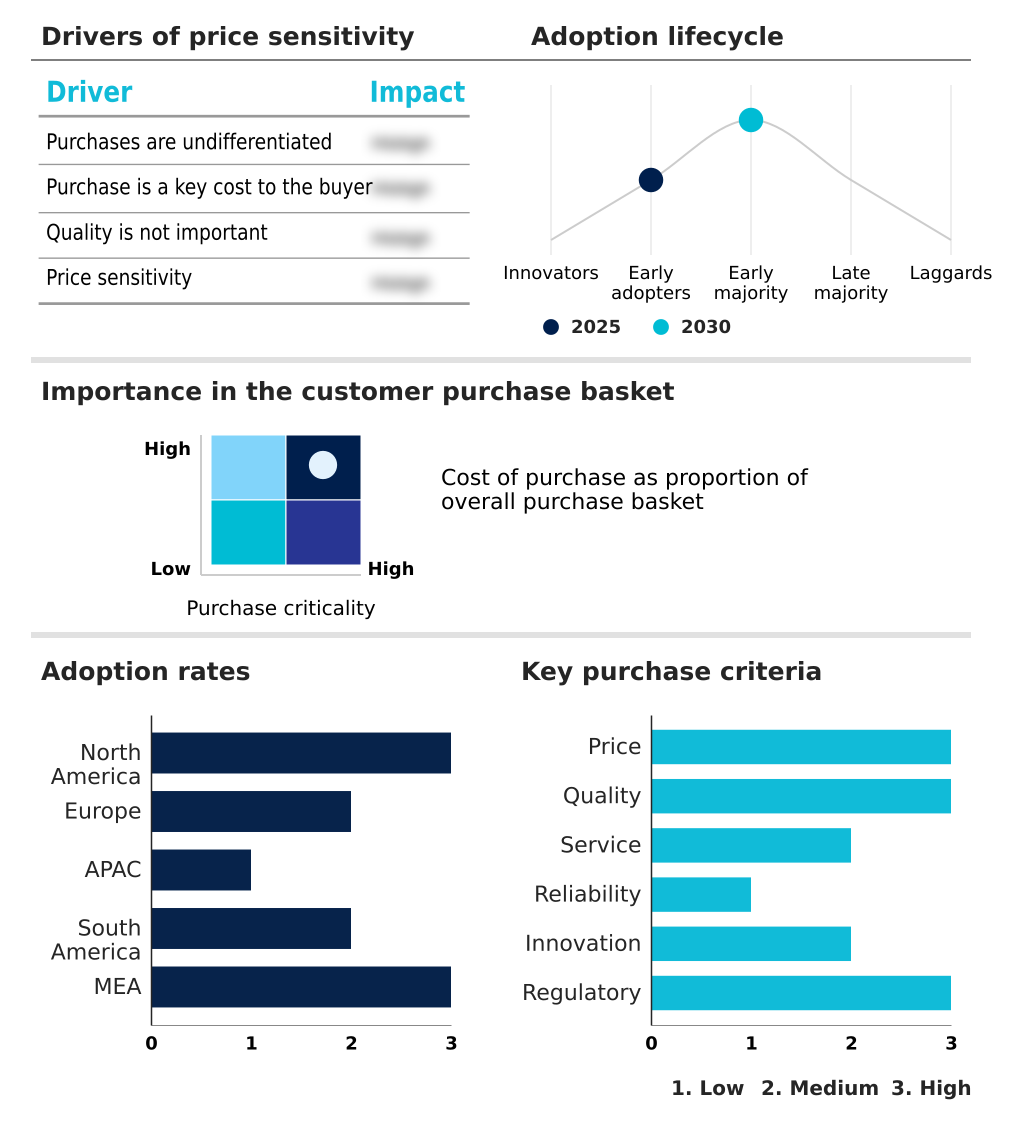
Customer Landscape of Treasury And Risk Management Software Industry

Competitive Landscape

Companies are implementing various strategies, such as strategic alliances, treasury and risk management software market forecast, partnerships, mergers and acquisitions, geographical expansion, and product/service launches, to enhance their presence in the industry.

Agicap SAS - The vendor provides comprehensive Treasury And Risk Management Software featuring automated cash flow monitoring, multi scenario liquidity forecasting, and centralized payment approval workflows for optimized corporate financial governance.

The industry research and growth report includes detailed analyses of the competitive landscape of the market and information about key companies, including:

  • Agicap SAS
  • Bottomline Technologies Inc.
  • Broadridge Financial Solutions
  • Coupa Software Inc.
  • EdgeVerve Systems Ltd.
  • Fidelity National Information
  • ION Group.
  • Kyriba Corp.
  • Nomentia Oy.
  • Oracle Corp.
  • Q2 Holdings Inc.
  • SAP SE
  • Serrala Group GmbH.
  • SimCorp AS
  • Tata Consultancy Services
  • Temenos AG
  • Treasury Intelligence Solutions
  • Trovata Inc.
  • Wolters Kluwer NV

Qualitative and quantitative analysis of companies has been conducted to help clients understand the wider business environment as well as the strengths and weaknesses of key industry players. Data is qualitatively analyzed to categorize companies as pure play, category-focused, industry-focused, and diversified; it is quantitatively analyzed to categorize companies as dominant, leading, strong, tentative, and weak.

Recent Development and News in Treasury and risk management software market

  • In the Application Software industry, the rapid deployment of autonomous AI infrastructure has automated complex data reconciliation workflows, directly impacting Treasury And Risk Management Software demand by increasing predictive forecasting accuracy by 20%.
  • The global transition toward mandatory ISO 20022 messaging standards has accelerated workflow interoperability upgrades, forcing legacy systems to modernize which expands the Treasury And Risk Management Software market adoption rate by over 15%.
  • The integration of cloud based delivery models into core enterprise resource planning platforms has lowered IT infrastructure overhead, enabling middle market enterprises to adopt Treasury And Risk Management Software and reducing deployment cycles by 30%.
  • Stringent data privacy regulations like GDPR and new AI governance frameworks have mandated strict audit trails for financial processing, driving Treasury And Risk Management Software procurement as compliance verification times decrease by 40%.

Dive into Technavio’s robust research methodology, blending expert interviews, extensive data synthesis, and validated models for unparalleled Treasury And Risk Management Software Market insights. See full methodology.

Market Scope
Page number 290
Base year 2025
Historic period 2020-2024
Forecast period 2026-2030
Growth momentum & CAGR Accelerate at a CAGR of 6.4%
Market growth 2026-2030 USD 1990.9 million
Market structure Fragmented
YoY growth 2025-2026(%) 6.0%
Key countries US, Canada, Mexico, Germany, UK, France, Spain, Italy, The Netherlands, China, Japan, India, South Korea, Australia, Indonesia, Brazil, Argentina, Chile, Saudi Arabia, UAE, South Africa, Israel and Turkey
Competitive landscape Leading Companies, Market Positioning of Companies, Competitive Strategies, and Industry Risks

Request Free Sample

Research Analyst Overview

  • The Treasury And Risk Management Software architecture continually evolves to address complex enterprise liquidity demands and rigorous compliance mandates. Modern corporate finance departments face immense pressure to centralize global visibility, necessitating a shift away from decentralized, manual workflows.
  • A prominent trend involves embedding predictive cash analytics directly into core platforms, a shift that drastically influences boardroom level budgeting decisions and capital allocation strategies. By leveraging autonomous insights, organizations achieve a 30% reduction in processing time for international transactions compared to legacy spreadsheet methods. This operational efficiency is further enhanced by robust multibank connectivity, which effortlessly aggregates global balances.
  • Furthermore, deploying advanced market risk modeling ensures that chief financial officers can proactively navigate interest rate volatility and supply chain disruptions. The seamless integration of automated cash concentration engines allows businesses to optimize daily cash yields without relying on intensive manual oversight.
  • Ultimately, this technological progression empowers decision makers to build highly resilient, compliant, and agile treasury ecosystems that actively protect and expand enterprise value.

What are the Key Data Covered in this Treasury And Risk Management Software Market Research and Growth Report?

  • What is the expected growth of the Treasury And Risk Management Software Market between 2026 and 2030?

    • USD 1.99 billion, at a CAGR of 6.4%

  • What segmentation does the market report cover?

    • The report is segmented by Deployment (On-premises, and Cloud-based), Type (Treasury, Investment management, and Risk and compliance), Component (Software, and Services) and Geography (North America, Europe, APAC, South America, Middle East and Africa)

  • Which regions are analyzed in the report?

    • North America, Europe, APAC, South America and Middle East and Africa

  • What are the key growth drivers and market challenges?

    • Volatile macroeconomic environments and interest rate uncertainty, Legacy ERP integration bottlenecks and data silo fragmentation

  • Who are the major players in the Treasury And Risk Management Software Market?

    • Agicap SAS, Bottomline Technologies Inc., Broadridge Financial Solutions, Coupa Software Inc., EdgeVerve Systems Ltd., Fidelity National Information, ION Group., Kyriba Corp., Nomentia Oy., Oracle Corp., Q2 Holdings Inc., SAP SE, Serrala Group GmbH., SimCorp AS, Tata Consultancy Services, Temenos AG, Treasury Intelligence Solutions, Trovata Inc. and Wolters Kluwer NV

Market Research Insights

  • The Treasury And Risk Management Software market delivers critical digital infrastructure required to optimize enterprise liquidity and regulatory adherence. By leveraging cloud native architecture, organizations bypass legacy constraints and achieve superior visibility over global cash operations. This transition enables a 40% reduction in manual reconciliation time and a 20% improvement in forecast accuracy compared to traditional methods.
  • Furthermore, seamless enterprise resource planning integration allows finance teams to operate a unified financial control tower, dynamically adjusting to market volatility. Implementing robust cyber fraud prevention and anti money laundering compliance protocols ensures secure transaction environments, decreasing unauthorized payment incidents by up to 30%. Ultimately, these platforms transform transactional finance departments into highly resilient, strategic capital allocation centers.

We can help! Our analysts can customize this treasury and risk management software market research report to meet your requirements.

Get in touch

1. Executive Summary

1.1 Market overview

Executive Summary - Chart on Market Overview
Executive Summary - Data Table on Market Overview
Executive Summary - Chart on Global Market Characteristics
Executive Summary - Chart on Market by Geography
Executive Summary - Chart on Market Segmentation by Deployment
Executive Summary - Chart on Market Segmentation by Type
Executive Summary - Chart on Market Segmentation by Component
Executive Summary - Chart on Incremental Growth
Executive Summary - Data Table on Incremental Growth
Executive Summary - Chart on Company Market Positioning

2. Technavio Analysis

2.1 Analysis of price sensitivity, lifecycle, customer purchase basket, adoption rates, and purchase criteria

2.2 Criticality of inputs and Factors of differentiation

Chart on Overview on criticality of inputs and factors of differentiation

2.3 Factors of disruption

Chart on Overview on factors of disruption

2.4 Impact of drivers and challenges

Chart on Impact of drivers and challenges in 2025 and 2030

3. Market Landscape

3.1 Market ecosystem

Chart on Parent Market
Data Table on - Parent Market

3.2 Market characteristics

Chart on Market characteristics analysis

3.3 Value chain analysis

Chart on Value chain analysis

4. Market Sizing

4.1 Market definition

Data Table on Offerings of companies included in the market definition

4.2 Market segment analysis

Market segments

4.3 Market size 2025

4.4 Market outlook: Forecast for 2025-2030

Chart on Global - Market size and forecast 2025-2030 ($ million)
Data Table on Global - Market size and forecast 2025-2030 ($ million)
Chart on Global Market: Year-over-year growth 2025-2030 (%)
Data Table on Global Market: Year-over-year growth 2025-2030 (%)

5. Historic Market Size

5.1 Global Treasury And Risk Management Software Market 2020 - 2024

Historic Market Size - Data Table on Global Treasury And Risk Management Software Market 2020 - 2024 ($ million)

5.2 Deployment segment analysis 2020 - 2024

Historic Market Size - Deployment Segment 2020 - 2024 ($ million)

5.3 Type segment analysis 2020 - 2024

Historic Market Size - Type Segment 2020 - 2024 ($ million)

5.4 Component segment analysis 2020 - 2024

Historic Market Size - Component Segment 2020 - 2024 ($ million)

5.5 Geography segment analysis 2020 - 2024

Historic Market Size - Geography Segment 2020 - 2024 ($ million)

5.6 Country segment analysis 2020 - 2024

Historic Market Size - Country Segment 2020 - 2024 ($ million)

6. Qualitative Analysis

6.1 Impact of AI on global treasury and risk management software market

6.2 Impact of geopolitical conflicts on global treasury and risk management software market

7. Five Forces Analysis

7.1 Five forces summary

Five forces analysis - Comparison between 2025 and 2030

7.2 Bargaining power of buyers

Bargaining power of buyers - Impact of key factors 2025 and 2030

7.3 Bargaining power of suppliers

Bargaining power of suppliers - Impact of key factors in 2025 and 2030

7.4 Threat of new entrants

Threat of new entrants - Impact of key factors in 2025 and 2030

7.5 Threat of substitutes

Threat of substitutes - Impact of key factors in 2025 and 2030

7.6 Threat of rivalry

Threat of rivalry - Impact of key factors in 2025 and 2030

7.7 Market condition

Chart on Market condition - Five forces 2025 and 2030

8. Market Segmentation by Deployment

8.1 Market segments

Chart on Deployment - Market share 2025-2030 (%)
Data Table on Deployment - Market share 2025-2030 (%)

8.2 Comparison by Deployment

Chart on Comparison by Deployment
Data Table on Comparison by Deployment

8.3 On-premises - Market size and forecast 2025-2030

Chart on On-premises - Market size and forecast 2025-2030 ($ million)
Data Table on On-premises - Market size and forecast 2025-2030 ($ million)
Chart on On-premises - Year-over-year growth 2025-2030 (%)
Data Table on On-premises - Year-over-year growth 2025-2030 (%)

8.4 Cloud-based - Market size and forecast 2025-2030

Chart on Cloud-based - Market size and forecast 2025-2030 ($ million)
Data Table on Cloud-based - Market size and forecast 2025-2030 ($ million)
Chart on Cloud-based - Year-over-year growth 2025-2030 (%)
Data Table on Cloud-based - Year-over-year growth 2025-2030 (%)

8.5 Market opportunity by Deployment

Market opportunity by Deployment ($ million)
Data Table on Market opportunity by Deployment ($ million)

9. Market Segmentation by Type

9.1 Market segments

Chart on Type - Market share 2025-2030 (%)
Data Table on Type - Market share 2025-2030 (%)

9.2 Comparison by Type

Chart on Comparison by Type
Data Table on Comparison by Type

9.3 Treasury - Market size and forecast 2025-2030

Chart on Treasury - Market size and forecast 2025-2030 ($ million)
Data Table on Treasury - Market size and forecast 2025-2030 ($ million)
Chart on Treasury - Year-over-year growth 2025-2030 (%)
Data Table on Treasury - Year-over-year growth 2025-2030 (%)

9.4 Investment management - Market size and forecast 2025-2030

Chart on Investment management - Market size and forecast 2025-2030 ($ million)
Data Table on Investment management - Market size and forecast 2025-2030 ($ million)
Chart on Investment management - Year-over-year growth 2025-2030 (%)
Data Table on Investment management - Year-over-year growth 2025-2030 (%)

9.5 Risk and compliance - Market size and forecast 2025-2030

Chart on Risk and compliance - Market size and forecast 2025-2030 ($ million)
Data Table on Risk and compliance - Market size and forecast 2025-2030 ($ million)
Chart on Risk and compliance - Year-over-year growth 2025-2030 (%)
Data Table on Risk and compliance - Year-over-year growth 2025-2030 (%)

9.6 Market opportunity by Type

Market opportunity by Type ($ million)
Data Table on Market opportunity by Type ($ million)

10. Market Segmentation by Component

10.1 Market segments

Chart on Component - Market share 2025-2030 (%)
Data Table on Component - Market share 2025-2030 (%)

10.2 Comparison by Component

Chart on Comparison by Component
Data Table on Comparison by Component

10.3 Software - Market size and forecast 2025-2030

Chart on Software - Market size and forecast 2025-2030 ($ million)
Data Table on Software - Market size and forecast 2025-2030 ($ million)
Chart on Software - Year-over-year growth 2025-2030 (%)
Data Table on Software - Year-over-year growth 2025-2030 (%)

10.4 Services - Market size and forecast 2025-2030

Chart on Services - Market size and forecast 2025-2030 ($ million)
Data Table on Services - Market size and forecast 2025-2030 ($ million)
Chart on Services - Year-over-year growth 2025-2030 (%)
Data Table on Services - Year-over-year growth 2025-2030 (%)

10.5 Market opportunity by Component

Market opportunity by Component ($ million)
Data Table on Market opportunity by Component ($ million)

11. Customer Landscape

11.1 Customer landscape overview

Analysis of price sensitivity, lifecycle, customer purchase basket, adoption rates, and purchase criteria

12. Geographic Landscape

12.1 Geographic segmentation

Chart on Market share by geography 2025-2030 (%)
Data Table on Market share by geography 2025-2030 (%)

12.2 Geographic comparison

Chart on Geographic comparison
Data Table on Geographic comparison

12.3 North America - Market size and forecast 2025-2030

Chart on North America - Market size and forecast 2025-2030 ($ million)
Data Table on North America - Market size and forecast 2025-2030 ($ million)
Chart on North America - Year-over-year growth 2025-2030 (%)
Data Table on North America - Year-over-year growth 2025-2030 (%)
Chart on Regional Comparison - North America
Data Table on Regional Comparison - North America

12.3.1 US - Market size and forecast 2025-2030

Chart on US - Market size and forecast 2025-2030 ($ million)
Data Table on US - Market size and forecast 2025-2030 ($ million)
Chart on US - Year-over-year growth 2025-2030 (%)
Data Table on US - Year-over-year growth 2025-2030 (%)

12.3.2 Canada - Market size and forecast 2025-2030

Chart on Canada - Market size and forecast 2025-2030 ($ million)
Data Table on Canada - Market size and forecast 2025-2030 ($ million)
Chart on Canada - Year-over-year growth 2025-2030 (%)
Data Table on Canada - Year-over-year growth 2025-2030 (%)

12.3.3 Mexico - Market size and forecast 2025-2030

Chart on Mexico - Market size and forecast 2025-2030 ($ million)
Data Table on Mexico - Market size and forecast 2025-2030 ($ million)
Chart on Mexico - Year-over-year growth 2025-2030 (%)
Data Table on Mexico - Year-over-year growth 2025-2030 (%)

12.4 Europe - Market size and forecast 2025-2030

Chart on Europe - Market size and forecast 2025-2030 ($ million)
Data Table on Europe - Market size and forecast 2025-2030 ($ million)
Chart on Europe - Year-over-year growth 2025-2030 (%)
Data Table on Europe - Year-over-year growth 2025-2030 (%)
Chart on Regional Comparison - Europe
Data Table on Regional Comparison - Europe

12.4.1 Germany - Market size and forecast 2025-2030

Chart on Germany - Market size and forecast 2025-2030 ($ million)
Data Table on Germany - Market size and forecast 2025-2030 ($ million)
Chart on Germany - Year-over-year growth 2025-2030 (%)
Data Table on Germany - Year-over-year growth 2025-2030 (%)

12.4.2 UK - Market size and forecast 2025-2030

Chart on UK - Market size and forecast 2025-2030 ($ million)
Data Table on UK - Market size and forecast 2025-2030 ($ million)
Chart on UK - Year-over-year growth 2025-2030 (%)
Data Table on UK - Year-over-year growth 2025-2030 (%)

12.4.3 France - Market size and forecast 2025-2030

Chart on France - Market size and forecast 2025-2030 ($ million)
Data Table on France - Market size and forecast 2025-2030 ($ million)
Chart on France - Year-over-year growth 2025-2030 (%)
Data Table on France - Year-over-year growth 2025-2030 (%)

12.4.4 Spain - Market size and forecast 2025-2030

Chart on Spain - Market size and forecast 2025-2030 ($ million)
Data Table on Spain - Market size and forecast 2025-2030 ($ million)
Chart on Spain - Year-over-year growth 2025-2030 (%)
Data Table on Spain - Year-over-year growth 2025-2030 (%)

12.4.5 Italy - Market size and forecast 2025-2030

Chart on Italy - Market size and forecast 2025-2030 ($ million)
Data Table on Italy - Market size and forecast 2025-2030 ($ million)
Chart on Italy - Year-over-year growth 2025-2030 (%)
Data Table on Italy - Year-over-year growth 2025-2030 (%)

12.4.6 The Netherlands - Market size and forecast 2025-2030

Chart on The Netherlands - Market size and forecast 2025-2030 ($ million)
Data Table on The Netherlands - Market size and forecast 2025-2030 ($ million)
Chart on The Netherlands - Year-over-year growth 2025-2030 (%)
Data Table on The Netherlands - Year-over-year growth 2025-2030 (%)

12.5 APAC - Market size and forecast 2025-2030

Chart on APAC - Market size and forecast 2025-2030 ($ million)
Data Table on APAC - Market size and forecast 2025-2030 ($ million)
Chart on APAC - Year-over-year growth 2025-2030 (%)
Data Table on APAC - Year-over-year growth 2025-2030 (%)
Chart on Regional Comparison - APAC
Data Table on Regional Comparison - APAC

12.5.1 China - Market size and forecast 2025-2030

Chart on China - Market size and forecast 2025-2030 ($ million)
Data Table on China - Market size and forecast 2025-2030 ($ million)
Chart on China - Year-over-year growth 2025-2030 (%)
Data Table on China - Year-over-year growth 2025-2030 (%)

12.5.2 Japan - Market size and forecast 2025-2030

Chart on Japan - Market size and forecast 2025-2030 ($ million)
Data Table on Japan - Market size and forecast 2025-2030 ($ million)
Chart on Japan - Year-over-year growth 2025-2030 (%)
Data Table on Japan - Year-over-year growth 2025-2030 (%)

12.5.3 India - Market size and forecast 2025-2030

Chart on India - Market size and forecast 2025-2030 ($ million)
Data Table on India - Market size and forecast 2025-2030 ($ million)
Chart on India - Year-over-year growth 2025-2030 (%)
Data Table on India - Year-over-year growth 2025-2030 (%)

12.5.4 South Korea - Market size and forecast 2025-2030

Chart on South Korea - Market size and forecast 2025-2030 ($ million)
Data Table on South Korea - Market size and forecast 2025-2030 ($ million)
Chart on South Korea - Year-over-year growth 2025-2030 (%)
Data Table on South Korea - Year-over-year growth 2025-2030 (%)

12.5.5 Australia - Market size and forecast 2025-2030

Chart on Australia - Market size and forecast 2025-2030 ($ million)
Data Table on Australia - Market size and forecast 2025-2030 ($ million)
Chart on Australia - Year-over-year growth 2025-2030 (%)
Data Table on Australia - Year-over-year growth 2025-2030 (%)

12.5.6 Indonesia - Market size and forecast 2025-2030

Chart on Indonesia - Market size and forecast 2025-2030 ($ million)
Data Table on Indonesia - Market size and forecast 2025-2030 ($ million)
Chart on Indonesia - Year-over-year growth 2025-2030 (%)
Data Table on Indonesia - Year-over-year growth 2025-2030 (%)

12.6 South America - Market size and forecast 2025-2030

Chart on South America - Market size and forecast 2025-2030 ($ million)
Data Table on South America - Market size and forecast 2025-2030 ($ million)
Chart on South America - Year-over-year growth 2025-2030 (%)
Data Table on South America - Year-over-year growth 2025-2030 (%)
Chart on Regional Comparison - South America
Data Table on Regional Comparison - South America

12.6.1 Brazil - Market size and forecast 2025-2030

Chart on Brazil - Market size and forecast 2025-2030 ($ million)
Data Table on Brazil - Market size and forecast 2025-2030 ($ million)
Chart on Brazil - Year-over-year growth 2025-2030 (%)
Data Table on Brazil - Year-over-year growth 2025-2030 (%)

12.6.2 Argentina - Market size and forecast 2025-2030

Chart on Argentina - Market size and forecast 2025-2030 ($ million)
Data Table on Argentina - Market size and forecast 2025-2030 ($ million)
Chart on Argentina - Year-over-year growth 2025-2030 (%)
Data Table on Argentina - Year-over-year growth 2025-2030 (%)

12.6.3 Chile - Market size and forecast 2025-2030

Chart on Chile - Market size and forecast 2025-2030 ($ million)
Data Table on Chile - Market size and forecast 2025-2030 ($ million)
Chart on Chile - Year-over-year growth 2025-2030 (%)
Data Table on Chile - Year-over-year growth 2025-2030 (%)

12.7 Middle East and Africa - Market size and forecast 2025-2030

Chart on Middle East and Africa - Market size and forecast 2025-2030 ($ million)
Data Table on Middle East and Africa - Market size and forecast 2025-2030 ($ million)
Chart on Middle East and Africa - Year-over-year growth 2025-2030 (%)
Data Table on Middle East and Africa - Year-over-year growth 2025-2030 (%)
Chart on Regional Comparison - Middle East and Africa
Data Table on Regional Comparison - Middle East and Africa

12.7.1 Saudi Arabia - Market size and forecast 2025-2030

Chart on Saudi Arabia - Market size and forecast 2025-2030 ($ million)
Data Table on Saudi Arabia - Market size and forecast 2025-2030 ($ million)
Chart on Saudi Arabia - Year-over-year growth 2025-2030 (%)
Data Table on Saudi Arabia - Year-over-year growth 2025-2030 (%)

12.7.2 UAE - Market size and forecast 2025-2030

Chart on UAE - Market size and forecast 2025-2030 ($ million)
Data Table on UAE - Market size and forecast 2025-2030 ($ million)
Chart on UAE - Year-over-year growth 2025-2030 (%)
Data Table on UAE - Year-over-year growth 2025-2030 (%)

12.7.3 South Africa - Market size and forecast 2025-2030

Chart on South Africa - Market size and forecast 2025-2030 ($ million)
Data Table on South Africa - Market size and forecast 2025-2030 ($ million)
Chart on South Africa - Year-over-year growth 2025-2030 (%)
Data Table on South Africa - Year-over-year growth 2025-2030 (%)

12.7.4 Israel - Market size and forecast 2025-2030

Chart on Israel - Market size and forecast 2025-2030 ($ million)
Data Table on Israel - Market size and forecast 2025-2030 ($ million)
Chart on Israel - Year-over-year growth 2025-2030 (%)
Data Table on Israel - Year-over-year growth 2025-2030 (%)

12.7.5 Turkey - Market size and forecast 2025-2030

Chart on Turkey - Market size and forecast 2025-2030 ($ million)
Data Table on Turkey - Market size and forecast 2025-2030 ($ million)
Chart on Turkey - Year-over-year growth 2025-2030 (%)
Data Table on Turkey - Year-over-year growth 2025-2030 (%)

12.8 Market opportunity by geography

Market opportunity by geography ($ million)
Data Tables on Market opportunity by geography ($ million)

13. Drivers, Challenges, and Opportunity

13.1 Market drivers

Volatile macroeconomic environments and interest rate uncertainty
Surging corporate transition toward real-time cloud cash visibility
Integration of agentic AI and predictive analytics

13.2 Market challenges

Legacy ERP integration bottlenecks and data silo fragmentation
Heightened cross-border cyber fraud and payment vulnerabilities
Evolving multi-jurisdictional regulations and sanctions strain compliance

13.3 Impact of drivers and challenges

Impact of drivers and challenges in 2025 and 2030

13.4 Market opportunities

Commercial adoption of agentic AI and autonomous treasury workflows
Pivoting toward real-time instant payments and open banking APIs
Integration of stablecoins and institutional digital asset treasury management

14. Competitive Landscape

14.1 Overview

14.2

Overview on criticality of inputs and factors of differentiation

14.3 Landscape disruption

Overview on factors of disruption

14.4 Industry risks

Impact of key risks on business

15. Competitive Analysis

15.1 Companies profiled

Companies covered

15.2 Company ranking index

15.3 Market positioning of companies

Matrix on companies position and classification

15.4 Agicap SAS

Agicap SAS - Overview
Agicap SAS - Product / Service
Agicap SAS - Key offerings
SWOT

15.5 Bottomline Technologies Inc.

Bottomline Technologies Inc. - Overview
Bottomline Technologies Inc. - Product / Service
Bottomline Technologies Inc. - Key offerings
SWOT

15.6 Broadridge Financial Solutions

Broadridge Financial Solutions - Overview
Broadridge Financial Solutions - Business segments
Broadridge Financial Solutions - Key offerings
Broadridge Financial Solutions - Segment focus
SWOT

15.7 Coupa Software Inc.

Coupa Software Inc. - Overview
Coupa Software Inc. - Product / Service
Coupa Software Inc. - Key offerings
SWOT

15.8 EdgeVerve Systems Ltd.

EdgeVerve Systems Ltd. - Overview
EdgeVerve Systems Ltd. - Product / Service
EdgeVerve Systems Ltd. - Key offerings
SWOT

15.9 Fidelity National Information

Fidelity National Information - Overview
Fidelity National Information - Business segments
Fidelity National Information - Key offerings
Fidelity National Information - Segment focus
SWOT

15.10 ION Group.

ION Group. - Overview
ION Group. - Product / Service
ION Group. - Key offerings
SWOT

15.11 Oracle Corp.

Oracle Corp. - Overview
Oracle Corp. - Business segments
Oracle Corp. - Key news
Oracle Corp. - Key offerings
Oracle Corp. - Segment focus
SWOT

15.12 Q2 Holdings Inc.

Q2 Holdings Inc. - Overview
Q2 Holdings Inc. - Product / Service
Q2 Holdings Inc. - Key offerings
SWOT

15.13 SAP SE

SAP SE - Overview
SAP SE - Business segments
SAP SE - Key news
SAP SE - Key offerings
SAP SE - Segment focus
SWOT

15.14 Serrala Group GmbH.

Serrala Group GmbH. - Overview
Serrala Group GmbH. - Product / Service
Serrala Group GmbH. - Key offerings
SWOT

15.15 SimCorp AS

SimCorp AS - Overview
SimCorp AS - Product / Service
SimCorp AS - Key offerings
SWOT

15.16 Tata Consultancy Services

Tata Consultancy Services - Overview
Tata Consultancy Services - Business segments
Tata Consultancy Services - Key news
Tata Consultancy Services - Key offerings
Tata Consultancy Services - Segment focus
SWOT

15.17 Temenos AG

Temenos AG - Overview
Temenos AG - Product / Service
Temenos AG - Key offerings
SWOT

15.18 Wolters Kluwer NV

Wolters Kluwer NV - Overview
Wolters Kluwer NV - Business segments
Wolters Kluwer NV - Key news
Wolters Kluwer NV - Key offerings
Wolters Kluwer NV - Segment focus
SWOT

16. Appendix

16.1 Scope of the report

Market definition
Objectives
Notes and caveats

16.2 Inclusions and exclusions checklist

Inclusions checklist
Exclusions checklist

16.3 Currency conversion rates for US$

16.4 Research methodology

16.5 Data procurement

Information sources

16.6 Data validation

16.7 Validation techniques employed for market sizing

16.8 Data synthesis

16.9 360 degree market analysis

16.10 List of abbreviations

Research Methodology

Technavio presents a detailed picture of the market by way of study, synthesis, and summation of data from multiple sources. The analysts have presented the various facets of the market with a particular focus on identifying the key industry influencers. The data thus presented is comprehensive, reliable, and the result of extensive research, both primary and secondary.

INFORMATION SOURCES

Primary sources

  • Manufacturers and suppliers
  • Channel partners
  • Industry experts
  • Strategic decision makers

Secondary sources

  • Industry journals and periodicals
  • Government data
  • Financial reports of key industry players
  • Historical data
  • Press releases

DATA ANALYSIS

Data Synthesis

  • Collation of data
  • Estimation of key figures
  • Analysis of derived insights

Data Validation

  • Triangulation with data models
  • Reference against proprietary databases
  • Corroboration with industry experts

REPORT WRITING

Qualitative

  • Market drivers
  • Market challenges
  • Market trends
  • Five forces analysis

Quantitative

  • Market size and forecast
  • Market segmentation
  • Geographical insights
  • Competitive landscape

Interested in this report?

Get your sample now to see our research methodology and insights!

Download Now

Frequently Asked Questions

Treasury And Risk Management Software market growth will increase by USD 1990.9 million during 2026-2030.

The Treasury And Risk Management Software market is expected to grow at a CAGR of 6.4% during 2026-2030.

Treasury And Risk Management Software market is segmented by Deployment (On-premises, Cloud-based) Type (Treasury, Investment management, Risk and compliance) Component (Software, Services)

Agicap SAS, Bottomline Technologies Inc., Broadridge Financial Solutions, Coupa Software Inc., EdgeVerve Systems Ltd., Fidelity National Information, ION Group., Kyriba Corp., Nomentia Oy., Oracle Corp., Q2 Holdings Inc., SAP SE, Serrala Group GmbH., SimCorp AS, Tata Consultancy Services, Temenos AG, Treasury Intelligence Solutions, Trovata Inc., Wolters Kluwer NV are a few of the key vendors in the Treasury And Risk Management Software market.

North America will register the highest growth rate of 34.4% among the other regions. Therefore, the Treasury And Risk Management Software market in North America is expected to garner significant business opportunities for the vendors during the forecast period.

US, Canada, Mexico, Germany, UK, France, Spain, Italy, The Netherlands, China, Japan, India, South Korea, Australia, Indonesia, Brazil, Argentina, Chile, Saudi Arabia, UAE, South Africa, Israel, Turkey

  • Volatile macroeconomic environments and interest rate uncertainty is the driving factor this market.

The Treasury And Risk Management Software market vendors should focus on grabbing business opportunities from the Deployment segment as it accounted for the largest market share in the base year.
RIA - Research AI Assistant
Ask RIA