
Thermoplastic Composites Market Analysis, Size, and Forecast 2026-2030: APAC (China, Japan, and India), North America (US, Canada, and Mexico), Europe (Germany, UK, and France), South America (Brazil, Argentina, and Chile), Middle East and Africa (Saudi Arabia, UAE, and South Africa), and Rest of World (ROW)

Thermoplastic Composites Market Analysis, Size, and Forecast 2026-2030:
APAC (China, Japan, and India), North America (US, Canada, and Mexico), Europe (Germany, UK, and France), South America (Brazil, Argentina, and Chile), Middle East and Africa (Saudi Arabia, UAE, and South Africa), and Rest of World (ROW)

Published: Nov 2026 351 Pages SKU: IRTNTR40603

Market Overview at a Glance

$10.55 B
Market Opportunity
7.7%
CAGR 2025 - 2030
47.4%
APAC Growth
$7.21 B
Short fiber thermoplastics segment 2024

Thermoplastic Composites Market Size 2026-2030

The thermoplastic composites market size is valued to increase by USD 10.55 billion, at a CAGR of 7.7% from 2025 to 2030. Expansion of renewable energy wind infrastructure will drive the thermoplastic composites market.

Major Market Trends & Insights

  • APAC dominated the market and accounted for a 47.4% growth during the forecast period.
  • By Product - Short fiber thermoplastics segment was valued at USD 7.21 billion in 2024
  • By End-user - Consumer goods and electronics segment accounted for the largest market revenue share in 2024

Market Size & Forecast

  • Market Opportunities: USD 16.85 billion
  • Market Future Opportunities: USD 10.55 billion
  • CAGR from 2025 to 2030 : 7.7%

Market Summary

  • The Thermoplastic Composites Market exhibits robust expansion driven by aggressive industrial requirements for structural lightweighting and rapid manufacturing processes. Original equipment manufacturers across the aerospace and automotive sectors increasingly substitute heavy metallic alloys with continuous fiber prepreg materials to achieve superior specific strength and lower operational weight.
  • A major operational shift involves supply chain optimization, where manufacturers utilize closed-loop circularity to reprocess post-industrial scrap into functional components, thereby reducing waste disposal overhead by 25%. A primary driver propelling this market is the expansion of renewable energy wind infrastructure, which demands high fracture toughness and recyclability for massive wind turbine blades.
  • Conversely, the market faces a significant structural challenge due to capital-intensive processing infrastructure and high raw material expenses, which create substantial entry barriers for smaller tier suppliers. The necessity for specialized automated tape laying machinery prolongs qualification cycles.
  • Despite these hurdles, advancements in induction welding and out-of-autoclave processing continue to accelerate production throughput and offset initial capital investments, ensuring sustained integration across high-performance engineering sectors.

What will be the Size of the Thermoplastic Composites Market during the forecast period?
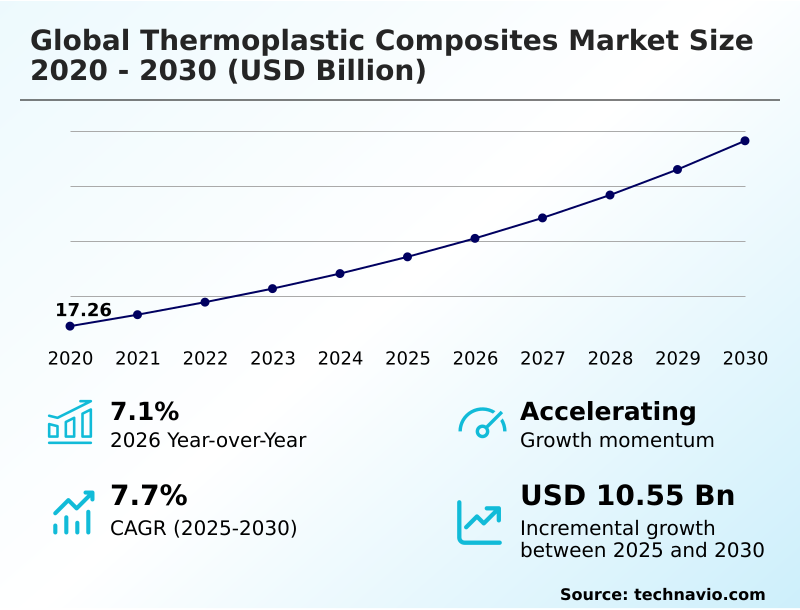
Get Key Insights on Market Forecast (PDF) Get Free Sample

How is the Thermoplastic Composites Market Segmented?

The thermoplastic composites industry research report provides comprehensive data (region-wise segment analysis), with forecasts and estimates in "USD million" for the period 2026-2030, as well as historical data from 2020-2024 for the following segments.

  • Product
    • Short fiber thermoplastics
    • Long fiber thermoplastics
    • Continuous fiber thermoplastics
    • Glass mat thermoplastics
  • End-user
    • Consumer goods and electronics
    • Automotive
    • Construction
    • Aerospace and defense
    • Others
  • Resin type
    • Polyamide
    • Polypropylene
    • Polyetheretherketone
    • Hybrid
    • Others
  • Fiber type
    • Glass fiber
    • Carbon fiber
    • Mineral fiber
    • Others
  • Geography
    • APAC
      • China
      • Japan
      • India
      • South Korea
      • Australia
      • Indonesia
    • North America
      • US
      • Canada
      • Mexico
    • Europe
      • Germany
      • UK
      • France
      • Italy
      • Spain
      • The Netherlands
    • South America
      • Brazil
      • Argentina
      • Chile
    • Middle East and Africa
      • Saudi Arabia
      • UAE
      • South Africa
      • Turkey
      • Israel

By Product Insights

The short fiber thermoplastics segment is estimated to witness significant growth during the forecast period.

Short fiber thermoplastics constitute the highest-volume product segment, utilizing a thermoplastic polymer matrix infused with discontinuous fibers measuring under a few millimeters. By leveraging standard injection molding and extrusion, processing facilities produce intricate structural lightweighting components with rapid cycle times.

Integrating short fiber reinforcement significantly enhances dimensional stability and flexural modulus compared to unreinforced polymers, enabling companies to achieve a 15% improvement in production throughput by eliminating secondary assembly stages.

This segment specifically benefits automotive and consumer electronics manufacturers seeking fast, high-volume part replication.

Furthermore, the inherent melt processability of these materials facilitates overmolding technique integration, directly optimizing the structural integrity of complex sub-assemblies and contributing to streamlined manufacturing workflows without requiring specialized out-of-autoclave processing equipment.
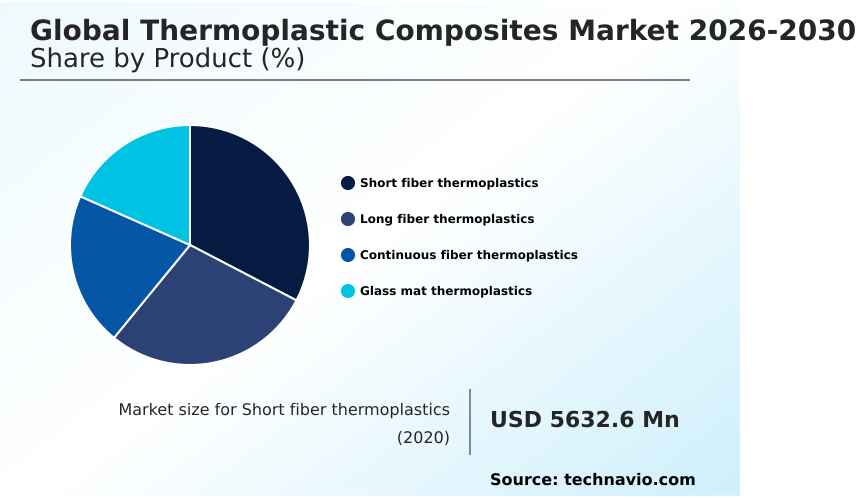
Get Free Sample

The Short fiber thermoplastics segment was valued at USD 7.21 billion in 2024 and showed a gradual increase during the forecast period.
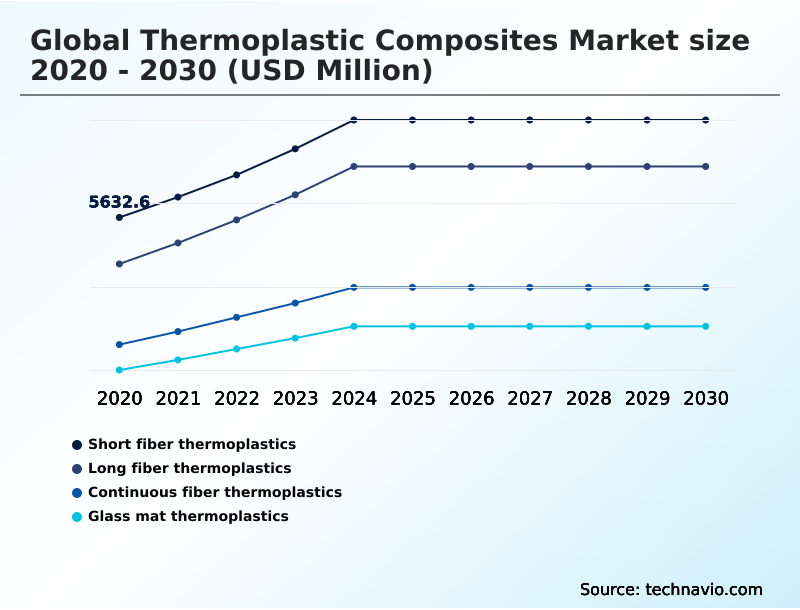
Get Free Sample

Regional Analysis

APAC is estimated to contribute 47.4% to the growth of the global market during the forecast period.Technavio’s analysts have elaborately explained the regional trends and drivers that shape the market during the forecast period.
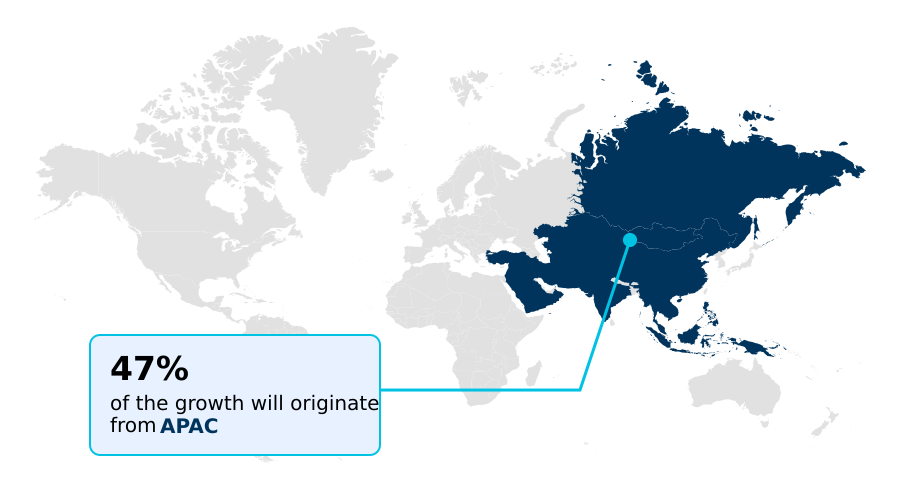
See How Thermoplastic Composites Market Demand is Rising in APAC Get Free Sample

The geographic landscape of the Thermoplastic Composites Market highlights distinct regional adoption strategies. APAC commands a dominant position over North America, demonstrating a 47.4% incremental growth share due to aggressive industrialization and consumer electronics manufacturing.

In APAC, production facilities leverage low conversion costs and vast raw material availability to achieve a 20% improvement in supply chain efficiency when producing consumer electronics housing and structural battery pack components.

Conversely, North America prioritizes high-performance aerospace and defense applications, utilizing continuous carbon fiber polyetheretherketone tape to meet strict fuel economy mandates.

This focus enables North American manufacturers to reduce airframe assembly downtime by 15% through advanced automated fiber placement aerospace structures.

While APAC leads in volume output via high-speed thermoforming process integration, North America maintains an edge in specialized out-of-autoclave processing, showcasing how distinct regional regulatory and economic environments dictate the deployment of structural lightweighting technologies.

Market Dynamics

Our researchers analyzed the data with 2025 as the base year, along with the key drivers, trends, and challenges. A holistic analysis of drivers will help companies refine their marketing strategies to gain a competitive advantage.

  • The ongoing evolution of the Thermoplastic Composites Market demonstrates a strategic shift toward advanced material formulations that prioritize operational efficiency and environmental compliance. Aerospace manufacturers increasingly rely on automated fiber placement aerospace structures to achieve precise material deposition, effectively reducing assembly cycle times by a factor of three compared to traditional manual layup methods.
  • This acceleration in production is further supported by the deployment of continuous carbon fiber polyetheretherketone tape, which delivers exceptional thermal stability and interlaminar shear strength for mission-critical flight components. Simultaneously, the automotive sector has rapidly adopted glass mat thermoplastic automotive shields to replace heavier metallic underbody protection, improving vehicle range efficiency and fuel economy margins by up to fifteen percent.
  • For internal cabin and electronic support systems, short fiber reinforced polyamide frames provide the necessary dimensional stability and crash energy absorption while facilitating rapid, high-volume injection molding. Furthermore, the renewable energy sector is addressing critical waste management challenges by integrating recyclable wind turbine blade materials, which drastically mitigate end-of-life disposal liabilities and align with stringent corporate sustainability targets.
  • These combined technological transitions underscore a broader industry movement where automated processing and recyclable matrix systems structurally optimize supply chain resilience and lower total lifecycle costs across diverse high-performance manufacturing sectors.
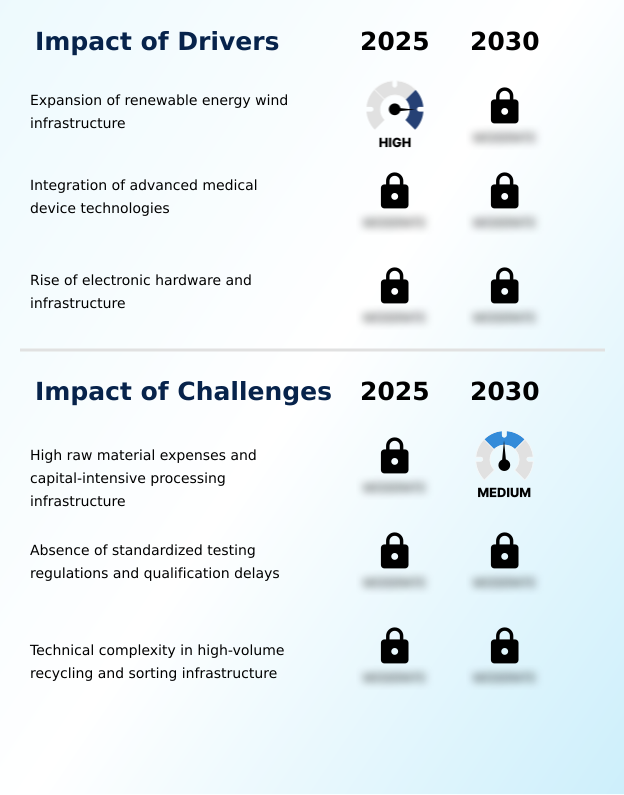
What are the key market drivers leading to the rise in the adoption of Thermoplastic Composites Industry?

  • The expansion of renewable energy wind infrastructure serves as a primary driver propelling market growth.

  • The rapid expansion of clean energy infrastructure and electric mobility platforms acts as a massive catalyst for the Thermoplastic Composites Market.
  • Because traditional metals suffer from heavy mass and severe corrosion in harsh environments, operators are aggressively specifying polypropylene composites and long fiber pultrusion for critical high-pressure storage vessel and offshore oil riser applications.
  • This material substitution directly enhances operational longevity, reducing maintenance expenditures by 28%.
  • Additionally, the surging demand for fuel cell cylinder systems requires advanced electromagnetic interference shielding and high fracture toughness, prompting a 20% improvement in payload efficiency for commercial transport fleets.
  • This urgent need for durable, lightweight materials systematically forces manufacturers to upgrade composite architectures, ensuring long-term operational resilience.

What are the market trends shaping the Thermoplastic Composites Industry?

  • Expanding hydrogen infrastructure and renewable energy pipelines represents an emerging market trend. This development necessitates advanced materials capable of withstanding extreme operational environments and high pressures.

  • The Thermoplastic Composites Market is experiencing a definitive shift toward rapid consolidation technologies and sustainable material integration. Driven by stringent decarbonization targets, aerospace and automotive manufacturers are adopting organosheet consolidation and overmolding technique integration to replace heavy metallic components. This transition allows facilities to consolidate complex multi-part assemblies, thereby reducing production downtime by 30% and improving overall structural reliability.
  • Furthermore, the increasing incorporation of bio-based resin systems into high-performance applications addresses critical environmental compliance mandates, yielding a 25% improvement in supply chain lifecycle sustainability metrics. By implementing automated tape laying alongside high-speed thermoforming process equipment, businesses effectively eliminate extended curing cycles, significantly lowering energy consumption and streamlining continuous fiber processing across globally distributed manufacturing networks.

What challenges does the Thermoplastic Composites Industry face during its growth?

  • High raw material expenses coupled with capital-intensive processing infrastructure present significant challenges affecting overall industry expansion.

  • The widespread commercialization of the Thermoplastic Composites Market is heavily constrained by exorbitant raw material costs and the necessity for capital-intensive machinery. Processing high-temperature polymers like polyetheretherketone matrix systems requires immense thermal energy and specialized vacuum-forming consolidation equipment, which restricts entry for smaller tier suppliers.
  • Consequently, procurement costs for continuous carbon fiber tape remain prohibitively high, lowering profit margins by 15% for mid-sized automotive component fabricators. Furthermore, the lack of standardized ultrasonic joint inspection protocols for heat-welded seams delays component certification, decreasing time-to-market efficiency by 22%.
  • These substantial financial and regulatory bottlenecks force engineering teams to balance the exceptional interlaminar shear strength of thermoplastic composites against the steep upfront capital expenditure required for mass production.

Exclusive Technavio Analysis on Customer Landscape

The thermoplastic composites market forecasting report includes the adoption lifecycle of the market, covering from the innovator’s stage to the laggard’s stage. It focuses on adoption rates in different regions based on penetration. Furthermore, the thermoplastic composites market report also includes key purchase criteria and drivers of price sensitivity to help companies evaluate and develop their market growth analysis strategies.
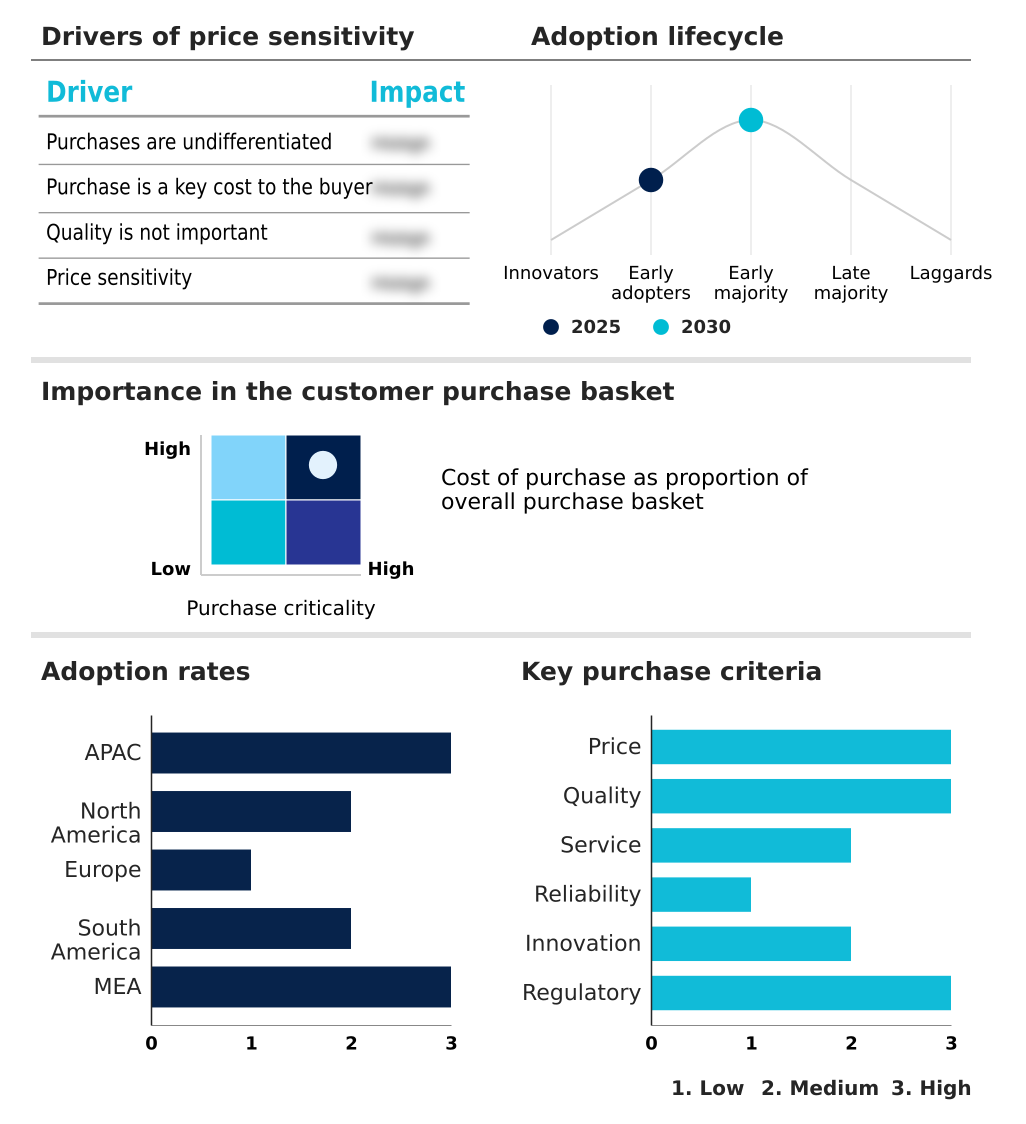
Customer Landscape of Thermoplastic Composites Industry

Competitive Landscape

Companies are implementing various strategies, such as strategic alliances, thermoplastic composites market forecast, partnerships, mergers and acquisitions, geographical expansion, and product/service launches, to enhance their presence in the industry.

Advanced Petrochemical Co. - The portfolio features advanced polypropylene-based compounds, impact-modified polypropylene, and high-performance reinforced polyolefin materials engineered to optimize structural integrity and continuous fiber consolidation across industrial applications.

The industry research and growth report includes detailed analyses of the competitive landscape of the market and information about key companies, including:

  • Advanced Petrochemical Co.
  • Borealis AG
  • Borouge PLC
  • Braskem SA
  • China Petrochemical Corp.
  • Ducor Petrochemicals B.V.
  • Exxon Mobil Corp.
  • Formosa Petrochemical Corp.
  • Haldia Petrochemicals Ltd.
  • INEOS Group Holdings S.A.
  • LG Chem Ltd.
  • Lotte Chemical Corp.
  • LyondellBasell Industries N.V.
  • Mitsui Chemicals Inc.
  • PolyMirae Co. Ltd.
  • Reliance Industries Ltd.
  • Repsol SA
  • Saudi Basic Industries
  • Sumitomo Chemical Co. Ltd.
  • TotalEnergies SE

Qualitative and quantitative analysis of companies has been conducted to help clients understand the wider business environment as well as the strengths and weaknesses of key industry players. Data is qualitatively analyzed to categorize companies as pure play, category-focused, industry-focused, and diversified; it is quantitatively analyzed to categorize companies as dominant, leading, strong, tentative, and weak.

Recent Development and News in Thermoplastic composites market

  • In the Specialty Chemicals industry, the shift toward sustainable closed-loop circularity has accelerated the deployment of chemical recycling technologies, directly impacting Thermoplastic Composites demand by recovering pristine fibers from post-industrial scrap and reducing raw material procurement costs by 20%.
  • In the Specialty Chemicals industry, stringent electromagnetic interference shielding regulations for high-frequency communication equipment have spurred the formulation of conductive polymer additives, increasing the adoption of specialized consumer electronics housing components by 15%.
  • In the Specialty Chemicals industry, advancements in viscosity modification and silane coupling agent technologies have improved fiber-matrix adhesion, enhancing the specific strength and corrosion resistance of offshore oil riser materials and boosting structural pipe lifespan by 30%.
  • In the Specialty Chemicals industry, the widespread commercialization of flame retardancy additives tailored for high-voltage systems has driven a 25% increase in the production of structural battery pack enclosures, supporting rapid cycle time reduction in automotive manufacturing environments.

Dive into Technavio’s robust research methodology, blending expert interviews, extensive data synthesis, and validated models for unparalleled Thermoplastic Composites Market insights. See full methodology.

Market Scope
Page number 351
Base year 2025
Historic period 2020-2024
Forecast period 2026-2030
Growth momentum & CAGR Accelerate at a CAGR of 7.7%
Market growth 2026-2030 USD 10548.5 million
Market structure Fragmented
YoY growth 2025-2026(%) 7.1%
Key countries China, Japan, India, South Korea, Australia, Indonesia, US, Canada, Mexico, Germany, UK, France, Italy, Spain, The Netherlands, Brazil, Argentina, Chile, Saudi Arabia, UAE, South Africa, Turkey and Israel
Competitive landscape Leading Companies, Market Positioning of Companies, Competitive Strategies, and Industry Risks

Request Free Sample

Research Analyst Overview

  • The Thermoplastic Composites Market demonstrates substantial momentum as industries aggressively transition toward automated, high-volume material processing. Enterprises heavily leverage continuous fiber prepreg and polyetheretherketone matrix formulations to achieve unparalleled structural lightweighting across critical transport and infrastructure sectors.
  • The integration of advanced automated tape laying and induction welding techniques allows production facilities to bypass traditional curing bottlenecks, enabling companies to achieve a 30% reduction in processing time for complex structural assemblies. This operational acceleration is critical for meeting stringent manufacturing quotas in the aerospace and automotive domains.
  • Furthermore, the adoption of long fiber pultrusion and glass mat thermoplastic components facilitates exceptional crash energy absorption and dimensional control. As regulatory frameworks increasingly demand sustainable practices, the capacity for chemical recycling of these thermoplastic matrices effectively addresses end-of-life disposal liabilities.
  • This continuous evolution toward out-of-autoclave processing and bio-based resin implementation underscores a fundamental strategic pivot, equipping manufacturers to optimize both supply chain resilience and long-term asset performance.

What are the Key Data Covered in this Thermoplastic Composites Market Research and Growth Report?

  • What is the expected growth of the Thermoplastic Composites Market between 2026 and 2030?

    • USD 10.55 billion, at a CAGR of 7.7%

  • What segmentation does the market report cover?

    • The report is segmented by Product (Short fiber thermoplastics, Long fiber thermoplastics, Continuous fiber thermoplastics, and Glass mat thermoplastics), End-user (Consumer goods and electronics, Automotive, Construction, Aerospace and defense, and Others), Resin Type (Polyamide, Polypropylene, Polyetheretherketone, Hybrid, and Others), Fiber Type (Glass fiber, Carbon fiber, Mineral fiber, and Others) and Geography (APAC, North America, Europe, South America, Middle East and Africa)

  • Which regions are analyzed in the report?

    • APAC, North America, Europe, South America and Middle East and Africa

  • What are the key growth drivers and market challenges?

    • Expansion of renewable energy wind infrastructure, High raw material expenses and capital-intensive processing infrastructure

  • Who are the major players in the Thermoplastic Composites Market?

    • Advanced Petrochemical Co., Borealis AG, Borouge PLC, Braskem SA, China Petrochemical Corp., Ducor Petrochemicals B.V., Exxon Mobil Corp., Formosa Petrochemical Corp., Haldia Petrochemicals Ltd., INEOS Group Holdings S.A., LG Chem Ltd., Lotte Chemical Corp., LyondellBasell Industries N.V., Mitsui Chemicals Inc., PolyMirae Co. Ltd., Reliance Industries Ltd., Repsol SA, Saudi Basic Industries, Sumitomo Chemical Co. Ltd. and TotalEnergies SE

Market Research Insights

  • The Thermoplastic Composites Market reflects a fundamental shift toward sustainable, high-efficiency material engineering. Driven by strict emission mandates and mobility advancements, manufacturers increasingly integrate continuous fiber reinforcement to optimize structural battery pack assemblies, achieving a 22% reduction in overall vehicle mass.
  • In the renewable energy sector, the demand for durable wind turbine blade components has accelerated the adoption of advanced matrix systems, yielding a 30% improvement in acoustic damping and fatigue resistance. Furthermore, the push for closed-loop circularity allows industrial processors to reclaim post-industrial scrap, lowering primary raw material expenditures by 18%.
  • This strategic transition toward scalable, recyclable composites significantly enhances specific strength while ensuring strict alignment with modern environmental compliance frameworks.

We can help! Our analysts can customize this thermoplastic composites market research report to meet your requirements.

Get in touch

1. Executive Summary

1.1 Market overview

Executive Summary - Chart on Market Overview
Executive Summary - Data Table on Market Overview
Executive Summary - Chart on Global Market Characteristics
Executive Summary - Chart on Market by Geography
Executive Summary - Chart on Market Segmentation by Product
Executive Summary - Chart on Market Segmentation by End-user
Executive Summary - Chart on Market Segmentation by Resin Type
Executive Summary - Chart on Market Segmentation by Fiber Type
Executive Summary - Chart on Incremental Growth
Executive Summary - Data Table on Incremental Growth
Executive Summary - Chart on Company Market Positioning

2. Technavio Analysis

2.1 Analysis of price sensitivity, lifecycle, customer purchase basket, adoption rates, and purchase criteria

2.2 Criticality of inputs and Factors of differentiation

Chart on Overview on criticality of inputs and factors of differentiation

2.3 Factors of disruption

Chart on Overview on factors of disruption

2.4 Impact of drivers and challenges

Chart on Impact of drivers and challenges in 2025 and 2030

3. Market Landscape

3.1 Market ecosystem

Chart on Parent Market
Data Table on - Parent Market

3.2 Market characteristics

Chart on Market characteristics analysis

3.3 Value chain analysis

Chart on Value chain analysis

4. Market Sizing

4.1 Market definition

Data Table on Offerings of companies included in the market definition

4.2 Market segment analysis

Market segments

4.3 Market size 2025

4.4 Market outlook: Forecast for 2025-2030

Chart on Global - Market size and forecast 2025-2030 ($ million)
Data Table on Global - Market size and forecast 2025-2030 ($ million)
Chart on Global Market: Year-over-year growth 2025-2030 (%)
Data Table on Global Market: Year-over-year growth 2025-2030 (%)

5. Historic Market Size

5.1 Global Thermoplastic Composites Market 2020 - 2024

Historic Market Size - Data Table on Global Thermoplastic Composites Market 2020 - 2024 ($ million)

5.2 Product segment analysis 2020 - 2024

Historic Market Size - Product Segment 2020 - 2024 ($ million)

5.3 End-user segment analysis 2020 - 2024

Historic Market Size - End-user Segment 2020 - 2024 ($ million)

5.4 Resin Type segment analysis 2020 - 2024

Historic Market Size - Resin Type Segment 2020 - 2024 ($ million)

5.5 Fiber Type segment analysis 2020 - 2024

Historic Market Size - Fiber Type Segment 2020 - 2024 ($ million)

5.6 Geography segment analysis 2020 - 2024

Historic Market Size - Geography Segment 2020 - 2024 ($ million)

5.7 Country segment analysis 2020 - 2024

Historic Market Size - Country Segment 2020 - 2024 ($ million)

6. Qualitative Analysis

6.1 Impact of AI on Global Thermoplastic Composites Market

6.2 Impact of geopolitical conflicts on Global Thermoplastic Composites Market

7. Five Forces Analysis

7.1 Five forces summary

Five forces analysis - Comparison between 2025 and 2030

7.2 Bargaining power of buyers

Bargaining power of buyers - Impact of key factors 2025 and 2030

7.3 Bargaining power of suppliers

Bargaining power of suppliers - Impact of key factors in 2025 and 2030

7.4 Threat of new entrants

Threat of new entrants - Impact of key factors in 2025 and 2030

7.5 Threat of substitutes

Threat of substitutes - Impact of key factors in 2025 and 2030

7.6 Threat of rivalry

Threat of rivalry - Impact of key factors in 2025 and 2030

7.7 Market condition

Chart on Market condition - Five forces 2025 and 2030

8. Market Segmentation by Product

8.1 Market segments

Chart on Product - Market share 2025-2030 (%)
Data Table on Product - Market share 2025-2030 (%)

8.2 Comparison by Product

Chart on Comparison by Product
Data Table on Comparison by Product

8.3 Short fiber thermoplastics - Market size and forecast 2025-2030

Chart on Short fiber thermoplastics - Market size and forecast 2025-2030 ($ million)
Data Table on Short fiber thermoplastics - Market size and forecast 2025-2030 ($ million)
Chart on Short fiber thermoplastics - Year-over-year growth 2025-2030 (%)
Data Table on Short fiber thermoplastics - Year-over-year growth 2025-2030 (%)

8.4 Long fiber thermoplastics - Market size and forecast 2025-2030

Chart on Long fiber thermoplastics - Market size and forecast 2025-2030 ($ million)
Data Table on Long fiber thermoplastics - Market size and forecast 2025-2030 ($ million)
Chart on Long fiber thermoplastics - Year-over-year growth 2025-2030 (%)
Data Table on Long fiber thermoplastics - Year-over-year growth 2025-2030 (%)

8.5 Continuous fiber thermoplastics - Market size and forecast 2025-2030

Chart on Continuous fiber thermoplastics - Market size and forecast 2025-2030 ($ million)
Data Table on Continuous fiber thermoplastics - Market size and forecast 2025-2030 ($ million)
Chart on Continuous fiber thermoplastics - Year-over-year growth 2025-2030 (%)
Data Table on Continuous fiber thermoplastics - Year-over-year growth 2025-2030 (%)

8.6 Glass mat thermoplastics - Market size and forecast 2025-2030

Chart on Glass mat thermoplastics - Market size and forecast 2025-2030 ($ million)
Data Table on Glass mat thermoplastics - Market size and forecast 2025-2030 ($ million)
Chart on Glass mat thermoplastics - Year-over-year growth 2025-2030 (%)
Data Table on Glass mat thermoplastics - Year-over-year growth 2025-2030 (%)

8.7 Market opportunity by Product

Market opportunity by Product ($ million)
Data Table on Market opportunity by Product ($ million)

9. Market Segmentation by End-user

9.1 Market segments

Chart on End-user - Market share 2025-2030 (%)
Data Table on End-user - Market share 2025-2030 (%)

9.2 Comparison by End-user

Chart on Comparison by End-user
Data Table on Comparison by End-user

9.3 Consumer goods and electronics - Market size and forecast 2025-2030

Chart on Consumer goods and electronics - Market size and forecast 2025-2030 ($ million)
Data Table on Consumer goods and electronics - Market size and forecast 2025-2030 ($ million)
Chart on Consumer goods and electronics - Year-over-year growth 2025-2030 (%)
Data Table on Consumer goods and electronics - Year-over-year growth 2025-2030 (%)

9.4 Automotive - Market size and forecast 2025-2030

Chart on Automotive - Market size and forecast 2025-2030 ($ million)
Data Table on Automotive - Market size and forecast 2025-2030 ($ million)
Chart on Automotive - Year-over-year growth 2025-2030 (%)
Data Table on Automotive - Year-over-year growth 2025-2030 (%)

9.5 Construction - Market size and forecast 2025-2030

Chart on Construction - Market size and forecast 2025-2030 ($ million)
Data Table on Construction - Market size and forecast 2025-2030 ($ million)
Chart on Construction - Year-over-year growth 2025-2030 (%)
Data Table on Construction - Year-over-year growth 2025-2030 (%)

9.6 Aerospace and defense - Market size and forecast 2025-2030

Chart on Aerospace and defense - Market size and forecast 2025-2030 ($ million)
Data Table on Aerospace and defense - Market size and forecast 2025-2030 ($ million)
Chart on Aerospace and defense - Year-over-year growth 2025-2030 (%)
Data Table on Aerospace and defense - Year-over-year growth 2025-2030 (%)

9.7 Others - Market size and forecast 2025-2030

Chart on Others - Market size and forecast 2025-2030 ($ million)
Data Table on Others - Market size and forecast 2025-2030 ($ million)
Chart on Others - Year-over-year growth 2025-2030 (%)
Data Table on Others - Year-over-year growth 2025-2030 (%)

9.8 Market opportunity by End-user

Market opportunity by End-user ($ million)
Data Table on Market opportunity by End-user ($ million)

10. Market Segmentation by Resin Type

10.1 Market segments

Chart on Resin Type - Market share 2025-2030 (%)
Data Table on Resin Type - Market share 2025-2030 (%)

10.2 Comparison by Resin Type

Chart on Comparison by Resin Type
Data Table on Comparison by Resin Type

10.3 Polyamide - Market size and forecast 2025-2030

Chart on Polyamide - Market size and forecast 2025-2030 ($ million)
Data Table on Polyamide - Market size and forecast 2025-2030 ($ million)
Chart on Polyamide - Year-over-year growth 2025-2030 (%)
Data Table on Polyamide - Year-over-year growth 2025-2030 (%)

10.4 Polypropylene - Market size and forecast 2025-2030

Chart on Polypropylene - Market size and forecast 2025-2030 ($ million)
Data Table on Polypropylene - Market size and forecast 2025-2030 ($ million)
Chart on Polypropylene - Year-over-year growth 2025-2030 (%)
Data Table on Polypropylene - Year-over-year growth 2025-2030 (%)

10.5 Polyetheretherketone - Market size and forecast 2025-2030

Chart on Polyetheretherketone - Market size and forecast 2025-2030 ($ million)
Data Table on Polyetheretherketone - Market size and forecast 2025-2030 ($ million)
Chart on Polyetheretherketone - Year-over-year growth 2025-2030 (%)
Data Table on Polyetheretherketone - Year-over-year growth 2025-2030 (%)

10.6 Hybrid - Market size and forecast 2025-2030

Chart on Hybrid - Market size and forecast 2025-2030 ($ million)
Data Table on Hybrid - Market size and forecast 2025-2030 ($ million)
Chart on Hybrid - Year-over-year growth 2025-2030 (%)
Data Table on Hybrid - Year-over-year growth 2025-2030 (%)

10.7 Others - Market size and forecast 2025-2030

Chart on Others - Market size and forecast 2025-2030 ($ million)
Data Table on Others - Market size and forecast 2025-2030 ($ million)
Chart on Others - Year-over-year growth 2025-2030 (%)
Data Table on Others - Year-over-year growth 2025-2030 (%)

10.8 Market opportunity by Resin Type

Market opportunity by Resin Type ($ million)
Data Table on Market opportunity by Resin Type ($ million)

11. Market Segmentation by Fiber Type

11.1 Market segments

Chart on Fiber Type - Market share 2025-2030 (%)
Data Table on Fiber Type - Market share 2025-2030 (%)

11.2 Comparison by Fiber Type

Chart on Comparison by Fiber Type
Data Table on Comparison by Fiber Type

11.3 Glass fiber - Market size and forecast 2025-2030

Chart on Glass fiber - Market size and forecast 2025-2030 ($ million)
Data Table on Glass fiber - Market size and forecast 2025-2030 ($ million)
Chart on Glass fiber - Year-over-year growth 2025-2030 (%)
Data Table on Glass fiber - Year-over-year growth 2025-2030 (%)

11.4 Carbon fiber - Market size and forecast 2025-2030

Chart on Carbon fiber - Market size and forecast 2025-2030 ($ million)
Data Table on Carbon fiber - Market size and forecast 2025-2030 ($ million)
Chart on Carbon fiber - Year-over-year growth 2025-2030 (%)
Data Table on Carbon fiber - Year-over-year growth 2025-2030 (%)

11.5 Mineral fiber - Market size and forecast 2025-2030

Chart on Mineral fiber - Market size and forecast 2025-2030 ($ million)
Data Table on Mineral fiber - Market size and forecast 2025-2030 ($ million)
Chart on Mineral fiber - Year-over-year growth 2025-2030 (%)
Data Table on Mineral fiber - Year-over-year growth 2025-2030 (%)

11.6 Others - Market size and forecast 2025-2030

Chart on Others - Market size and forecast 2025-2030 ($ million)
Data Table on Others - Market size and forecast 2025-2030 ($ million)
Chart on Others - Year-over-year growth 2025-2030 (%)
Data Table on Others - Year-over-year growth 2025-2030 (%)

11.7 Market opportunity by Fiber Type

Market opportunity by Fiber Type ($ million)
Data Table on Market opportunity by Fiber Type ($ million)

12. Customer Landscape

12.1 Customer landscape overview

Analysis of price sensitivity, lifecycle, customer purchase basket, adoption rates, and purchase criteria

13. Geographic Landscape

13.1 Geographic segmentation

Chart on Market share by geography 2025-2030 (%)
Data Table on Market share by geography 2025-2030 (%)

13.2 Geographic comparison

Chart on Geographic comparison
Data Table on Geographic comparison

13.3 APAC - Market size and forecast 2025-2030

Chart on APAC - Market size and forecast 2025-2030 ($ million)
Data Table on APAC - Market size and forecast 2025-2030 ($ million)
Chart on APAC - Year-over-year growth 2025-2030 (%)
Data Table on APAC - Year-over-year growth 2025-2030 (%)
Chart on Regional Comparison - APAC
Data Table on Regional Comparison - APAC

13.3.1 China - Market size and forecast 2025-2030

Chart on China - Market size and forecast 2025-2030 ($ million)
Data Table on China - Market size and forecast 2025-2030 ($ million)
Chart on China - Year-over-year growth 2025-2030 (%)
Data Table on China - Year-over-year growth 2025-2030 (%)

13.3.2 Japan - Market size and forecast 2025-2030

Chart on Japan - Market size and forecast 2025-2030 ($ million)
Data Table on Japan - Market size and forecast 2025-2030 ($ million)
Chart on Japan - Year-over-year growth 2025-2030 (%)
Data Table on Japan - Year-over-year growth 2025-2030 (%)

13.3.3 India - Market size and forecast 2025-2030

Chart on India - Market size and forecast 2025-2030 ($ million)
Data Table on India - Market size and forecast 2025-2030 ($ million)
Chart on India - Year-over-year growth 2025-2030 (%)
Data Table on India - Year-over-year growth 2025-2030 (%)

13.3.4 South Korea - Market size and forecast 2025-2030

Chart on South Korea - Market size and forecast 2025-2030 ($ million)
Data Table on South Korea - Market size and forecast 2025-2030 ($ million)
Chart on South Korea - Year-over-year growth 2025-2030 (%)
Data Table on South Korea - Year-over-year growth 2025-2030 (%)

13.3.5 Australia - Market size and forecast 2025-2030

Chart on Australia - Market size and forecast 2025-2030 ($ million)
Data Table on Australia - Market size and forecast 2025-2030 ($ million)
Chart on Australia - Year-over-year growth 2025-2030 (%)
Data Table on Australia - Year-over-year growth 2025-2030 (%)

13.3.6 Indonesia - Market size and forecast 2025-2030

Chart on Indonesia - Market size and forecast 2025-2030 ($ million)
Data Table on Indonesia - Market size and forecast 2025-2030 ($ million)
Chart on Indonesia - Year-over-year growth 2025-2030 (%)
Data Table on Indonesia - Year-over-year growth 2025-2030 (%)

13.4 North America - Market size and forecast 2025-2030

Chart on North America - Market size and forecast 2025-2030 ($ million)
Data Table on North America - Market size and forecast 2025-2030 ($ million)
Chart on North America - Year-over-year growth 2025-2030 (%)
Data Table on North America - Year-over-year growth 2025-2030 (%)
Chart on Regional Comparison - North America
Data Table on Regional Comparison - North America

13.4.1 US - Market size and forecast 2025-2030

Chart on US - Market size and forecast 2025-2030 ($ million)
Data Table on US - Market size and forecast 2025-2030 ($ million)
Chart on US - Year-over-year growth 2025-2030 (%)
Data Table on US - Year-over-year growth 2025-2030 (%)

13.4.2 Canada - Market size and forecast 2025-2030

Chart on Canada - Market size and forecast 2025-2030 ($ million)
Data Table on Canada - Market size and forecast 2025-2030 ($ million)
Chart on Canada - Year-over-year growth 2025-2030 (%)
Data Table on Canada - Year-over-year growth 2025-2030 (%)

13.4.3 Mexico - Market size and forecast 2025-2030

Chart on Mexico - Market size and forecast 2025-2030 ($ million)
Data Table on Mexico - Market size and forecast 2025-2030 ($ million)
Chart on Mexico - Year-over-year growth 2025-2030 (%)
Data Table on Mexico - Year-over-year growth 2025-2030 (%)

13.5 Europe - Market size and forecast 2025-2030

Chart on Europe - Market size and forecast 2025-2030 ($ million)
Data Table on Europe - Market size and forecast 2025-2030 ($ million)
Chart on Europe - Year-over-year growth 2025-2030 (%)
Data Table on Europe - Year-over-year growth 2025-2030 (%)
Chart on Regional Comparison - Europe
Data Table on Regional Comparison - Europe

13.5.1 Germany - Market size and forecast 2025-2030

Chart on Germany - Market size and forecast 2025-2030 ($ million)
Data Table on Germany - Market size and forecast 2025-2030 ($ million)
Chart on Germany - Year-over-year growth 2025-2030 (%)
Data Table on Germany - Year-over-year growth 2025-2030 (%)

13.5.2 UK - Market size and forecast 2025-2030

Chart on UK - Market size and forecast 2025-2030 ($ million)
Data Table on UK - Market size and forecast 2025-2030 ($ million)
Chart on UK - Year-over-year growth 2025-2030 (%)
Data Table on UK - Year-over-year growth 2025-2030 (%)

13.5.3 France - Market size and forecast 2025-2030

Chart on France - Market size and forecast 2025-2030 ($ million)
Data Table on France - Market size and forecast 2025-2030 ($ million)
Chart on France - Year-over-year growth 2025-2030 (%)
Data Table on France - Year-over-year growth 2025-2030 (%)

13.5.4 Italy - Market size and forecast 2025-2030

Chart on Italy - Market size and forecast 2025-2030 ($ million)
Data Table on Italy - Market size and forecast 2025-2030 ($ million)
Chart on Italy - Year-over-year growth 2025-2030 (%)
Data Table on Italy - Year-over-year growth 2025-2030 (%)

13.5.5 Spain - Market size and forecast 2025-2030

Chart on Spain - Market size and forecast 2025-2030 ($ million)
Data Table on Spain - Market size and forecast 2025-2030 ($ million)
Chart on Spain - Year-over-year growth 2025-2030 (%)
Data Table on Spain - Year-over-year growth 2025-2030 (%)

13.5.6 The Netherlands - Market size and forecast 2025-2030

Chart on The Netherlands - Market size and forecast 2025-2030 ($ million)
Data Table on The Netherlands - Market size and forecast 2025-2030 ($ million)
Chart on The Netherlands - Year-over-year growth 2025-2030 (%)
Data Table on The Netherlands - Year-over-year growth 2025-2030 (%)

13.6 South America - Market size and forecast 2025-2030

Chart on South America - Market size and forecast 2025-2030 ($ million)
Data Table on South America - Market size and forecast 2025-2030 ($ million)
Chart on South America - Year-over-year growth 2025-2030 (%)
Data Table on South America - Year-over-year growth 2025-2030 (%)
Chart on Regional Comparison - South America
Data Table on Regional Comparison - South America

13.6.1 Brazil - Market size and forecast 2025-2030

Chart on Brazil - Market size and forecast 2025-2030 ($ million)
Data Table on Brazil - Market size and forecast 2025-2030 ($ million)
Chart on Brazil - Year-over-year growth 2025-2030 (%)
Data Table on Brazil - Year-over-year growth 2025-2030 (%)

13.6.2 Argentina - Market size and forecast 2025-2030

Chart on Argentina - Market size and forecast 2025-2030 ($ million)
Data Table on Argentina - Market size and forecast 2025-2030 ($ million)
Chart on Argentina - Year-over-year growth 2025-2030 (%)
Data Table on Argentina - Year-over-year growth 2025-2030 (%)

13.6.3 Chile - Market size and forecast 2025-2030

Chart on Chile - Market size and forecast 2025-2030 ($ million)
Data Table on Chile - Market size and forecast 2025-2030 ($ million)
Chart on Chile - Year-over-year growth 2025-2030 (%)
Data Table on Chile - Year-over-year growth 2025-2030 (%)

13.7 Middle East and Africa - Market size and forecast 2025-2030

Chart on Middle East and Africa - Market size and forecast 2025-2030 ($ million)
Data Table on Middle East and Africa - Market size and forecast 2025-2030 ($ million)
Chart on Middle East and Africa - Year-over-year growth 2025-2030 (%)
Data Table on Middle East and Africa - Year-over-year growth 2025-2030 (%)
Chart on Regional Comparison - Middle East and Africa
Data Table on Regional Comparison - Middle East and Africa

13.7.1 Saudi Arabia - Market size and forecast 2025-2030

Chart on Saudi Arabia - Market size and forecast 2025-2030 ($ million)
Data Table on Saudi Arabia - Market size and forecast 2025-2030 ($ million)
Chart on Saudi Arabia - Year-over-year growth 2025-2030 (%)
Data Table on Saudi Arabia - Year-over-year growth 2025-2030 (%)

13.7.2 UAE - Market size and forecast 2025-2030

Chart on UAE - Market size and forecast 2025-2030 ($ million)
Data Table on UAE - Market size and forecast 2025-2030 ($ million)
Chart on UAE - Year-over-year growth 2025-2030 (%)
Data Table on UAE - Year-over-year growth 2025-2030 (%)

13.7.3 South Africa - Market size and forecast 2025-2030

Chart on South Africa - Market size and forecast 2025-2030 ($ million)
Data Table on South Africa - Market size and forecast 2025-2030 ($ million)
Chart on South Africa - Year-over-year growth 2025-2030 (%)
Data Table on South Africa - Year-over-year growth 2025-2030 (%)

13.7.4 Turkey - Market size and forecast 2025-2030

Chart on Turkey - Market size and forecast 2025-2030 ($ million)
Data Table on Turkey - Market size and forecast 2025-2030 ($ million)
Chart on Turkey - Year-over-year growth 2025-2030 (%)
Data Table on Turkey - Year-over-year growth 2025-2030 (%)

13.7.5 Israel - Market size and forecast 2025-2030

Chart on Israel - Market size and forecast 2025-2030 ($ million)
Data Table on Israel - Market size and forecast 2025-2030 ($ million)
Chart on Israel - Year-over-year growth 2025-2030 (%)
Data Table on Israel - Year-over-year growth 2025-2030 (%)

13.8 Market opportunity by geography

Market opportunity by geography ($ million)
Data Tables on Market opportunity by geography ($ million)

14. Drivers, Challenges, and Opportunity

14.1 Market drivers

Expansion of renewable energy wind infrastructure
Integration of advanced medical device technologies
Rise of electronic hardware and infrastructure

14.2 Market challenges

High raw material expenses and capital-intensive processing infrastructure
Absence of standardized testing regulations and qualification delays
Technical complexity in high-volume recycling and sorting infrastructure

14.3 Impact of drivers and challenges

Impact of drivers and challenges in 2025 and 2030

14.4 Market opportunities

Expanding hydrogen infrastructure and renewable energy pipelines
Integration of thermoplastics in smart electronics and consumer devices
Rise of aerospace retrofits and advanced air mobility innovation

15. Competitive Landscape

15.1 Overview

15.2

Overview on criticality of inputs and factors of differentiation

15.3 Landscape disruption

Overview on factors of disruption

15.4 Industry risks

Impact of key risks on business

16. Competitive Analysis

16.1 Companies profiled

Companies covered

16.2 Company ranking index

16.3 Market positioning of companies

Matrix on companies position and classification

16.4 Advanced Petrochemical Co.

Advanced Petrochemical Co. - Overview
Advanced Petrochemical Co. - Product / Service
Advanced Petrochemical Co. - Key offerings
SWOT

16.5 Borouge PLC

Borouge PLC - Overview
Borouge PLC - Product / Service
Borouge PLC - Key offerings
SWOT

16.6 Braskem SA

Braskem SA - Overview
Braskem SA - Business segments
Braskem SA - Key offerings
Braskem SA - Segment focus
SWOT

16.7 China Petrochemical Corp.

China Petrochemical Corp. - Overview
China Petrochemical Corp. - Business segments
China Petrochemical Corp. - Key offerings
China Petrochemical Corp. - Segment focus
SWOT

16.8 Exxon Mobil Corp.

Exxon Mobil Corp. - Overview
Exxon Mobil Corp. - Business segments
Exxon Mobil Corp. - Key news
Exxon Mobil Corp. - Key offerings
Exxon Mobil Corp. - Segment focus
SWOT

16.9 Formosa Petrochemical Corp.

Formosa Petrochemical Corp. - Overview
Formosa Petrochemical Corp. - Product / Service
Formosa Petrochemical Corp. - Key offerings
SWOT

16.10 LG Chem Ltd.

LG Chem Ltd. - Overview
LG Chem Ltd. - Business segments
LG Chem Ltd. - Key news
LG Chem Ltd. - Key offerings
LG Chem Ltd. - Segment focus
SWOT

16.11 Lotte Chemical Corp.

Lotte Chemical Corp. - Overview
Lotte Chemical Corp. - Business segments
Lotte Chemical Corp. - Key offerings
Lotte Chemical Corp. - Segment focus
SWOT

16.12 LyondellBasell Industries N.V.

LyondellBasell Industries N.V. - Overview
LyondellBasell Industries N.V. - Business segments
LyondellBasell Industries N.V. - Key news
LyondellBasell Industries N.V. - Key offerings
LyondellBasell Industries N.V. - Segment focus
SWOT

16.13 Mitsui Chemicals Inc.

Mitsui Chemicals Inc. - Overview
Mitsui Chemicals Inc. - Business segments
Mitsui Chemicals Inc. - Key offerings
Mitsui Chemicals Inc. - Segment focus
SWOT

16.14 Reliance Industries Ltd.

Reliance Industries Ltd. - Overview
Reliance Industries Ltd. - Business segments
Reliance Industries Ltd. - Key offerings
Reliance Industries Ltd. - Segment focus
SWOT

16.15 Repsol SA

Repsol SA - Overview
Repsol SA - Business segments
Repsol SA - Key offerings
Repsol SA - Segment focus
SWOT

16.16 Saudi Basic Industries

Saudi Basic Industries - Overview
Saudi Basic Industries - Business segments
Saudi Basic Industries - Key offerings
Saudi Basic Industries - Segment focus
SWOT

16.17 Sumitomo Chemical Co. Ltd.

Sumitomo Chemical Co. Ltd. - Overview
Sumitomo Chemical Co. Ltd. - Business segments
Sumitomo Chemical Co. Ltd. - Key offerings
Sumitomo Chemical Co. Ltd. - Segment focus
SWOT

16.18 TotalEnergies SE

TotalEnergies SE - Overview
TotalEnergies SE - Business segments
TotalEnergies SE - Key news
TotalEnergies SE - Key offerings
TotalEnergies SE - Segment focus
SWOT

17. Appendix

17.1 Scope of the report

Market definition
Objectives
Notes and caveats

17.2 Inclusions and exclusions checklist

Inclusions checklist
Exclusions checklist

17.3 Currency conversion rates for US$

17.4 Research methodology

17.5 Data procurement

Information sources

17.6 Data validation

17.7 Validation techniques employed for market sizing

17.8 Data synthesis

17.9 360 degree market analysis

17.10 List of abbreviations

Research Methodology

Technavio presents a detailed picture of the market by way of study, synthesis, and summation of data from multiple sources. The analysts have presented the various facets of the market with a particular focus on identifying the key industry influencers. The data thus presented is comprehensive, reliable, and the result of extensive research, both primary and secondary.

INFORMATION SOURCES

Primary sources

  • Manufacturers and suppliers
  • Channel partners
  • Industry experts
  • Strategic decision makers

Secondary sources

  • Industry journals and periodicals
  • Government data
  • Financial reports of key industry players
  • Historical data
  • Press releases

DATA ANALYSIS

Data Synthesis

  • Collation of data
  • Estimation of key figures
  • Analysis of derived insights

Data Validation

  • Triangulation with data models
  • Reference against proprietary databases
  • Corroboration with industry experts

REPORT WRITING

Qualitative

  • Market drivers
  • Market challenges
  • Market trends
  • Five forces analysis

Quantitative

  • Market size and forecast
  • Market segmentation
  • Geographical insights
  • Competitive landscape

Interested in this report?

Get your sample now to see our research methodology and insights!

Download Now

Frequently Asked Questions

Thermoplastic Composites market growth will increase by USD 10548.5 million during 2026-2030.

The Thermoplastic Composites market is expected to grow at a CAGR of 7.7% during 2026-2030.

Thermoplastic Composites market is segmented by Product (Short fiber thermoplastics, Long fiber thermoplastics, Continuous fiber thermoplastics, Glass mat thermoplastics) End-user (Consumer goods and electronics, Automotive, Construction, Aerospace and defense, Others) Resin type (Polyamide, Polypropylene, Polyetheretherketone, Hybrid, Others) Fiber type (Glass fiber, Carbon fiber, Mineral fiber, Others)

Advanced Petrochemical Co., Borealis AG, Borouge PLC, Braskem SA, China Petrochemical Corp., Ducor Petrochemicals B.V., Exxon Mobil Corp., Formosa Petrochemical Corp., Haldia Petrochemicals Ltd., INEOS Group Holdings S.A., LG Chem Ltd., Lotte Chemical Corp., LyondellBasell Industries N.V., Mitsui Chemicals Inc., PolyMirae Co. Ltd., Reliance Industries Ltd., Repsol SA, Saudi Basic Industries, Sumitomo Chemical Co. Ltd., TotalEnergies SE are a few of the key vendors in the Thermoplastic Composites market.

APAC will register the highest growth rate of 47.4% among the other regions. Therefore, the Thermoplastic Composites market in APAC is expected to garner significant business opportunities for the vendors during the forecast period.

China, Japan, India, South Korea, Australia, Indonesia, US, Canada, Mexico, Germany, UK, France, Italy, Spain, The Netherlands, Brazil, Argentina, Chile, Saudi Arabia, UAE, South Africa, Turkey, Israel

  • Expansion of renewable energy wind infrastructure is the driving factor this market.

The Thermoplastic Composites market vendors should focus on grabbing business opportunities from the Product segment as it accounted for the largest market share in the base year.
RIA - Research AI Assistant
Ask RIA