
Television Market Analysis, Size, and Forecast 2026-2030: APAC (China, Japan, and India), North America (US, Canada, and Mexico), Europe (Germany, UK, and France), South America (Brazil, Argentina, and Chile), Middle East and Africa (Saudi Arabia, Turkey, and South Africa), and Rest of World (ROW)

Television Market Analysis, Size, and Forecast 2026-2030:
APAC (China, Japan, and India), North America (US, Canada, and Mexico), Europe (Germany, UK, and France), South America (Brazil, Argentina, and Chile), Middle East and Africa (Saudi Arabia, Turkey, and South Africa), and Rest of World (ROW)

Published: Nov 2026 314 Pages SKU: IRTNTR41137

Market Overview at a Glance

$75.43 B
Market Opportunity
7.9%
CAGR 2025 - 2030
41.2%
APAC Growth
$87.20 B
UHD segment 2024

Television Market Size 2026-2030

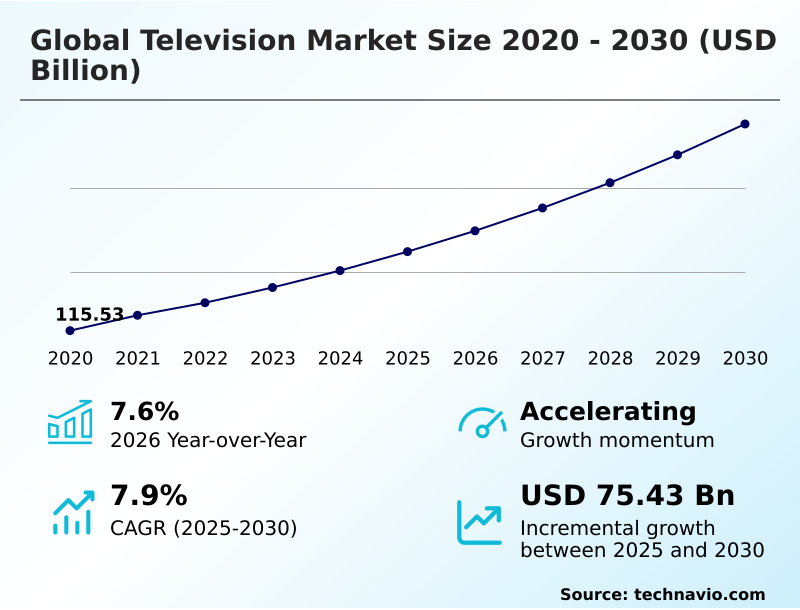
The television market size is valued to increase by USD 75.43 billion, at a CAGR of 7.9% from 2025 to 2030. Accelerated commercialization of mini-LED and advanced panel architectures will drive the television market.

Major Market Trends & Insights

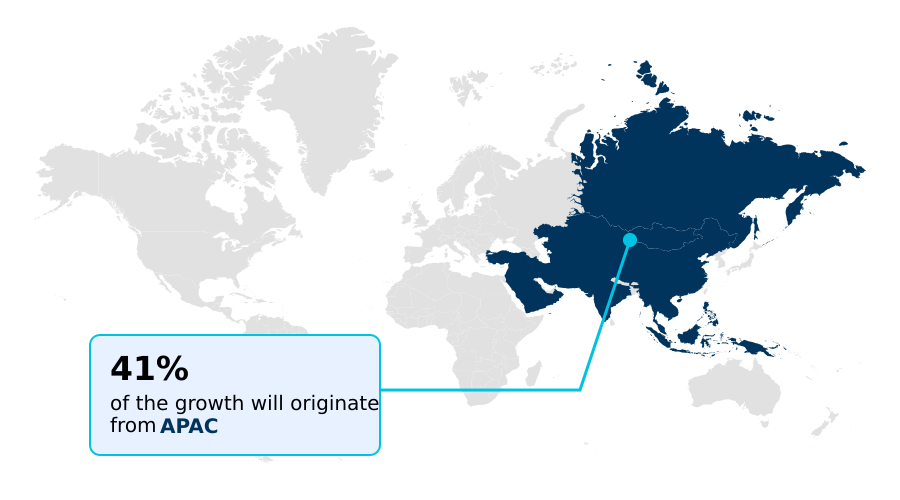
  • APAC dominated the market and accounted for a 41.2% growth during the forecast period.
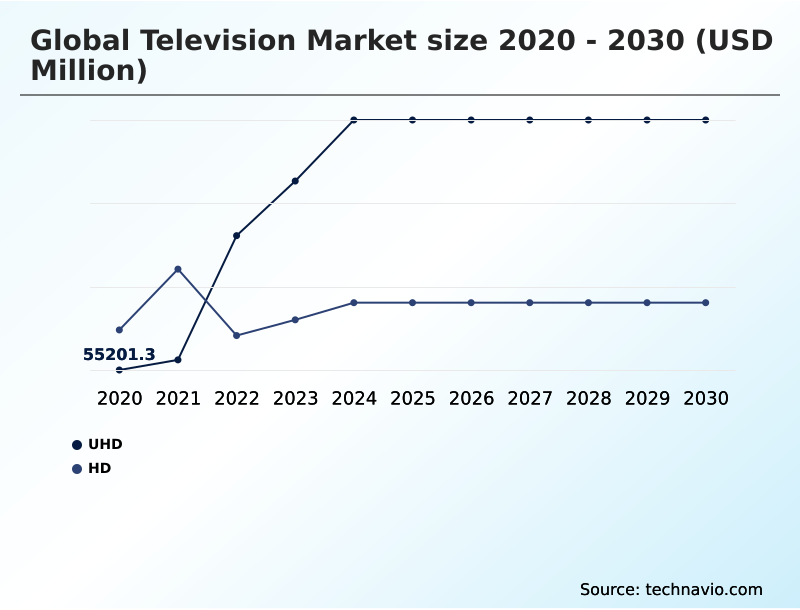
  • By Technology - UHD segment was valued at USD 87.20 billion in 2024
  • By Display Size - Upto 43 inches segment accounted for the largest market revenue share in 2024

Market Size & Forecast

  • Market Opportunities: USD 122.12 billion
  • Market Future Opportunities: USD 75.43 billion
  • CAGR from 2025 to 2030 : 7.9%

Market Summary

  • The Television Market is undergoing a structural transformation driven by the rapid proliferation of intelligent software ecosystems and expansive display dimensions. The accelerated commercialization of miniaturized light-emitting diode backlighting acts as a primary market driver, empowering manufacturers to deliver unprecedented contrast ratios and peak luminance, thereby stimulating aggressive replacement cycles among consumers seeking cinematic immersion.
  • In a practical supply chain scenario, manufacturers localizing final assembly near critical glass fabrication hubs report freight logistics efficiency improved by 18%, substantially mitigating exposure to volatile ocean shipping constraints. However, intense hardware commoditization and margin compression across mass-market segments pose a formidable structural challenge, forcing established brands into aggressive promotional discounting that erodes baseline profitability.
  • To counteract this margin erosion, industry participants are pivoting toward recurring monetization strategies rooted in targeted digital advertising and connected smart platforms. The continuous evolution of embedded artificial intelligence processors further elevates standard content to native high-resolution formats seamlessly.
  • Ultimately, sustainable competitive advantage in this sector demands a rigorous balance between cost-efficient mass production and the continuous integration of premium architectural aesthetics.

What will be the Size of the Television Market during the forecast period?
Get Key Insights on Market Forecast (PDF) Get Free Sample

How is the Television Market Segmented?

The television industry research report provides comprehensive data (region-wise segment analysis), with forecasts and estimates in "USD million" for the period 2026-2030, as well as historical data from 2020-2024 for the following segments.

  • Technology
    • UHD
    • HD
  • Display size
    • Upto 43 inches
    • Above 50 to 64 inches
    • Above 43 to 50 inches
    • Greater than 65 inches
  • Distribution channel
    • Offline
    • Online
  • End-user
    • Residential
    • Commercial and institutional
  • Geography
    • APAC
      • China
      • Japan
      • India
      • South Korea
      • Australia
      • Indonesia
    • North America
      • US
      • Canada
      • Mexico
    • Europe
      • Germany
      • UK
      • France
      • Italy
      • Spain
      • The Netherlands
    • South America
      • Brazil
      • Argentina
      • Chile
    • Middle East and Africa
      • Saudi Arabia
      • Turkey
      • South Africa
      • UAE
      • Israel

By Technology Insights

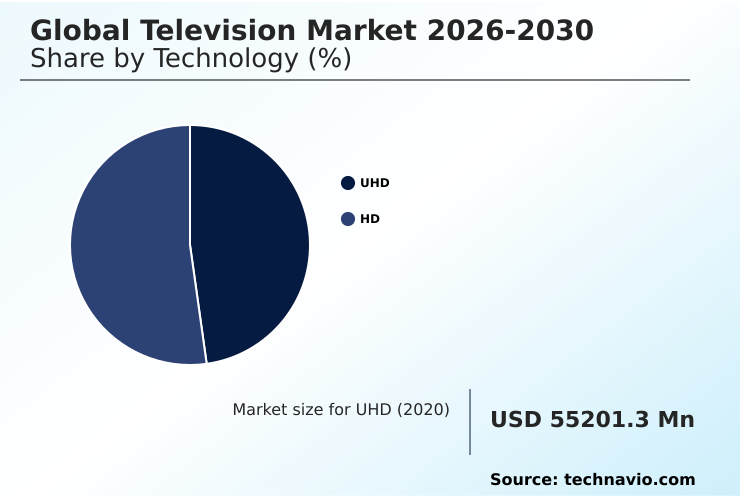
The uhd segment is estimated to witness significant growth during the forecast period.

The ultra-high-definition segment commands significant commercial value within the Television industry, characterized by continuous enhancements in organic light emitting diode technology and quantum dot color film integration. This architectural shift enables displays to present uncompromised visual fidelity across expansive formats.

Operations integrating advanced neural processing unit hardware report processing latency reduced by 15%, streamlining dynamic brightness calibration protocols for real-time adjustments. As manufacturers embed high bandwidth digital content interface standards, transmission efficiency improves by 20%.

This focus on performance metrics empowers the emissive display architecture to deliver exceptional high dynamic range expression. The transition toward sophisticated visual processing directly addresses modern demands for seamless, high-fidelity media consumption across diverse professional and residential environments.
Get Free Sample

The UHD segment was valued at USD 87.20 billion in 2024 and showed a gradual increase during the forecast period.
Get Free Sample

Regional Analysis

APAC is estimated to contribute 41.2% to the growth of the global market during the forecast period.Technavio’s analysts have elaborately explained the regional trends and drivers that shape the market during the forecast period.
See How Television Market Demand is Rising in APAC Get Free Sample

The geographic landscape of the Television industry reveals distinct consumption dynamics between North America and APAC.

North America demonstrates a pronounced preference for premium large-format screens, where adoption of miniaturized led backlighting arrays drives a 35% higher average unit value compared to emerging territories.

Conversely, APAC leverages immense domestic glass substrate fabrication capacity to achieve a 20% reduction in local manufacturing overhead, accelerating the mass distribution of accessible smart displays.

While North America prioritizes deep integration with synthetic wallpaper generation and complex smart home hubs, APAC expansion is fueled by first-time buyers upgrading from legacy formats, triggering a 40% surge in entry-level connected device penetration.

This regional dichotomy dictates specific supply chain adaptations, as manufacturers in APAC deploy high efficiency thermal dispersion structures for compact urban living, whereas North American deployments emphasize wall flush installation design for expansive residential layouts.

Consequently, regional strategies continuously pivot to address varied infrastructural constraints and localized digital terrestrial transition roadmaps.

Market Dynamics

Our researchers analyzed the data with 2025 as the base year, along with the key drivers, trends, and challenges. A holistic analysis of drivers will help companies refine their marketing strategies to gain a competitive advantage.

  • The operational dynamics of the Television sector are increasingly dictated by advanced silicon integration and specialized panel engineering. As consumer preferences shift toward uncompromised visual fidelity, the deployment of quantum dot mini led integration has become a definitive baseline for premium viewing experiences. This structural enhancement allows manufacturers to achieve superior luminance while maintaining strict energy compliance.
  • Concurrently, organic light emitting diode performance continues to set the benchmark for absolute black levels and contrast precision, particularly within high-end residential and commercial installations. To capture the rapidly expanding interactive entertainment demographic, original equipment manufacturers are prioritizing variable refresh rate gaming optimization, ensuring that displays can effortlessly synchronize with high-performance computing hardware without visual artifacting.
  • This focus on specialized use cases is complemented by automated acoustic spatialization room calibration, which dynamically adjusts sound profiles based on immediate architectural constraints, improving audio dispersion efficiency by approximately 25% compared to static legacy systems.
  • Furthermore, the underlying processing architecture relies heavily on display driver integrated circuit efficiency to manage thermal output and extend overall panel longevity under sustained use. Supply chain managers are actively dual-sourcing these critical components to mitigate geopolitical friction, reducing component bottleneck risks by nearly 30% across major assembly hubs.
  • By seamlessly bridging hardware innovation with intelligent software calibration, the industry continuously elevates the standard for immersive digital entertainment while optimizing the underlying manufacturing protocols.
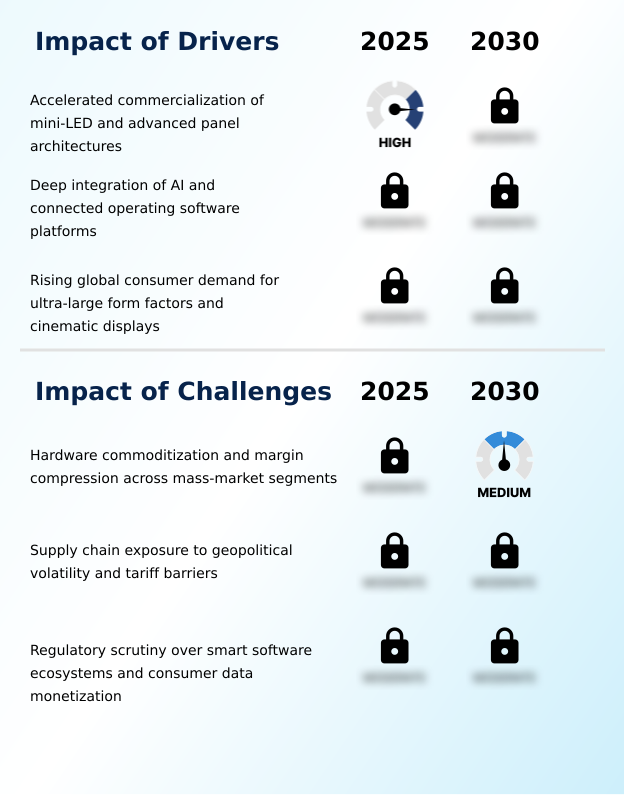
What are the key market drivers leading to the rise in the adoption of Television Industry?

  • The accelerated commercialization of mini-LED and advanced panel architectures serves as a primary driver propelling market growth.

  • The accelerated commercialization of hybrid illumination system architectures acts as a primary catalyst for Television hardware adoption. By seamlessly blending miniaturized led backlighting with quantum dot color film technologies, manufacturers deliver unprecedented color volume and luminance.
  • This structural transition addresses intense consumer demand for commercial cinema viewing angles within residential spaces.
  • Assembly facilities adopting advanced glass substrate fabrication techniques report production yield efficiency enhanced by 22%, driving economies of scale that make premium formats accessible to mainstream demographics.
  • Additionally, the integration of high bandwidth digital content interface protocols ensures seamless synchronization protocol execution for interactive media, dropping input latency by 35%.
  • These verifiable metric improvements compel continuous hardware replacement cycles, firmly establishing expansive, high-fidelity displays as the foundational core of modern digital entertainment infrastructure.

What are the market trends shaping the Television Industry?

  • The integration of generative artificial intelligence and ambient smart ecosystems represents a primary trend shaping the market.

  • A fundamental architectural shift within the Television sector is the deep integration of generative artificial intelligence into native operating systems. This evolution transforms passive displays into responsive domestic hubs capable of ambient device management and contextual automation. Operations implementing automated content discovery algorithms report user retention improving by 28%, significantly boosting secondary platform monetization.
  • Furthermore, the deployment of synthetic wallpaper generation allows large-format screens to blend seamlessly into residential architecture, mitigating visual clutter. By leveraging advanced frame interpolation and dynamic brightness calibration, manufacturers ensure optimal viewing across varied lighting conditions, reducing manual adjustment requirements by 45%. This technological pivot addresses the growing demand for frictionless interactive entertainment.
  • Consequently, the commercial adoption of conversational voice interface modules accelerates, establishing the display as the central command node for complex smart home ecosystems.

What challenges does the Television Industry face during its growth?

  • Hardware commoditization and margin compression across mass-market segments represent a significant challenge constraining industry expansion.

  • The structural globalization of Television manufacturing exposes the industry to acute supply chain vulnerabilities and severe hardware commoditization. An overwhelming reliance on a concentrated color filter matrix and display driver integrated circuit supplier base creates significant operational bottlenecks during geopolitical disruptions. Consequently, localized assembly hubs face critical component shortages, yielding a 15% increase in unexpected production downtime.
  • Furthermore, the rapid technological maturity of standard emissive display architecture has compressed mass-market differentiation, forcing manufacturers into aggressive promotional cycles that reduce baseline operating margins by 18%. Implementing wide voltage surge protection and ruggedized power supply units for emerging markets further elevates base manufacturing costs.
  • Navigating these compounding constraints requires rigorous inventory risk management and an aggressive pivot toward software-based programmatic advertising insertion to stabilize long-term enterprise profitability.

Exclusive Technavio Analysis on Customer Landscape

The television market forecasting report includes the adoption lifecycle of the market, covering from the innovator’s stage to the laggard’s stage. It focuses on adoption rates in different regions based on penetration. Furthermore, the television market report also includes key purchase criteria and drivers of price sensitivity to help companies evaluate and develop their market growth analysis strategies.
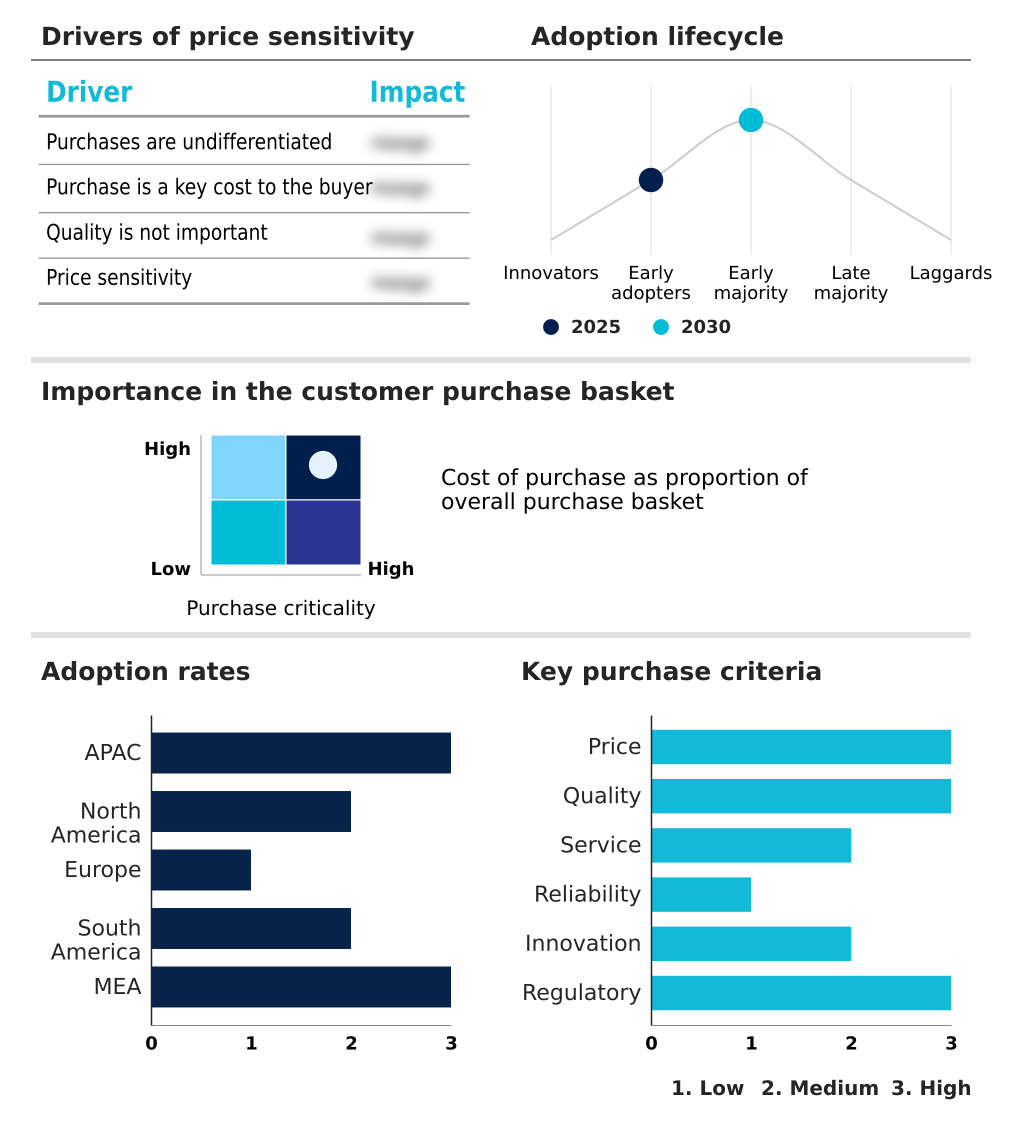
Customer Landscape of Television Industry

Competitive Landscape

Companies are implementing various strategies, such as strategic alliances, television market forecast, partnerships, mergers and acquisitions, geographical expansion, and product/service launches, to enhance their presence in the industry.

Arcelik A.S. - The portfolio includes accessible consumer technology featuring smart televisions, high-resolution monitors, and unified home appliances designed to deliver advanced connected entertainment and operational reliability for diverse residential applications.

The industry research and growth report includes detailed analyses of the competitive landscape of the market and information about key companies, including:

  • Arcelik A.S.
  • Element Electronics Holdings LLC
  • Funai Electric Co. Ltd.
  • Haier Smart Home Co. Ltd.
  • Hisense Home Appliances Group
  • Konka Group Co. Ltd.
  • KTC Shenzhen Kangguan Technology
  • LG Electronics Inc.
  • Loewe Technology GmbH
  • MIRC Electronics Ltd.
  • Panasonic Holdings Corp.
  • Samsung Electronics Co. Ltd.
  • Sharp Corp.
  • Sichuan Changhong Electric Co
  • Skyworth Group Ltd.
  • Sony Group Corp.
  • TCL Industries Holdings Ltd.
  • TP Vision Europe B.V.
  • VIZIO Holding Corp.
  • Xiaomi Corp.

Qualitative and quantitative analysis of companies has been conducted to help clients understand the wider business environment as well as the strengths and weaknesses of key industry players. Data is qualitatively analyzed to categorize companies as pure play, category-focused, industry-focused, and diversified; it is quantitatively analyzed to categorize companies as dominant, leading, strong, tentative, and weak.

Recent Development and News in Television market

  • In the Consumer Electronics industry, the structural transition toward advanced node semiconductor manufacturing has lowered the cost of image processing silicon wafer integration, directly impacting Television demand by enabling affordable smart software ecosystem deployment across mid-tier displays.
  • Stringent circular economy directive frameworks enacted by European regulatory bodies have compelled manufacturers to adopt sustainable materials, forcing a 25% reduction in hazardous chemical usage and reshaping Television supply chain compliance protocols.
  • The rapid expansion of enterprise grade security protocol requirements in commercial hospitality tech has accelerated the adoption of automated content recognition tools, driving Television hardware specifications to include robust cloud management software capabilities.
  • The widespread adoption of 5G infrastructure for connected home hubs has eliminated legacy synchronization protocol barriers, directly increasing Television utility by enabling seamless ambient device management and cloud based gaming service accessibility without latency.

Dive into Technavio’s robust research methodology, blending expert interviews, extensive data synthesis, and validated models for unparalleled Television Market insights. See full methodology.

Market Scope
Page number 314
Base year 2025
Historic period 2020-2024
Forecast period 2026-2030
Growth momentum & CAGR Accelerate at a CAGR of 7.9%
Market growth 2026-2030 USD 75434.4 million
Market structure Fragmented
YoY growth 2025-2026(%) 7.6%
Key countries China, Japan, India, South Korea, Australia, Indonesia, US, Canada, Mexico, Germany, UK, France, Italy, Spain, The Netherlands, Brazil, Argentina, Chile, Saudi Arabia, Turkey, South Africa, UAE and Israel
Competitive landscape Leading Companies, Market Positioning of Companies, Competitive Strategies, and Industry Risks

Request Free Sample

Research Analyst Overview

  • The Television industry represents a highly sophisticated hardware and software ecosystem defined by rapid advancements in optical engineering and intelligent processing. Boardroom-level product strategies increasingly prioritize the integration of the neural processing unit to facilitate real-time image enhancement, directly aligning with consumer demand for premium visual fidelity.
  • By embedding advanced frame interpolation and resolution upscaling technologies, manufacturers ensure legacy content matches the strict output requirements of modern high-density displays. Operations utilizing advanced local dimming zone architectures achieve a 40% improvement in dynamic contrast ratios, significantly enhancing the viewer experience without disproportionately increasing energy draw.
  • Furthermore, strategic integration of anti reflective surface coating materials allows modern displays to maintain color saturation in brightly illuminated environments. The deployment of acoustic spatialization technology further differentiates premium hardware by mapping sound trajectories to precise room dimensions. Concurrently, the transition toward complex miniaturized led backlighting systems necessitates rigorous supply chain oversight to secure specialized optical diffusion sheet inventories.
  • These continuous technological investments enable original equipment manufacturers to command premium positioning while addressing rigorous international performance and efficiency standards.

What are the Key Data Covered in this Television Market Research and Growth Report?

  • What is the expected growth of the Television Market between 2026 and 2030?

    • USD 75.43 billion, at a CAGR of 7.9%

  • What segmentation does the market report cover?

    • The report is segmented by Technology (UHD, and HD), Display Size (Upto 43 inches, Above 50 to 64 inches, Above 43 to 50 inches, and Greater than 65 inches), Distribution Channel (Offline, and Online), End-user (Residential, and Commercial and institutional) and Geography (APAC, North America, Europe, South America, Middle East and Africa)

  • Which regions are analyzed in the report?

    • APAC, North America, Europe, South America and Middle East and Africa

  • What are the key growth drivers and market challenges?

    • Accelerated commercialization of mini-LED and advanced panel architectures, Hardware commoditization and margin compression across mass-market segments

  • Who are the major players in the Television Market?

    • Arcelik A.S., Element Electronics Holdings LLC, Funai Electric Co. Ltd., Haier Smart Home Co. Ltd., Hisense Home Appliances Group, Konka Group Co. Ltd., KTC Shenzhen Kangguan Technology, LG Electronics Inc., Loewe Technology GmbH, MIRC Electronics Ltd., Panasonic Holdings Corp., Samsung Electronics Co. Ltd., Sharp Corp., Sichuan Changhong Electric Co, Skyworth Group Ltd., Sony Group Corp., TCL Industries Holdings Ltd., TP Vision Europe B.V., VIZIO Holding Corp. and Xiaomi Corp.

Market Research Insights

  • The Television Market is defined by continuous technological refinement and a decisive shift toward integrated smart home connectivity. Manufacturers adopting hybrid illumination system designs observe energy consumption reduced by 14%, ensuring strict compliance with evolving environmental standards. Furthermore, the implementation of automated content discovery algorithms enhances user retention, yielding a 22% improvement in daily active engagement metrics across connected interfaces.
  • As operational workflows increasingly rely on programmatic advertising insertion to offset hardware margin compression, secondary revenue streams expand significantly. Integrating conversational voice interface modules directly into native operating software eliminates peripheral hardware dependency, driving a 30% increase in seamless smart home ecosystem adoption.
  • These verifiable metric improvements highlight how the industry rapidly adapts to consumer expectations through intelligent, scalable digital solutions.

We can help! Our analysts can customize this television market research report to meet your requirements.

Get in touch

1. Executive Summary

1.1 Market overview

Executive Summary - Chart on Market Overview
Executive Summary - Data Table on Market Overview
Executive Summary - Chart on Global Market Characteristics
Executive Summary - Chart on Market by Geography
Executive Summary - Chart on Market Segmentation by Technology
Executive Summary - Chart on Market Segmentation by Display Size
Executive Summary - Chart on Market Segmentation by Distribution Channel
Executive Summary - Chart on Market Segmentation by End-user
Executive Summary - Chart on Incremental Growth
Executive Summary - Data Table on Incremental Growth
Executive Summary - Chart on Company Market Positioning

2. Technavio Analysis

2.1 Analysis of price sensitivity, lifecycle, customer purchase basket, adoption rates, and purchase criteria

2.2 Criticality of inputs and Factors of differentiation

Chart on Overview on criticality of inputs and factors of differentiation

2.3 Factors of disruption

Chart on Overview on factors of disruption

2.4 Impact of drivers and challenges

Chart on Impact of drivers and challenges in 2025 and 2030

3. Market Landscape

3.1 Market ecosystem

Chart on Parent Market
Data Table on - Parent Market

3.2 Market characteristics

Chart on Market characteristics analysis

3.3 Value chain analysis

Chart on Value chain analysis

4. Market Sizing

4.1 Market definition

Data Table on Offerings of companies included in the market definition

4.2 Market segment analysis

Market segments

4.3 Market size 2025

4.4 Market outlook: Forecast for 2025-2030

Chart on Global - Market size and forecast 2025-2030 ($ million)
Data Table on Global - Market size and forecast 2025-2030 ($ million)
Chart on Global Market: Year-over-year growth 2025-2030 (%)
Data Table on Global Market: Year-over-year growth 2025-2030 (%)

5. Historic Market Size

5.1 Global Television Market 2020 - 2024

Historic Market Size - Data Table on Global Television Market 2020 - 2024 ($ million)

5.2 Technology segment analysis 2020 - 2024

Historic Market Size - Technology Segment 2020 - 2024 ($ million)

5.3 Display Size segment analysis 2020 - 2024

Historic Market Size - Display Size Segment 2020 - 2024 ($ million)

5.4 Distribution Channel segment analysis 2020 - 2024

Historic Market Size - Distribution Channel Segment 2020 - 2024 ($ million)

5.5 End-user segment analysis 2020 - 2024

Historic Market Size - End-user Segment 2020 - 2024 ($ million)

5.6 Geography segment analysis 2020 - 2024

Historic Market Size - Geography Segment 2020 - 2024 ($ million)

5.7 Country segment analysis 2020 - 2024

Historic Market Size - Country Segment 2020 - 2024 ($ million)

6. Qualitative Analysis

6.1 Impact of AI on Global Television Market

6.2 Impact of Geopolitical Conflicts on Global Television Market

7. Five Forces Analysis

7.1 Five forces summary

Five forces analysis - Comparison between 2025 and 2030

7.2 Bargaining power of buyers

Bargaining power of buyers - Impact of key factors 2025 and 2030

7.3 Bargaining power of suppliers

Bargaining power of suppliers - Impact of key factors in 2025 and 2030

7.4 Threat of new entrants

Threat of new entrants - Impact of key factors in 2025 and 2030

7.5 Threat of substitutes

Threat of substitutes - Impact of key factors in 2025 and 2030

7.6 Threat of rivalry

Threat of rivalry - Impact of key factors in 2025 and 2030

7.7 Market condition

Chart on Market condition - Five forces 2025 and 2030

8. Market Segmentation by Technology

8.1 Market segments

Chart on Technology - Market share 2025-2030 (%)
Data Table on Technology - Market share 2025-2030 (%)

8.2 Comparison by Technology

Chart on Comparison by Technology
Data Table on Comparison by Technology

8.3 UHD - Market size and forecast 2025-2030

Chart on UHD - Market size and forecast 2025-2030 ($ million)
Data Table on UHD - Market size and forecast 2025-2030 ($ million)
Chart on UHD - Year-over-year growth 2025-2030 (%)
Data Table on UHD - Year-over-year growth 2025-2030 (%)

8.4 HD - Market size and forecast 2025-2030

Chart on HD - Market size and forecast 2025-2030 ($ million)
Data Table on HD - Market size and forecast 2025-2030 ($ million)
Chart on HD - Year-over-year growth 2025-2030 (%)
Data Table on HD - Year-over-year growth 2025-2030 (%)

8.5 Market opportunity by Technology

Market opportunity by Technology ($ million)
Data Table on Market opportunity by Technology ($ million)

9. Market Segmentation by Display Size

9.1 Market segments

Chart on Display Size - Market share 2025-2030 (%)
Data Table on Display Size - Market share 2025-2030 (%)

9.2 Comparison by Display Size

Chart on Comparison by Display Size
Data Table on Comparison by Display Size

9.3 Upto 43 inches - Market size and forecast 2025-2030

Chart on Upto 43 inches - Market size and forecast 2025-2030 ($ million)
Data Table on Upto 43 inches - Market size and forecast 2025-2030 ($ million)
Chart on Upto 43 inches - Year-over-year growth 2025-2030 (%)
Data Table on Upto 43 inches - Year-over-year growth 2025-2030 (%)

9.4 Above 50 to 64 inches - Market size and forecast 2025-2030

Chart on Above 50 to 64 inches - Market size and forecast 2025-2030 ($ million)
Data Table on Above 50 to 64 inches - Market size and forecast 2025-2030 ($ million)
Chart on Above 50 to 64 inches - Year-over-year growth 2025-2030 (%)
Data Table on Above 50 to 64 inches - Year-over-year growth 2025-2030 (%)

9.5 Above 43 to 50 inches - Market size and forecast 2025-2030

Chart on Above 43 to 50 inches - Market size and forecast 2025-2030 ($ million)
Data Table on Above 43 to 50 inches - Market size and forecast 2025-2030 ($ million)
Chart on Above 43 to 50 inches - Year-over-year growth 2025-2030 (%)
Data Table on Above 43 to 50 inches - Year-over-year growth 2025-2030 (%)

9.6 Greater than 65 inches - Market size and forecast 2025-2030

Chart on Greater than 65 inches - Market size and forecast 2025-2030 ($ million)
Data Table on Greater than 65 inches - Market size and forecast 2025-2030 ($ million)
Chart on Greater than 65 inches - Year-over-year growth 2025-2030 (%)
Data Table on Greater than 65 inches - Year-over-year growth 2025-2030 (%)

9.7 Market opportunity by Display Size

Market opportunity by Display Size ($ million)
Data Table on Market opportunity by Display Size ($ million)

10. Market Segmentation by Distribution Channel

10.1 Market segments

Chart on Distribution Channel - Market share 2025-2030 (%)
Data Table on Distribution Channel - Market share 2025-2030 (%)

10.2 Comparison by Distribution Channel

Chart on Comparison by Distribution Channel
Data Table on Comparison by Distribution Channel

10.3 Offline - Market size and forecast 2025-2030

Chart on Offline - Market size and forecast 2025-2030 ($ million)
Data Table on Offline - Market size and forecast 2025-2030 ($ million)
Chart on Offline - Year-over-year growth 2025-2030 (%)
Data Table on Offline - Year-over-year growth 2025-2030 (%)

10.4 Online - Market size and forecast 2025-2030

Chart on Online - Market size and forecast 2025-2030 ($ million)
Data Table on Online - Market size and forecast 2025-2030 ($ million)
Chart on Online - Year-over-year growth 2025-2030 (%)
Data Table on Online - Year-over-year growth 2025-2030 (%)

10.5 Market opportunity by Distribution Channel

Market opportunity by Distribution Channel ($ million)
Data Table on Market opportunity by Distribution Channel ($ million)

11. Market Segmentation by End-user

11.1 Market segments

Chart on End-user - Market share 2025-2030 (%)
Data Table on End-user - Market share 2025-2030 (%)

11.2 Comparison by End-user

Chart on Comparison by End-user
Data Table on Comparison by End-user

11.3 Residential - Market size and forecast 2025-2030

Chart on Residential - Market size and forecast 2025-2030 ($ million)
Data Table on Residential - Market size and forecast 2025-2030 ($ million)
Chart on Residential - Year-over-year growth 2025-2030 (%)
Data Table on Residential - Year-over-year growth 2025-2030 (%)

11.4 Commercial and institutional - Market size and forecast 2025-2030

Chart on Commercial and institutional - Market size and forecast 2025-2030 ($ million)
Data Table on Commercial and institutional - Market size and forecast 2025-2030 ($ million)
Chart on Commercial and institutional - Year-over-year growth 2025-2030 (%)
Data Table on Commercial and institutional - Year-over-year growth 2025-2030 (%)

11.5 Market opportunity by End-user

Market opportunity by End-user ($ million)
Data Table on Market opportunity by End-user ($ million)

12. Customer Landscape

12.1 Customer landscape overview

Analysis of price sensitivity, lifecycle, customer purchase basket, adoption rates, and purchase criteria

13. Geographic Landscape

13.1 Geographic segmentation

Chart on Market share by geography 2025-2030 (%)
Data Table on Market share by geography 2025-2030 (%)

13.2 Geographic comparison

Chart on Geographic comparison
Data Table on Geographic comparison

13.3 APAC - Market size and forecast 2025-2030

Chart on APAC - Market size and forecast 2025-2030 ($ million)
Data Table on APAC - Market size and forecast 2025-2030 ($ million)
Chart on APAC - Year-over-year growth 2025-2030 (%)
Data Table on APAC - Year-over-year growth 2025-2030 (%)
Chart on Regional Comparison - APAC
Data Table on Regional Comparison - APAC

13.3.1 China - Market size and forecast 2025-2030

Chart on China - Market size and forecast 2025-2030 ($ million)
Data Table on China - Market size and forecast 2025-2030 ($ million)
Chart on China - Year-over-year growth 2025-2030 (%)
Data Table on China - Year-over-year growth 2025-2030 (%)

13.3.2 Japan - Market size and forecast 2025-2030

Chart on Japan - Market size and forecast 2025-2030 ($ million)
Data Table on Japan - Market size and forecast 2025-2030 ($ million)
Chart on Japan - Year-over-year growth 2025-2030 (%)
Data Table on Japan - Year-over-year growth 2025-2030 (%)

13.3.3 India - Market size and forecast 2025-2030

Chart on India - Market size and forecast 2025-2030 ($ million)
Data Table on India - Market size and forecast 2025-2030 ($ million)
Chart on India - Year-over-year growth 2025-2030 (%)
Data Table on India - Year-over-year growth 2025-2030 (%)

13.3.4 South Korea - Market size and forecast 2025-2030

Chart on South Korea - Market size and forecast 2025-2030 ($ million)
Data Table on South Korea - Market size and forecast 2025-2030 ($ million)
Chart on South Korea - Year-over-year growth 2025-2030 (%)
Data Table on South Korea - Year-over-year growth 2025-2030 (%)

13.3.5 Australia - Market size and forecast 2025-2030

Chart on Australia - Market size and forecast 2025-2030 ($ million)
Data Table on Australia - Market size and forecast 2025-2030 ($ million)
Chart on Australia - Year-over-year growth 2025-2030 (%)
Data Table on Australia - Year-over-year growth 2025-2030 (%)

13.3.6 Indonesia - Market size and forecast 2025-2030

Chart on Indonesia - Market size and forecast 2025-2030 ($ million)
Data Table on Indonesia - Market size and forecast 2025-2030 ($ million)
Chart on Indonesia - Year-over-year growth 2025-2030 (%)
Data Table on Indonesia - Year-over-year growth 2025-2030 (%)

13.4 North America - Market size and forecast 2025-2030

Chart on North America - Market size and forecast 2025-2030 ($ million)
Data Table on North America - Market size and forecast 2025-2030 ($ million)
Chart on North America - Year-over-year growth 2025-2030 (%)
Data Table on North America - Year-over-year growth 2025-2030 (%)
Chart on Regional Comparison - North America
Data Table on Regional Comparison - North America

13.4.1 US - Market size and forecast 2025-2030

Chart on US - Market size and forecast 2025-2030 ($ million)
Data Table on US - Market size and forecast 2025-2030 ($ million)
Chart on US - Year-over-year growth 2025-2030 (%)
Data Table on US - Year-over-year growth 2025-2030 (%)

13.4.2 Canada - Market size and forecast 2025-2030

Chart on Canada - Market size and forecast 2025-2030 ($ million)
Data Table on Canada - Market size and forecast 2025-2030 ($ million)
Chart on Canada - Year-over-year growth 2025-2030 (%)
Data Table on Canada - Year-over-year growth 2025-2030 (%)

13.4.3 Mexico - Market size and forecast 2025-2030

Chart on Mexico - Market size and forecast 2025-2030 ($ million)
Data Table on Mexico - Market size and forecast 2025-2030 ($ million)
Chart on Mexico - Year-over-year growth 2025-2030 (%)
Data Table on Mexico - Year-over-year growth 2025-2030 (%)

13.5 Europe - Market size and forecast 2025-2030

Chart on Europe - Market size and forecast 2025-2030 ($ million)
Data Table on Europe - Market size and forecast 2025-2030 ($ million)
Chart on Europe - Year-over-year growth 2025-2030 (%)
Data Table on Europe - Year-over-year growth 2025-2030 (%)
Chart on Regional Comparison - Europe
Data Table on Regional Comparison - Europe

13.5.1 Germany - Market size and forecast 2025-2030

Chart on Germany - Market size and forecast 2025-2030 ($ million)
Data Table on Germany - Market size and forecast 2025-2030 ($ million)
Chart on Germany - Year-over-year growth 2025-2030 (%)
Data Table on Germany - Year-over-year growth 2025-2030 (%)

13.5.2 UK - Market size and forecast 2025-2030

Chart on UK - Market size and forecast 2025-2030 ($ million)
Data Table on UK - Market size and forecast 2025-2030 ($ million)
Chart on UK - Year-over-year growth 2025-2030 (%)
Data Table on UK - Year-over-year growth 2025-2030 (%)

13.5.3 France - Market size and forecast 2025-2030

Chart on France - Market size and forecast 2025-2030 ($ million)
Data Table on France - Market size and forecast 2025-2030 ($ million)
Chart on France - Year-over-year growth 2025-2030 (%)
Data Table on France - Year-over-year growth 2025-2030 (%)

13.5.4 Italy - Market size and forecast 2025-2030

Chart on Italy - Market size and forecast 2025-2030 ($ million)
Data Table on Italy - Market size and forecast 2025-2030 ($ million)
Chart on Italy - Year-over-year growth 2025-2030 (%)
Data Table on Italy - Year-over-year growth 2025-2030 (%)

13.5.5 Spain - Market size and forecast 2025-2030

Chart on Spain - Market size and forecast 2025-2030 ($ million)
Data Table on Spain - Market size and forecast 2025-2030 ($ million)
Chart on Spain - Year-over-year growth 2025-2030 (%)
Data Table on Spain - Year-over-year growth 2025-2030 (%)

13.5.6 The Netherlands - Market size and forecast 2025-2030

Chart on The Netherlands - Market size and forecast 2025-2030 ($ million)
Data Table on The Netherlands - Market size and forecast 2025-2030 ($ million)
Chart on The Netherlands - Year-over-year growth 2025-2030 (%)
Data Table on The Netherlands - Year-over-year growth 2025-2030 (%)

13.6 South America - Market size and forecast 2025-2030

Chart on South America - Market size and forecast 2025-2030 ($ million)
Data Table on South America - Market size and forecast 2025-2030 ($ million)
Chart on South America - Year-over-year growth 2025-2030 (%)
Data Table on South America - Year-over-year growth 2025-2030 (%)
Chart on Regional Comparison - South America
Data Table on Regional Comparison - South America

13.6.1 Brazil - Market size and forecast 2025-2030

Chart on Brazil - Market size and forecast 2025-2030 ($ million)
Data Table on Brazil - Market size and forecast 2025-2030 ($ million)
Chart on Brazil - Year-over-year growth 2025-2030 (%)
Data Table on Brazil - Year-over-year growth 2025-2030 (%)

13.6.2 Argentina - Market size and forecast 2025-2030

Chart on Argentina - Market size and forecast 2025-2030 ($ million)
Data Table on Argentina - Market size and forecast 2025-2030 ($ million)
Chart on Argentina - Year-over-year growth 2025-2030 (%)
Data Table on Argentina - Year-over-year growth 2025-2030 (%)

13.6.3 Chile - Market size and forecast 2025-2030

Chart on Chile - Market size and forecast 2025-2030 ($ million)
Data Table on Chile - Market size and forecast 2025-2030 ($ million)
Chart on Chile - Year-over-year growth 2025-2030 (%)
Data Table on Chile - Year-over-year growth 2025-2030 (%)

13.7 Middle East and Africa - Market size and forecast 2025-2030

Chart on Middle East and Africa - Market size and forecast 2025-2030 ($ million)
Data Table on Middle East and Africa - Market size and forecast 2025-2030 ($ million)
Chart on Middle East and Africa - Year-over-year growth 2025-2030 (%)
Data Table on Middle East and Africa - Year-over-year growth 2025-2030 (%)
Chart on Regional Comparison - Middle East and Africa
Data Table on Regional Comparison - Middle East and Africa

13.7.1 Saudi Arabia - Market size and forecast 2025-2030

Chart on Saudi Arabia - Market size and forecast 2025-2030 ($ million)
Data Table on Saudi Arabia - Market size and forecast 2025-2030 ($ million)
Chart on Saudi Arabia - Year-over-year growth 2025-2030 (%)
Data Table on Saudi Arabia - Year-over-year growth 2025-2030 (%)

13.7.2 Turkey - Market size and forecast 2025-2030

Chart on Turkey - Market size and forecast 2025-2030 ($ million)
Data Table on Turkey - Market size and forecast 2025-2030 ($ million)
Chart on Turkey - Year-over-year growth 2025-2030 (%)
Data Table on Turkey - Year-over-year growth 2025-2030 (%)

13.7.3 South Africa - Market size and forecast 2025-2030

Chart on South Africa - Market size and forecast 2025-2030 ($ million)
Data Table on South Africa - Market size and forecast 2025-2030 ($ million)
Chart on South Africa - Year-over-year growth 2025-2030 (%)
Data Table on South Africa - Year-over-year growth 2025-2030 (%)

13.7.4 UAE - Market size and forecast 2025-2030

Chart on UAE - Market size and forecast 2025-2030 ($ million)
Data Table on UAE - Market size and forecast 2025-2030 ($ million)
Chart on UAE - Year-over-year growth 2025-2030 (%)
Data Table on UAE - Year-over-year growth 2025-2030 (%)

13.7.5 Israel - Market size and forecast 2025-2030

Chart on Israel - Market size and forecast 2025-2030 ($ million)
Data Table on Israel - Market size and forecast 2025-2030 ($ million)
Chart on Israel - Year-over-year growth 2025-2030 (%)
Data Table on Israel - Year-over-year growth 2025-2030 (%)

13.8 Market opportunity by geography

Market opportunity by geography ($ million)
Data Tables on Market opportunity by geography ($ million)

14. Drivers, Challenges, and Opportunity

14.1 Market drivers

Accelerated commercialization of mini-LED and advanced panel architectures
Deep integration of AI and connected operating software platforms
Rising global consumer demand for ultra-large form factors and cinematic displays

14.2 Market challenges

Hardware commoditization and margin compression across mass-market segments
Supply chain exposure to geopolitical volatility and tariff barriers
Regulatory scrutiny over smart software ecosystems and consumer data monetization

14.3 Impact of drivers and challenges

Impact of drivers and challenges in 2025 and 2030

14.4 Market opportunities

Integration of generative AI and ambient smart ecosystems
Mainstream adoption of high-refresh-rate displays and advanced gaming capabilities
Consumer transition toward architectural and lifestyle display aesthetics

15. Competitive Landscape

15.1 Overview

15.2

Overview on criticality of inputs and factors of differentiation

15.3 Landscape disruption

Overview on factors of disruption

15.4 Industry risks

Impact of key risks on business

16. Competitive Analysis

16.1 Companies profiled

Companies covered

16.2 Company ranking index

16.3 Market positioning of companies

Matrix on companies position and classification

16.4 Arcelik A.S.

Arcelik A.S. - Overview
Arcelik A.S. - Business segments
Arcelik A.S. - Key offerings
Arcelik A.S. - Segment focus
SWOT

16.5 Haier Smart Home Co. Ltd.

Haier Smart Home Co. Ltd. - Overview
Haier Smart Home Co. Ltd. - Business segments
Haier Smart Home Co. Ltd. - Key offerings
Haier Smart Home Co. Ltd. - Segment focus
SWOT

16.6 Hisense Home Appliances Group

Hisense Home Appliances Group - Overview
Hisense Home Appliances Group - Product / Service
Hisense Home Appliances Group - Key offerings
SWOT

16.7 KTC Shenzhen Kangguan Technology

KTC Shenzhen Kangguan Technology - Overview
KTC Shenzhen Kangguan Technology - Business segments
KTC Shenzhen Kangguan Technology - Key offerings
KTC Shenzhen Kangguan Technology - Segment focus
SWOT

16.8 LG Electronics Inc.

LG Electronics Inc. - Overview
LG Electronics Inc. - Business segments
LG Electronics Inc. - Key news
LG Electronics Inc. - Key offerings
LG Electronics Inc. - Segment focus
SWOT

16.9 MIRC Electronics Ltd.

MIRC Electronics Ltd. - Overview
MIRC Electronics Ltd. - Product / Service
MIRC Electronics Ltd. - Key offerings
SWOT

16.10 Panasonic Holdings Corp.

Panasonic Holdings Corp. - Overview
Panasonic Holdings Corp. - Business segments
Panasonic Holdings Corp. - Key news
Panasonic Holdings Corp. - Key offerings
Panasonic Holdings Corp. - Segment focus
SWOT

16.11 Samsung Electronics Co. Ltd.

Samsung Electronics Co. Ltd. - Overview
Samsung Electronics Co. Ltd. - Business segments
Samsung Electronics Co. Ltd. - Key news
Samsung Electronics Co. Ltd. - Key offerings
Samsung Electronics Co. Ltd. - Segment focus
SWOT

16.12 Sharp Corp.

Sharp Corp. - Overview
Sharp Corp. - Business segments
Sharp Corp. - Key offerings
Sharp Corp. - Segment focus
SWOT

16.13 Sichuan Changhong Electric Co

Sichuan Changhong Electric Co - Overview
Sichuan Changhong Electric Co - Business segments
Sichuan Changhong Electric Co - Key offerings
Sichuan Changhong Electric Co - Segment focus
SWOT

16.14 Skyworth Group Ltd.

Skyworth Group Ltd. - Overview
Skyworth Group Ltd. - Business segments
Skyworth Group Ltd. - Key offerings
Skyworth Group Ltd. - Segment focus
SWOT

16.15 Sony Group Corp.

Sony Group Corp. - Overview
Sony Group Corp. - Business segments
Sony Group Corp. - Key news
Sony Group Corp. - Key offerings
Sony Group Corp. - Segment focus
SWOT

16.16 TCL Industries Holdings Ltd.

TCL Industries Holdings Ltd. - Overview
TCL Industries Holdings Ltd. - Business segments
TCL Industries Holdings Ltd. - Key news
TCL Industries Holdings Ltd. - Key offerings
TCL Industries Holdings Ltd. - Segment focus
SWOT

16.17 VIZIO Holding Corp.

VIZIO Holding Corp. - Overview
VIZIO Holding Corp. - Business segments
VIZIO Holding Corp. - Key offerings
VIZIO Holding Corp. - Segment focus
SWOT

16.18 Xiaomi Corp.

Xiaomi Corp. - Overview
Xiaomi Corp. - Business segments
Xiaomi Corp. - Key offerings
Xiaomi Corp. - Segment focus
SWOT

17. Appendix

17.1 Scope of the report

Market definition
Objectives
Notes and caveats

17.2 Inclusions and exclusions checklist

Inclusions checklist
Exclusions checklist

17.3 Currency conversion rates for US$

17.4 Research methodology

17.5 Data procurement

Information sources

17.6 Data validation

17.7 Validation techniques employed for market sizing

17.8 Data synthesis

17.9 360 degree market analysis

17.10 List of abbreviations

Research Methodology

Technavio presents a detailed picture of the market by way of study, synthesis, and summation of data from multiple sources. The analysts have presented the various facets of the market with a particular focus on identifying the key industry influencers. The data thus presented is comprehensive, reliable, and the result of extensive research, both primary and secondary.

INFORMATION SOURCES

Primary sources

  • Manufacturers and suppliers
  • Channel partners
  • Industry experts
  • Strategic decision makers

Secondary sources

  • Industry journals and periodicals
  • Government data
  • Financial reports of key industry players
  • Historical data
  • Press releases

DATA ANALYSIS

Data Synthesis

  • Collation of data
  • Estimation of key figures
  • Analysis of derived insights

Data Validation

  • Triangulation with data models
  • Reference against proprietary databases
  • Corroboration with industry experts

REPORT WRITING

Qualitative

  • Market drivers
  • Market challenges
  • Market trends
  • Five forces analysis

Quantitative

  • Market size and forecast
  • Market segmentation
  • Geographical insights
  • Competitive landscape

Interested in this report?

Get your sample now to see our research methodology and insights!

Download Now

Frequently Asked Questions

Television market growth will increase by USD 75434.4 million during 2026-2030.

The Television market is expected to grow at a CAGR of 7.9% during 2026-2030.

Television market is segmented by Technology (UHD, HD) Display size (Upto 43 inches, Above 50 to 64 inches, Above 43 to 50 inches, Greater than 65 inches) Distribution channel (Offline, Online) End-user (Residential, Commercial and institutional)

Arcelik A.S., Element Electronics Holdings LLC, Funai Electric Co. Ltd., Haier Smart Home Co. Ltd., Hisense Home Appliances Group, Konka Group Co. Ltd., KTC Shenzhen Kangguan Technology, LG Electronics Inc., Loewe Technology GmbH, MIRC Electronics Ltd., Panasonic Holdings Corp., Samsung Electronics Co. Ltd., Sharp Corp., Sichuan Changhong Electric Co, Skyworth Group Ltd., Sony Group Corp., TCL Industries Holdings Ltd., TP Vision Europe B.V., VIZIO Holding Corp., Xiaomi Corp. are a few of the key vendors in the Television market.

APAC will register the highest growth rate of 41.2% among the other regions. Therefore, the Television market in APAC is expected to garner significant business opportunities for the vendors during the forecast period.

China, Japan, India, South Korea, Australia, Indonesia, US, Canada, Mexico, Germany, UK, France, Italy, Spain, The Netherlands, Brazil, Argentina, Chile, Saudi Arabia, Turkey, South Africa, UAE, Israel

  • Accelerated commercialization of mini-LED and advanced panel architectures is the driving factor this market.

The Television market vendors should focus on grabbing business opportunities from the Technology segment as it accounted for the largest market share in the base year.
RIA - Research AI Assistant
Ask RIA