
Sterilization Market Analysis, Size, and Forecast 2026-2030: North America (US, Canada, and Mexico), Europe (Germany, UK, and France), Asia (China, Japan, and India), South America (Brazil, Argentina, and Chile), Middle East and Africa (Saudi Arabia, UAE, and South Africa), Rest of World (ROW)

Sterilization Market Analysis, Size, and Forecast 2026-2030:
North America (US, Canada, and Mexico), Europe (Germany, UK, and France), Asia (China, Japan, and India), South America (Brazil, Argentina, and Chile), Middle East and Africa (Saudi Arabia, UAE, and South Africa), Rest of World (ROW)

Published: Nov 2026 283 Pages SKU: IRTNTR41197

Market Overview at a Glance

$5.05 B
Market Opportunity
7.7%
CAGR 2025 - 2030
32.7%
North America Growth
$4.53 B
Chemical sterilization segment 2024

Sterilization Market Size 2026-2030

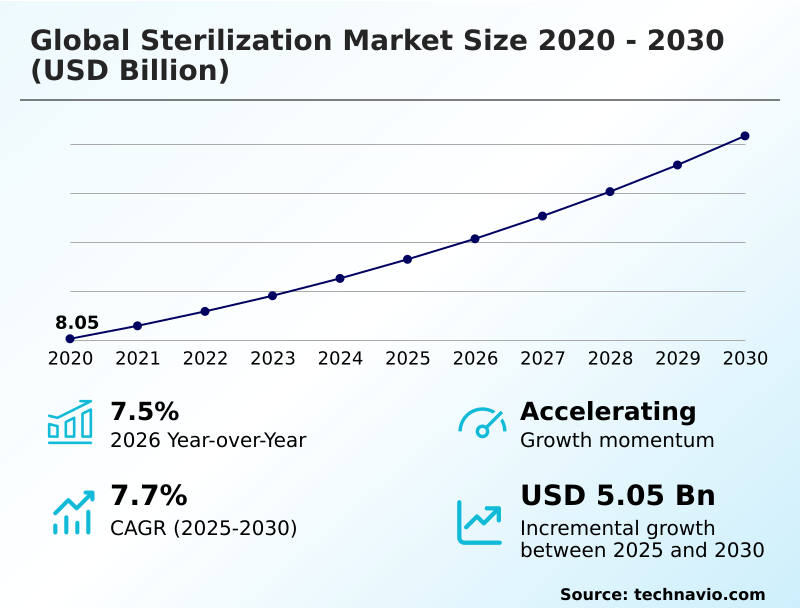
The sterilization market size is valued to increase by USD 5.05 billion, at a CAGR of 7.7% from 2025 to 2030. Surging volume of surgical procedures and infection prevention controls will drive the sterilization market.

Major Market Trends & Insights

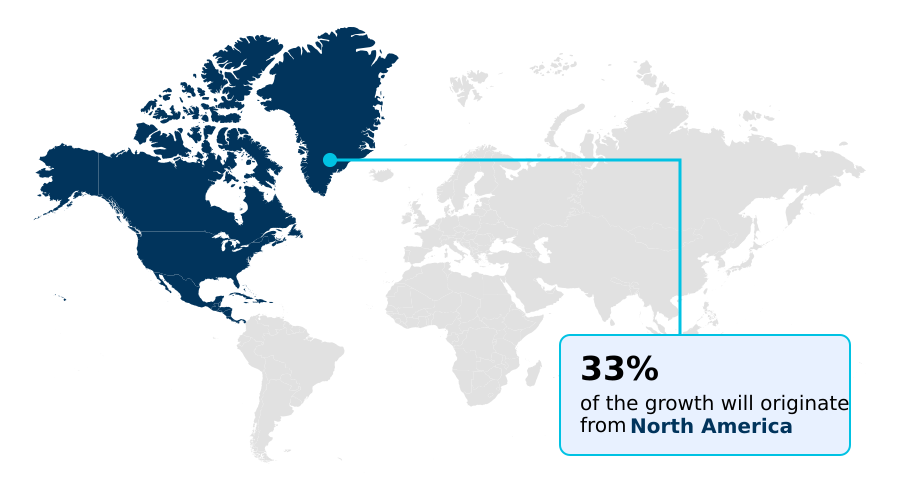
  • North America dominated the market and accounted for a 32.7% growth during the forecast period.
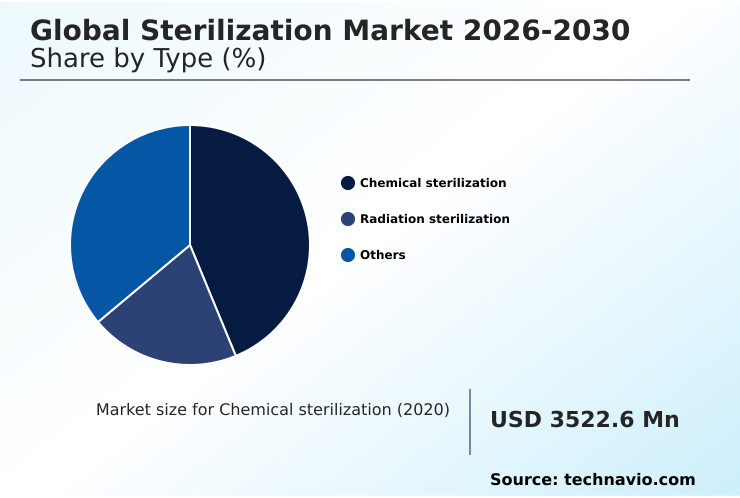
  • By Type - Chemical sterilization segment was valued at USD 4.53 billion in 2024
  • By End-user - Hospitals and clinics segment accounted for the largest market revenue share in 2024

Market Size & Forecast

  • Market Opportunities: USD 8.30 billion
  • Market Future Opportunities: USD 5.05 billion
  • CAGR from 2025 to 2030 : 7.7%

Market Summary

  • The Sterilization Market exhibits robust structural expansion driven by the critical necessity to maintain absolute microbial eradication across healthcare and pharmaceutical environments. As clinical facilities manage surging volumes of complex, minimally invasive surgical procedures, the reliance on validated central processing workflows has intensified.
  • A major driver propelling this sector is the strict enforcement of infection prevention protocols, which forces hospital networks to upgrade legacy equipment to automated, high-throughput systems. For instance, transitioning to smart tracking software has enabled supply chain optimization, improving instrument turnaround efficiency by 22 percent compared to manual paper-based logging.
  • However, the industry faces severe constraints due to tightening environmental regulations governing gaseous emissions. Retrofitting commercial facilities to capture toxic effluents requires massive capital expenditure, limiting the expansion capacity of regional contract service providers. Consequently, large device manufacturers are increasingly outsourcing their terminal processing requirements to specialized third-party vaults.
  • This strategic realignment ensures continuous supply chain resilience and regulatory compliance without incurring prohibitive internal infrastructure costs.

What will be the Size of the Sterilization Market during the forecast period?
Get Key Insights on Market Forecast (PDF) Get Free Sample

How is the Sterilization Market Segmented?

The sterilization industry research report provides comprehensive data (region-wise segment analysis), with forecasts and estimates in "USD million" for the period 2026-2030, as well as historical data from 2020-2024 for the following segments.

  • Type
    • Chemical sterilization
    • Radiation sterilization
    • Others
  • End-user
    • Hospitals and clinics
    • Pharma and medTech
    • Others
  • Delivery mode
    • Off-site sterilization
    • On-site sterilization
  • Geography
    • North America
      • US
      • Canada
      • Mexico
    • Europe
      • Germany
      • UK
      • France
      • Italy
      • Spain
      • The Netherlands
    • Asia
      • China
      • Japan
      • India
      • South Korea
      • Singapore
      • Thailand
    • Rest of World (ROW)

By Type Insights

The chemical sterilization segment is estimated to witness significant growth during the forecast period.

The chemical segment within the Sterilization ecosystem fundamentally addresses the critical need for heat-sensitive processing. Utilizing advanced gaseous agents, this modality achieves complete microbial inactivation without degrading delicate polymer housings or complex electronics.

Facilities depend heavily on standardized biological indicator media to verify the efficacy of these low-temperature modalities during routine instrument decontamination. Unlike energy-intensive gamma radiation sources, chemical methods allow localized clinics to maintain high-throughput terminal sterilization processing directly on-site.

The implementation of automated chemical tracking has improved compliance error detection by 15 percent. Consequently, healthcare providers can safely reprocess complex surgical tray sets with rapid turnaround times, reducing overall instrument inventory overhead by 12 percent.
Get Free Sample

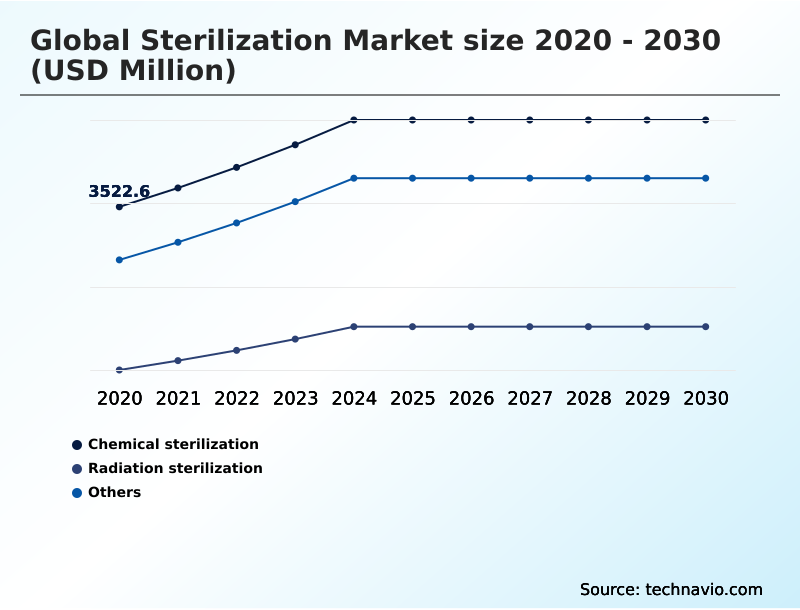
The Chemical sterilization segment was valued at USD 4.53 billion in 2024 and showed a gradual increase during the forecast period.
Get Free Sample

Regional Analysis

North America is estimated to contribute 32.7% to the growth of the global market during the forecast period.Technavio’s analysts have elaborately explained the regional trends and drivers that shape the market during the forecast period.
See How Sterilization Market Demand is Rising in North America Get Free Sample

North America dominates the Sterilization landscape due to stringent clinical compliance mandates and extensive biotechnology manufacturing infrastructure. In contrast, the Asia region demonstrates a 20 percent faster adoption rate of automated systems, driven by massive public hospital modernization projects.

European facilities prioritize sustainable operations, accelerating the deployment of closed-loop water recovery features in standard steam autoclaving units. To support the expanding manufacturing of delicate bio-resorbable polymers, specialized contract facilities in North America increasingly leverage industrial electron beam irradiation.

This high-capacity processing method guarantees absolute product safety while adhering to rigorous aseptic processing standards. Consequently, enhanced electronic load validation systems have improved regional supply chain efficiency by 12 percent, reducing shipment delays.

Market Dynamics

Our researchers analyzed the data with 2025 as the base year, along with the key drivers, trends, and challenges. A holistic analysis of drivers will help companies refine their marketing strategies to gain a competitive advantage.

  • The operational framework of the industry is actively shifting to accommodate the complex requirements of modern medical interventions and advanced drug delivery mechanisms. Centralized medical facilities are fundamentally restructuring their decontamination workflows to handle highly sophisticated, heat-sensitive robotic instruments. Consequently, there is a pronounced migration toward eco-friendly low-temperature processing modalities, which significantly reduce utility consumption and eliminate hazardous toxic residues.
  • This pivot not only addresses tightening environmental regulations but also extends the operational lifespan of delicate surgical assets. Simultaneously, industrial life sciences manufacturers require absolute sterility for sensitive biologics, making terminal sterilization for biopharmaceutical packaging a critical compliance necessity before commercial distribution.
  • As production scales, large pharmaceutical entities experience up to a 20 percent efficiency advantage when outsourcing these high-volume batches to specialized commercial processing vaults rather than maintaining internal infrastructure. In acute care environments, managing rapid instrument turnaround relies heavily on high-capacity hospital central supply departments.
  • These units increasingly integrate automated digital compliance tracking software to eliminate manual data entry errors and guarantee flawless regulatory audits. Meanwhile, a structural shift in patient care delivery has accelerated the expansion of decentralized outpatient clinical reprocessing. Smaller ambulatory hubs prioritize compact, rapid-cycle systems to maintain stringent infection control standards without requiring extensive physical footprints.
  • Together, these adaptive strategies ensure resilient supply chains and optimized operational budgets across both vast industrial networks and localized clinical centers.
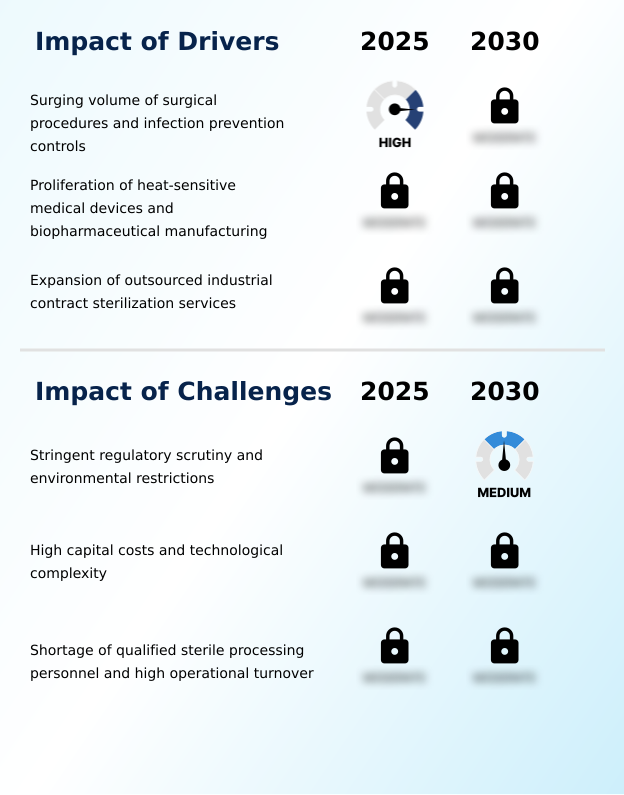
What are the key market drivers leading to the rise in the adoption of Sterilization Industry?

  • Escalating volumes of surgical procedures and rigorous infection prevention controls serve as the primary catalysts accelerating demand across the sector.

  • The surging volume of complex surgical procedures heavily drives the Sterilization sector, necessitating rigorous protocols to mitigate hospital-acquired infections. Rapid clinical expansion forces central sterile supply departments to scale capacity, replacing manual workflows with advanced automated washer-disinfectors.
  • As medical devices incorporate sensitive electronics, reliance on low-temperature modalities has accelerated to prevent material degradation. This operational shift lowers instrument replacement costs by 18 percent annually.
  • High-volume production of single-use consumables further propels demand for industrial contract processing facilities equipped to handle bulk throughput. The integration of zero-residue chemical sterilants ensures complete material compatibility, yielding a 30 percent improvement in processing turnaround times.

What are the market trends shaping the Sterilization Industry?

  • The industry is currently experiencing a strategic shift toward sustainable low-temperature processing modalities. This transition actively addresses tightening environmental regulations while preserving the integrity of sensitive medical instruments.

  • The Sterilization industry is rapidly transitioning toward eco-friendly solutions to manage emission control thresholds effectively. Facilities are integrating iot sensor networks into advanced equipment to monitor real-time metrics during microbicidal destruction. This digital transition enhances cycle verification, ensuring consistent compliance without manual intervention.
  • By adopting vaporized hydrogen peroxide systems over legacy methods, operational downtime has been reduced by 14 percent across commercial processing hubs. Moreover, predictive maintenance diagnostics prevent catastrophic hardware failures before they occur, optimizing equipment lifespan. The shift away from toxic chemicals improves worker safety while achieving a 22 percent increase in daily throughput for heat-sensitive surgical instruments.

What challenges does the Sterilization Industry face during its growth?

  • Stringent regulatory scrutiny regarding chemical emissions and complex environmental compliance mandates pose significant structural barriers to operational expansion.

  • Escalating environmental scrutiny over hazardous emissions presents a formidable structural challenge for the Sterilization market. Facilities utilizing industrial ethylene oxide gas face intense regulatory pressure to install expensive catalytic oxidizers, straining capital expenditure budgets. Retrofitting legacy chambers with enhanced structural containment often causes operational bottlenecks, increasing processing delays by up to 25 percent in regional hubs.
  • While maintaining defense against bioburden contamination remains non-negotiable, the high technological complexity of modern systems deters adoption in resource-constrained settings. Furthermore, integrating advanced digital sterility assurance software and robotic tray assembly systems requires highly specialized personnel. This persistent shortage of certified technicians restricts overall throughput capacity, ultimately driving up baseline operational costs by 15 percent.

Exclusive Technavio Analysis on Customer Landscape

The sterilization market forecasting report includes the adoption lifecycle of the market, covering from the innovator’s stage to the laggard’s stage. It focuses on adoption rates in different regions based on penetration. Furthermore, the sterilization market report also includes key purchase criteria and drivers of price sensitivity to help companies evaluate and develop their market growth analysis strategies.
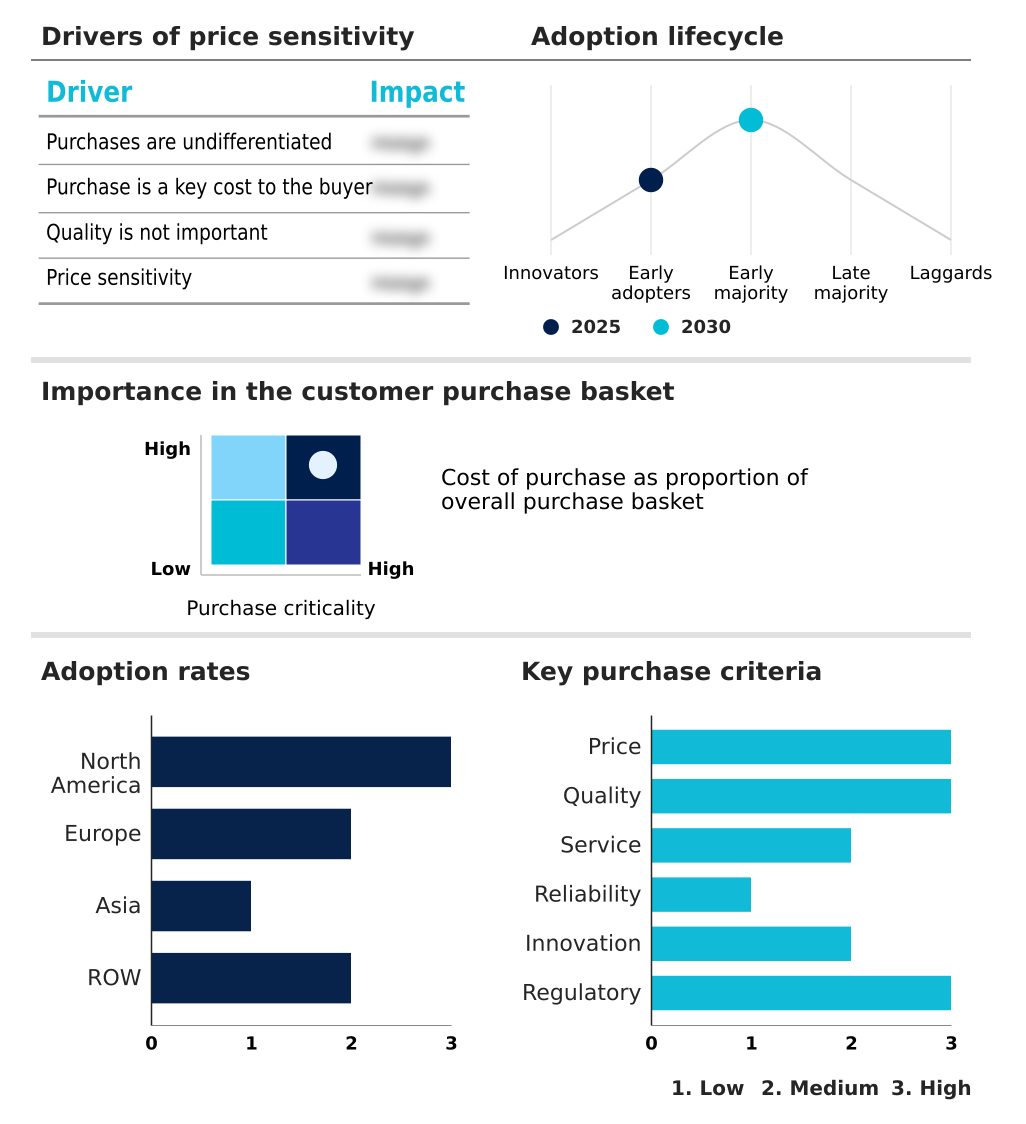
Customer Landscape of Sterilization Industry

Competitive Landscape

Companies are implementing various strategies, such as strategic alliances, sterilization market forecast, partnerships, mergers and acquisitions, geographical expansion, and product/service launches, to enhance their presence in the industry.

Andersen Sterilizers - This unified segment delivers highly specialized gas sterilizers specifically engineered for the medical, veterinary, research, and manufacturing industries to ensure uncompromising material safety and regulatory compliance.

The industry research and growth report includes detailed analyses of the competitive landscape of the market and information about key companies, including:

  • Andersen Sterilizers
  • Antonio Matachana SA
  • ASP Global Manufacturing GmbH
  • Belimed AG
  • BGS Beta Gamma Service GmbH
  • Consolidated Sterilizer Systems
  • E BEAM Services Inc.
  • Fedegari Autoclavi Spa
  • Getinge AB
  • Medistri SA
  • MELAG Medizintechnik GmbH
  • Mesa Laboratories Inc.
  • Midwest Sterilization Corp.
  • MMM Group
  • Priorclave Ltd
  • Smart World LLC
  • Solventum Corp.
  • Sterigenics U.S. LLC
  • STERIS plc
  • Tuttnauer

Qualitative and quantitative analysis of companies has been conducted to help clients understand the wider business environment as well as the strengths and weaknesses of key industry players. Data is qualitatively analyzed to categorize companies as pure play, category-focused, industry-focused, and diversified; it is quantitatively analyzed to categorize companies as dominant, leading, strong, tentative, and weak.

Recent Development and News in Sterilization market

  • In the Health Care Supplies industry, the implementation of ISO 14001 environmental sustainability standards has forced manufacturers to reduce toxic chemical effluents, directly impacting Sterilization demand by accelerating the adoption of eco-friendly hydrogen peroxide systems.
  • In the Health Care Supplies industry, the widespread shift toward decentralized ambulatory surgical centers has altered procurement strategies for capital equipment, directly impacting Sterilization demand by increasing the installation rate of compact tabletop reprocessing units by 15 percent.
  • In the Health Care Supplies industry, rigorous new tracking mandates under the European Union Medical Device Regulation have mandated full lifecycle traceability, directly impacting Sterilization demand by driving the integration of cloud-based digital compliance logging software.
  • In the Health Care Supplies industry, the rapid expansion of robotic-assisted surgical platforms has introduced highly complex, heat-labile instruments into daily workflows, directly impacting Sterilization demand by pulling investment toward non-thermal vaporized peracetic acid chambers.

Dive into Technavio’s robust research methodology, blending expert interviews, extensive data synthesis, and validated models for unparalleled Sterilization Market insights. See full methodology.

Market Scope
Page number 283
Base year 2025
Historic period 2020-2024
Forecast period 2026-2030
Growth momentum & CAGR Accelerate at a CAGR of 7.7%
Market growth 2026-2030 USD 5054.5 million
Market structure Fragmented
YoY growth 2025-2026(%) 7.5%
Key countries US, Canada, Mexico, Germany, UK, France, Italy, Spain, The Netherlands, China, Japan, India, South Korea, Singapore, Thailand, Brazil, Saudi Arabia, UAE, South Africa, Argentina, Egypt, Israel and Chile
Competitive landscape Leading Companies, Market Positioning of Companies, Competitive Strategies, and Industry Risks

Request Free Sample

Research Analyst Overview

  • The Sterilization landscape is undergoing a systemic operational overhaul driven by the imperative to safeguard complex medical instruments and ensure strict regulatory adherence. Industrial processing facilities and clinical institutions are transitioning away from conventional thermal methods to accommodate sensitive electronics and delicate polymers.
  • Specifically, the integration of vaporized hydrogen peroxide and optimized chemical sterilants ensures complete decontamination without risking structural degradation. Facilities executing high-volume throughput still rely on advanced steam autoclaving, increasingly updated with closed-loop water recovery features to drastically reduce utility consumption. In industrial applications, the heavy reliance on ethylene oxide gas requires massive infrastructure investments to capture emissions and maintain compliance.
  • Modern administrators prioritize supply chain transparency, aggressively adopting digital sterility assurance platforms that connect directly with equipment telemetry. This technological integration replaces manual logging with automated validation, achieving a 30 percent reduction in processing compliance errors.
  • Furthermore, the continuous deployment of standardized biological indicator media validates cycle efficacy in real-time, effectively bridging the gap between rigorous infection control protocols and optimized asset utilization across all reprocessing environments.

What are the Key Data Covered in this Sterilization Market Research and Growth Report?

  • What is the expected growth of the Sterilization Market between 2026 and 2030?

    • USD 5.05 billion, at a CAGR of 7.7%

  • What segmentation does the market report cover?

    • The report is segmented by Type (Chemical sterilization, Radiation sterilization, and Others), End-user (Hospitals and clinics, Pharma and medTech, and Others), Delivery Mode (Off-site sterilization, and On-site sterilization) and Geography (North America, Europe, Asia, Rest of World (ROW))

  • Which regions are analyzed in the report?

    • North America, Europe, Asia and Rest of World (ROW)

  • What are the key growth drivers and market challenges?

    • Surging volume of surgical procedures and infection prevention controls, Stringent regulatory scrutiny and environmental restrictions

  • Who are the major players in the Sterilization Market?

    • Andersen Sterilizers, Antonio Matachana SA, ASP Global Manufacturing GmbH, Belimed AG, BGS Beta Gamma Service GmbH, Consolidated Sterilizer Systems, E BEAM Services Inc., Fedegari Autoclavi Spa, Getinge AB, Medistri SA, MELAG Medizintechnik GmbH, Mesa Laboratories Inc., Midwest Sterilization Corp., MMM Group, Priorclave Ltd, Smart World LLC, Solventum Corp., Sterigenics U.S. LLC, STERIS plc and Tuttnauer

Market Research Insights

  • The Sterilization Market serves as a foundational pillar for maintaining patient safety and regulatory compliance across clinical infrastructure. As healthcare networks battle rising hospital-acquired infections, administrators are heavily investing in modernizing central sterile supply departments. Transitioning to automated load processing has reduced handling errors by 18 percent, streamlining operational efficiency.
  • Furthermore, the exponential production of single-use consumables dictates a heightened reliance on high-capacity industrial processing vaults. By implementing advanced digital cycle verification systems, facilities achieve a 25 percent improvement in audit readiness. This strategic integration of automated hardware and traceability software ultimately lowers overall compliance costs while ensuring continuous supply chain fluidity.

We can help! Our analysts can customize this sterilization market research report to meet your requirements.

Get in touch

1. Executive Summary

1.1 Market overview

Executive Summary - Chart on Market Overview
Executive Summary - Data Table on Market Overview
Executive Summary - Chart on Global Market Characteristics
Executive Summary - Chart on Market by Geography
Executive Summary - Chart on Market Segmentation by Type
Executive Summary - Chart on Market Segmentation by End-user
Executive Summary - Chart on Market Segmentation by Delivery Mode
Executive Summary - Chart on Incremental Growth
Executive Summary - Data Table on Incremental Growth
Executive Summary - Chart on Company Market Positioning

2. Technavio Analysis

2.1 Analysis of price sensitivity, lifecycle, customer purchase basket, adoption rates, and purchase criteria

2.2 Criticality of inputs and Factors of differentiation

Chart on Overview on criticality of inputs and factors of differentiation

2.3 Factors of disruption

Chart on Overview on factors of disruption

2.4 Impact of drivers and challenges

Chart on Impact of drivers and challenges in 2025 and 2030

3. Market Landscape

3.1 Market ecosystem

Chart on Parent Market
Data Table on - Parent Market

3.2 Market characteristics

Chart on Market characteristics analysis

3.3 Value chain analysis

Chart on Value chain analysis

4. Market Sizing

4.1 Market definition

Data Table on Offerings of companies included in the market definition

4.2 Market segment analysis

Market segments

4.3 Market size 2025

4.4 Market outlook: Forecast for 2025-2030

Chart on Global - Market size and forecast 2025-2030 ($ million)
Data Table on Global - Market size and forecast 2025-2030 ($ million)
Chart on Global Market: Year-over-year growth 2025-2030 (%)
Data Table on Global Market: Year-over-year growth 2025-2030 (%)

5. Historic Market Size

5.1 Global Sterilization Market 2020 - 2024

Historic Market Size - Data Table on Global Sterilization Market 2020 - 2024 ($ million)

5.2 Type segment analysis 2020 - 2024

Historic Market Size - Type Segment 2020 - 2024 ($ million)

5.3 End-user segment analysis 2020 - 2024

Historic Market Size - End-user Segment 2020 - 2024 ($ million)

5.4 Delivery Mode segment analysis 2020 - 2024

Historic Market Size - Delivery Mode Segment 2020 - 2024 ($ million)

5.5 Geography segment analysis 2020 - 2024

Historic Market Size - Geography Segment 2020 - 2024 ($ million)

5.6 Country segment analysis 2020 - 2024

Historic Market Size - Country Segment 2020 - 2024 ($ million)

6. Qualitative Analysis

6.1 Impact of AI on Global Sterilization Market

6.2 Impact of geopolitical conflicts on Global Sterilization Market

7. Five Forces Analysis

7.1 Five forces summary

Five forces analysis - Comparison between 2025 and 2030

7.2 Bargaining power of buyers

Bargaining power of buyers - Impact of key factors 2025 and 2030

7.3 Bargaining power of suppliers

Bargaining power of suppliers - Impact of key factors in 2025 and 2030

7.4 Threat of new entrants

Threat of new entrants - Impact of key factors in 2025 and 2030

7.5 Threat of substitutes

Threat of substitutes - Impact of key factors in 2025 and 2030

7.6 Threat of rivalry

Threat of rivalry - Impact of key factors in 2025 and 2030

7.7 Market condition

Chart on Market condition - Five forces 2025 and 2030

8. Market Segmentation by Type

8.1 Market segments

Chart on Type - Market share 2025-2030 (%)
Data Table on Type - Market share 2025-2030 (%)

8.2 Comparison by Type

Chart on Comparison by Type
Data Table on Comparison by Type

8.3 Chemical sterilization - Market size and forecast 2025-2030

Chart on Chemical sterilization - Market size and forecast 2025-2030 ($ million)
Data Table on Chemical sterilization - Market size and forecast 2025-2030 ($ million)
Chart on Chemical sterilization - Year-over-year growth 2025-2030 (%)
Data Table on Chemical sterilization - Year-over-year growth 2025-2030 (%)

8.4 Radiation sterilization - Market size and forecast 2025-2030

Chart on Radiation sterilization - Market size and forecast 2025-2030 ($ million)
Data Table on Radiation sterilization - Market size and forecast 2025-2030 ($ million)
Chart on Radiation sterilization - Year-over-year growth 2025-2030 (%)
Data Table on Radiation sterilization - Year-over-year growth 2025-2030 (%)

8.5 Others - Market size and forecast 2025-2030

Chart on Others - Market size and forecast 2025-2030 ($ million)
Data Table on Others - Market size and forecast 2025-2030 ($ million)
Chart on Others - Year-over-year growth 2025-2030 (%)
Data Table on Others - Year-over-year growth 2025-2030 (%)

8.6 Market opportunity by Type

Market opportunity by Type ($ million)
Data Table on Market opportunity by Type ($ million)

9. Market Segmentation by End-user

9.1 Market segments

Chart on End-user - Market share 2025-2030 (%)
Data Table on End-user - Market share 2025-2030 (%)

9.2 Comparison by End-user

Chart on Comparison by End-user
Data Table on Comparison by End-user

9.3 Hospitals and clinics - Market size and forecast 2025-2030

Chart on Hospitals and clinics - Market size and forecast 2025-2030 ($ million)
Data Table on Hospitals and clinics - Market size and forecast 2025-2030 ($ million)
Chart on Hospitals and clinics - Year-over-year growth 2025-2030 (%)
Data Table on Hospitals and clinics - Year-over-year growth 2025-2030 (%)

9.4 Pharma and medTech - Market size and forecast 2025-2030

Chart on Pharma and medTech - Market size and forecast 2025-2030 ($ million)
Data Table on Pharma and medTech - Market size and forecast 2025-2030 ($ million)
Chart on Pharma and medTech - Year-over-year growth 2025-2030 (%)
Data Table on Pharma and medTech - Year-over-year growth 2025-2030 (%)

9.5 Others - Market size and forecast 2025-2030

Chart on Others - Market size and forecast 2025-2030 ($ million)
Data Table on Others - Market size and forecast 2025-2030 ($ million)
Chart on Others - Year-over-year growth 2025-2030 (%)
Data Table on Others - Year-over-year growth 2025-2030 (%)

9.6 Market opportunity by End-user

Market opportunity by End-user ($ million)
Data Table on Market opportunity by End-user ($ million)

10. Market Segmentation by Delivery Mode

10.1 Market segments

Chart on Delivery Mode - Market share 2025-2030 (%)
Data Table on Delivery Mode - Market share 2025-2030 (%)

10.2 Comparison by Delivery Mode

Chart on Comparison by Delivery Mode
Data Table on Comparison by Delivery Mode

10.3 Off-site sterilization - Market size and forecast 2025-2030

Chart on Off-site sterilization - Market size and forecast 2025-2030 ($ million)
Data Table on Off-site sterilization - Market size and forecast 2025-2030 ($ million)
Chart on Off-site sterilization - Year-over-year growth 2025-2030 (%)
Data Table on Off-site sterilization - Year-over-year growth 2025-2030 (%)

10.4 On-site sterilization - Market size and forecast 2025-2030

Chart on On-site sterilization - Market size and forecast 2025-2030 ($ million)
Data Table on On-site sterilization - Market size and forecast 2025-2030 ($ million)
Chart on On-site sterilization - Year-over-year growth 2025-2030 (%)
Data Table on On-site sterilization - Year-over-year growth 2025-2030 (%)

10.5 Market opportunity by Delivery Mode

Market opportunity by Delivery Mode ($ million)
Data Table on Market opportunity by Delivery Mode ($ million)

11. Customer Landscape

11.1 Customer landscape overview

Analysis of price sensitivity, lifecycle, customer purchase basket, adoption rates, and purchase criteria

12. Geographic Landscape

12.1 Geographic segmentation

Chart on Market share by geography 2025-2030 (%)
Data Table on Market share by geography 2025-2030 (%)

12.2 Geographic comparison

Chart on Geographic comparison
Data Table on Geographic comparison

12.3 North America - Market size and forecast 2025-2030

Chart on North America - Market size and forecast 2025-2030 ($ million)
Data Table on North America - Market size and forecast 2025-2030 ($ million)
Chart on North America - Year-over-year growth 2025-2030 (%)
Data Table on North America - Year-over-year growth 2025-2030 (%)
Chart on Regional Comparison - North America
Data Table on Regional Comparison - North America

12.3.1 US - Market size and forecast 2025-2030

Chart on US - Market size and forecast 2025-2030 ($ million)
Data Table on US - Market size and forecast 2025-2030 ($ million)
Chart on US - Year-over-year growth 2025-2030 (%)
Data Table on US - Year-over-year growth 2025-2030 (%)

12.3.2 Canada - Market size and forecast 2025-2030

Chart on Canada - Market size and forecast 2025-2030 ($ million)
Data Table on Canada - Market size and forecast 2025-2030 ($ million)
Chart on Canada - Year-over-year growth 2025-2030 (%)
Data Table on Canada - Year-over-year growth 2025-2030 (%)

12.3.3 Mexico - Market size and forecast 2025-2030

Chart on Mexico - Market size and forecast 2025-2030 ($ million)
Data Table on Mexico - Market size and forecast 2025-2030 ($ million)
Chart on Mexico - Year-over-year growth 2025-2030 (%)
Data Table on Mexico - Year-over-year growth 2025-2030 (%)

12.4 Europe - Market size and forecast 2025-2030

Chart on Europe - Market size and forecast 2025-2030 ($ million)
Data Table on Europe - Market size and forecast 2025-2030 ($ million)
Chart on Europe - Year-over-year growth 2025-2030 (%)
Data Table on Europe - Year-over-year growth 2025-2030 (%)
Chart on Regional Comparison - Europe
Data Table on Regional Comparison - Europe

12.4.1 Germany - Market size and forecast 2025-2030

Chart on Germany - Market size and forecast 2025-2030 ($ million)
Data Table on Germany - Market size and forecast 2025-2030 ($ million)
Chart on Germany - Year-over-year growth 2025-2030 (%)
Data Table on Germany - Year-over-year growth 2025-2030 (%)

12.4.2 UK - Market size and forecast 2025-2030

Chart on UK - Market size and forecast 2025-2030 ($ million)
Data Table on UK - Market size and forecast 2025-2030 ($ million)
Chart on UK - Year-over-year growth 2025-2030 (%)
Data Table on UK - Year-over-year growth 2025-2030 (%)

12.4.3 France - Market size and forecast 2025-2030

Chart on France - Market size and forecast 2025-2030 ($ million)
Data Table on France - Market size and forecast 2025-2030 ($ million)
Chart on France - Year-over-year growth 2025-2030 (%)
Data Table on France - Year-over-year growth 2025-2030 (%)

12.4.4 Italy - Market size and forecast 2025-2030

Chart on Italy - Market size and forecast 2025-2030 ($ million)
Data Table on Italy - Market size and forecast 2025-2030 ($ million)
Chart on Italy - Year-over-year growth 2025-2030 (%)
Data Table on Italy - Year-over-year growth 2025-2030 (%)

12.4.5 Spain - Market size and forecast 2025-2030

Chart on Spain - Market size and forecast 2025-2030 ($ million)
Data Table on Spain - Market size and forecast 2025-2030 ($ million)
Chart on Spain - Year-over-year growth 2025-2030 (%)
Data Table on Spain - Year-over-year growth 2025-2030 (%)

12.4.6 The Netherlands - Market size and forecast 2025-2030

Chart on The Netherlands - Market size and forecast 2025-2030 ($ million)
Data Table on The Netherlands - Market size and forecast 2025-2030 ($ million)
Chart on The Netherlands - Year-over-year growth 2025-2030 (%)
Data Table on The Netherlands - Year-over-year growth 2025-2030 (%)

12.5 Asia - Market size and forecast 2025-2030

Chart on Asia - Market size and forecast 2025-2030 ($ million)
Data Table on Asia - Market size and forecast 2025-2030 ($ million)
Chart on Asia - Year-over-year growth 2025-2030 (%)
Data Table on Asia - Year-over-year growth 2025-2030 (%)
Chart on Regional Comparison - Asia
Data Table on Regional Comparison - Asia

12.5.1 China - Market size and forecast 2025-2030

Chart on China - Market size and forecast 2025-2030 ($ million)
Data Table on China - Market size and forecast 2025-2030 ($ million)
Chart on China - Year-over-year growth 2025-2030 (%)
Data Table on China - Year-over-year growth 2025-2030 (%)

12.5.2 Japan - Market size and forecast 2025-2030

Chart on Japan - Market size and forecast 2025-2030 ($ million)
Data Table on Japan - Market size and forecast 2025-2030 ($ million)
Chart on Japan - Year-over-year growth 2025-2030 (%)
Data Table on Japan - Year-over-year growth 2025-2030 (%)

12.5.3 India - Market size and forecast 2025-2030

Chart on India - Market size and forecast 2025-2030 ($ million)
Data Table on India - Market size and forecast 2025-2030 ($ million)
Chart on India - Year-over-year growth 2025-2030 (%)
Data Table on India - Year-over-year growth 2025-2030 (%)

12.5.4 South Korea - Market size and forecast 2025-2030

Chart on South Korea - Market size and forecast 2025-2030 ($ million)
Data Table on South Korea - Market size and forecast 2025-2030 ($ million)
Chart on South Korea - Year-over-year growth 2025-2030 (%)
Data Table on South Korea - Year-over-year growth 2025-2030 (%)

12.5.5 Singapore - Market size and forecast 2025-2030

Chart on Singapore - Market size and forecast 2025-2030 ($ million)
Data Table on Singapore - Market size and forecast 2025-2030 ($ million)
Chart on Singapore - Year-over-year growth 2025-2030 (%)
Data Table on Singapore - Year-over-year growth 2025-2030 (%)

12.5.6 Thailand - Market size and forecast 2025-2030

Chart on Thailand - Market size and forecast 2025-2030 ($ million)
Data Table on Thailand - Market size and forecast 2025-2030 ($ million)
Chart on Thailand - Year-over-year growth 2025-2030 (%)
Data Table on Thailand - Year-over-year growth 2025-2030 (%)

12.6 Rest of World (ROW) - Market size and forecast 2025-2030

Chart on Rest of World (ROW) - Market size and forecast 2025-2030 ($ million)
Data Table on Rest of World (ROW) - Market size and forecast 2025-2030 ($ million)
Chart on Rest of World (ROW) - Year-over-year growth 2025-2030 (%)
Data Table on Rest of World (ROW) - Year-over-year growth 2025-2030 (%)
Chart on Regional Comparison - Rest of World (ROW)
Data Table on Regional Comparison - Rest of World (ROW)

12.6.1 Brazil - Market size and forecast 2025-2030

Chart on Brazil - Market size and forecast 2025-2030 ($ million)
Data Table on Brazil - Market size and forecast 2025-2030 ($ million)
Chart on Brazil - Year-over-year growth 2025-2030 (%)
Data Table on Brazil - Year-over-year growth 2025-2030 (%)

12.6.2 Saudi Arabia - Market size and forecast 2025-2030

Chart on Saudi Arabia - Market size and forecast 2025-2030 ($ million)
Data Table on Saudi Arabia - Market size and forecast 2025-2030 ($ million)
Chart on Saudi Arabia - Year-over-year growth 2025-2030 (%)
Data Table on Saudi Arabia - Year-over-year growth 2025-2030 (%)

12.6.3 UAE - Market size and forecast 2025-2030

Chart on UAE - Market size and forecast 2025-2030 ($ million)
Data Table on UAE - Market size and forecast 2025-2030 ($ million)
Chart on UAE - Year-over-year growth 2025-2030 (%)
Data Table on UAE - Year-over-year growth 2025-2030 (%)

12.6.4 South Africa - Market size and forecast 2025-2030

Chart on South Africa - Market size and forecast 2025-2030 ($ million)
Data Table on South Africa - Market size and forecast 2025-2030 ($ million)
Chart on South Africa - Year-over-year growth 2025-2030 (%)
Data Table on South Africa - Year-over-year growth 2025-2030 (%)

12.6.5 Argentina - Market size and forecast 2025-2030

Chart on Argentina - Market size and forecast 2025-2030 ($ million)
Data Table on Argentina - Market size and forecast 2025-2030 ($ million)
Chart on Argentina - Year-over-year growth 2025-2030 (%)
Data Table on Argentina - Year-over-year growth 2025-2030 (%)

12.6.6 Egypt - Market size and forecast 2025-2030

Chart on Egypt - Market size and forecast 2025-2030 ($ million)
Data Table on Egypt - Market size and forecast 2025-2030 ($ million)
Chart on Egypt - Year-over-year growth 2025-2030 (%)
Data Table on Egypt - Year-over-year growth 2025-2030 (%)

12.6.7 Israel - Market size and forecast 2025-2030

Chart on Israel - Market size and forecast 2025-2030 ($ million)
Data Table on Israel - Market size and forecast 2025-2030 ($ million)
Chart on Israel - Year-over-year growth 2025-2030 (%)
Data Table on Israel - Year-over-year growth 2025-2030 (%)

12.6.8 Chile - Market size and forecast 2025-2030

Chart on Chile - Market size and forecast 2025-2030 ($ million)
Data Table on Chile - Market size and forecast 2025-2030 ($ million)
Chart on Chile - Year-over-year growth 2025-2030 (%)
Data Table on Chile - Year-over-year growth 2025-2030 (%)

12.7 Market opportunity by geography

Market opportunity by geography ($ million)
Data Tables on Market opportunity by geography ($ million)

13. Drivers, Challenges, and Opportunity

13.1 Market drivers

Surging volume of surgical procedures and infection prevention controls
Proliferation of heat-sensitive medical devices and biopharmaceutical manufacturing
Expansion of outsourced industrial contract sterilization services

13.2 Market challenges

Stringent regulatory scrutiny and environmental restrictions
High capital costs and technological complexity
Shortage of qualified sterile processing personnel and high operational turnover

13.3 Impact of drivers and challenges

Impact of drivers and challenges in 2025 and 2030

13.4 Market opportunities

Transition toward sustainable low-temperature modalities
Digitalization and integration of AI in sterility assurance workflows
Expansion of decentralized outpatient reprocessing

14. Competitive Landscape

14.1 Overview

14.2

Overview on criticality of inputs and factors of differentiation

14.3 Landscape disruption

Overview on factors of disruption

14.4 Industry risks

Impact of key risks on business

15. Competitive Analysis

15.1 Companies profiled

Companies covered

15.2 Company ranking index

15.3 Market positioning of companies

Matrix on companies position and classification

15.4 Antonio Matachana SA

Antonio Matachana SA - Overview
Antonio Matachana SA - Product / Service
Antonio Matachana SA - Key offerings
SWOT

15.5 ASP Global Manufacturing GmbH

ASP Global Manufacturing GmbH - Overview
ASP Global Manufacturing GmbH - Product / Service
ASP Global Manufacturing GmbH - Key offerings
SWOT

15.6 Belimed AG

Belimed AG - Overview
Belimed AG - Product / Service
Belimed AG - Key offerings
SWOT

15.7 BGS Beta Gamma Service GmbH

BGS Beta Gamma Service GmbH - Overview
BGS Beta Gamma Service GmbH - Product / Service
BGS Beta Gamma Service GmbH - Key offerings
SWOT

15.8 E BEAM Services Inc.

E BEAM Services Inc. - Overview
E BEAM Services Inc. - Product / Service
E BEAM Services Inc. - Key offerings
SWOT

15.9 Getinge AB

Getinge AB - Overview
Getinge AB - Business segments
Getinge AB - Key offerings
Getinge AB - Segment focus
SWOT

15.10 Medistri SA

Medistri SA - Overview
Medistri SA - Product / Service
Medistri SA - Key offerings
SWOT

15.11 MELAG Medizintechnik GmbH

MELAG Medizintechnik GmbH - Overview
MELAG Medizintechnik GmbH - Product / Service
MELAG Medizintechnik GmbH - Key offerings
SWOT

15.12 Mesa Laboratories Inc.

Mesa Laboratories Inc. - Overview
Mesa Laboratories Inc. - Business segments
Mesa Laboratories Inc. - Key offerings
Mesa Laboratories Inc. - Segment focus
SWOT

15.13 MMM Group

MMM Group - Overview
MMM Group - Product / Service
MMM Group - Key offerings
SWOT

15.14 Smart World LLC

Smart World LLC - Overview
Smart World LLC - Product / Service
Smart World LLC - Key offerings
SWOT

15.15 Solventum Corp.

Solventum Corp. - Overview
Solventum Corp. - Product / Service
Solventum Corp. - Key offerings
SWOT

15.16 Sterigenics U.S. LLC

Sterigenics U.S. LLC - Overview
Sterigenics U.S. LLC - Product / Service
Sterigenics U.S. LLC - Key offerings
SWOT

15.17 STERIS plc

STERIS plc - Overview
STERIS plc - Business segments
STERIS plc - Key offerings
STERIS plc - Segment focus
SWOT

15.18 Tuttnauer

Tuttnauer - Overview
Tuttnauer - Product / Service
Tuttnauer - Key offerings
SWOT

16. Appendix

16.1 Scope of the report

Market definition
Objectives
Notes and caveats

16.2 Inclusions and exclusions checklist

Inclusions checklist
Exclusions checklist

16.3 Currency conversion rates for US$

16.4 Research methodology

16.5 Data procurement

Information sources

16.6 Data validation

16.7 Validation techniques employed for market sizing

16.8 Data synthesis

16.9 360 degree market analysis

16.10 List of abbreviations

Research Methodology

Technavio presents a detailed picture of the market by way of study, synthesis, and summation of data from multiple sources. The analysts have presented the various facets of the market with a particular focus on identifying the key industry influencers. The data thus presented is comprehensive, reliable, and the result of extensive research, both primary and secondary.

INFORMATION SOURCES

Primary sources

  • Manufacturers and suppliers
  • Channel partners
  • Industry experts
  • Strategic decision makers

Secondary sources

  • Industry journals and periodicals
  • Government data
  • Financial reports of key industry players
  • Historical data
  • Press releases

DATA ANALYSIS

Data Synthesis

  • Collation of data
  • Estimation of key figures
  • Analysis of derived insights

Data Validation

  • Triangulation with data models
  • Reference against proprietary databases
  • Corroboration with industry experts

REPORT WRITING

Qualitative

  • Market drivers
  • Market challenges
  • Market trends
  • Five forces analysis

Quantitative

  • Market size and forecast
  • Market segmentation
  • Geographical insights
  • Competitive landscape

Interested in this report?

Get your sample now to see our research methodology and insights!

Download Now

Frequently Asked Questions

Sterilization market growth will increase by USD 5054.5 million during 2026-2030.

The Sterilization market is expected to grow at a CAGR of 7.7% during 2026-2030.

Sterilization market is segmented by Type (Chemical sterilization, Radiation sterilization, Others) End-user (Hospitals and clinics, Pharma and medTech, Others) Delivery mode (Off-site sterilization, On-site sterilization)

Andersen Sterilizers, Antonio Matachana SA, ASP Global Manufacturing GmbH, Belimed AG, BGS Beta Gamma Service GmbH, Consolidated Sterilizer Systems, E BEAM Services Inc., Fedegari Autoclavi Spa, Getinge AB, Medistri SA, MELAG Medizintechnik GmbH, Mesa Laboratories Inc., Midwest Sterilization Corp., MMM Group, Priorclave Ltd, Smart World LLC, Solventum Corp., Sterigenics U.S. LLC, STERIS plc, Tuttnauer are a few of the key vendors in the Sterilization market.

North America will register the highest growth rate of 32.7% among the other regions. Therefore, the Sterilization market in North America is expected to garner significant business opportunities for the vendors during the forecast period.

US, Canada, Mexico, Germany, UK, France, Italy, Spain, The Netherlands, China, Japan, India, South Korea, Singapore, Thailand, Brazil, Saudi Arabia, UAE, South Africa, Argentina, Egypt, Israel, Chile

  • Surging volume of surgical procedures and infection prevention controls is the driving factor this market.

The Sterilization market vendors should focus on grabbing business opportunities from the Type segment as it accounted for the largest market share in the base year.
RIA - Research AI Assistant
Ask RIA