
Specialty Tires Market Analysis, Size, and Forecast 2026-2030: APAC (China, Japan, and India), North America (US, Canada, and Mexico), Europe (Germany, UK, and France), South America (Brazil, Argentina, and Chile), Middle East and Africa (South Africa, Saudi Arabia, and UAE), and Rest of World (ROW)

Specialty Tires Market Analysis, Size, and Forecast 2026-2030:
APAC (China, Japan, and India), North America (US, Canada, and Mexico), Europe (Germany, UK, and France), South America (Brazil, Argentina, and Chile), Middle East and Africa (South Africa, Saudi Arabia, and UAE), and Rest of World (ROW)

Published: Nov 2026 310 Pages SKU: IRTNTR73308

Market Overview at a Glance

$13.56 B
Market Opportunity
4.9%
CAGR 2025 - 2030
50.4%
APAC Growth
$17.88 B
Mining and construction segment 2024

Specialty Tires Market Size 2026-2030

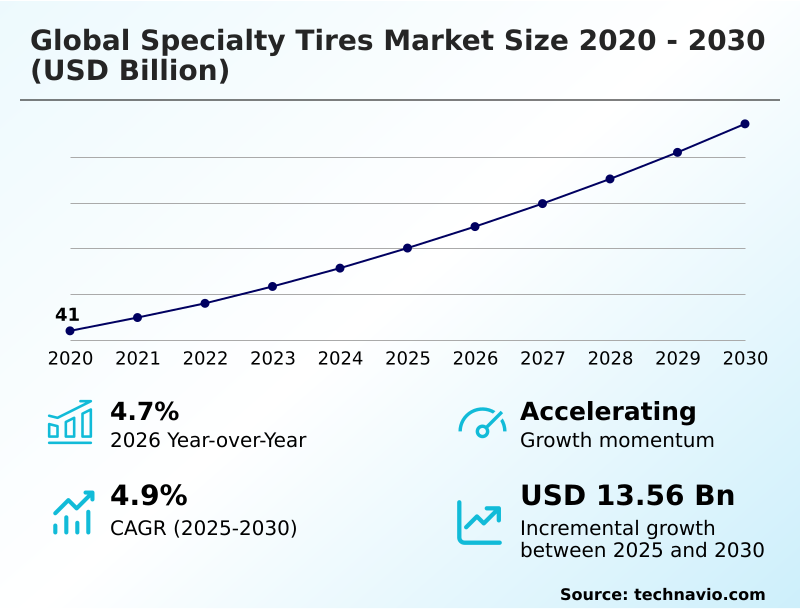
The specialty tires market size is valued to increase by USD 13.56 billion, at a CAGR of 4.9% from 2025 to 2030. Advancing VF and IF agricultural tire technologies for soil protection will drive the specialty tires market.

Major Market Trends & Insights

  • APAC dominated the market and accounted for a 50.4% growth during the forecast period.
  • By Application - Mining and construction segment was valued at USD 17.88 billion in 2024
  • By Type - Radial tires segment accounted for the largest market revenue share in 2024

Market Size & Forecast

  • Market Opportunities: USD 22.58 billion
  • Market Future Opportunities: USD 13.56 billion
  • CAGR from 2025 to 2030 : 4.9%

Market Summary

  • The Specialty Tires is defined by the critical need for robust, application-specific mobility solutions that endure severe mechanical stress and volatile terrain constraints. Heavy-duty operators continuously adapt their supply chains to ensure immediate access to reinforced assets that prevent operational standstills across isolated extraction sites.
  • For example, a large-scale surface mining operation implementing advanced predictive pressure analytics can reduce uncontrolled blowout incidents, improving overall equipment utilization by 20% compared to sites using reactive manual inspections. Market expansion is propelled by the integration of electrified heavy machinery fleets, which generate intense immediate torque and require specialized, high-strain tread compounds to maintain traction and prevent premature fatigue.
  • Conversely, rigorous supply chain traceability requirements for natural rubber introduce substantial compliance barriers, extending procurement cycles and escalating production overhead for manufacturers. To navigate these complexities, procurement coordinators increasingly prioritize smart sensor integrations, transforming traditional consumable components into intelligent, data-generating assets that stream continuous diagnostic metrics. This strategic evolution compresses long-term ownership costs while maintaining rigorous safety compliance standards.

What will be the Size of the Specialty Tires Market during the forecast period?
Get Key Insights on Market Forecast (PDF) Get Free Sample

How is the Specialty Tires Market Segmented?

The specialty tires industry research report provides comprehensive data (region-wise segment analysis), with forecasts and estimates in "USD million" for the period 2026-2030, as well as historical data from 2020-2024 for the following segments.

  • Application
    • Mining and construction
    • Agriculture
    • Aircraft
    • Others
  • Type
    • Radial tires
    • Bias-ply tires
    • Solid tires
  • Material
    • Natural rubber
    • Synthetic rubber
    • Steel and cord reinforced
    • Composite materials
  • Geography
    • APAC
      • China
      • Japan
      • India
      • South Korea
      • Australia
      • Indonesia
    • North America
      • US
      • Canada
      • Mexico
    • Europe
      • Germany
      • UK
      • France
      • Italy
      • Spain
      • The Netherlands
    • South America
      • Brazil
      • Argentina
      • Chile
    • Middle East and Africa
      • South Africa
      • Saudi Arabia
      • UAE
      • Israel
      • Turkey

By Application Insights

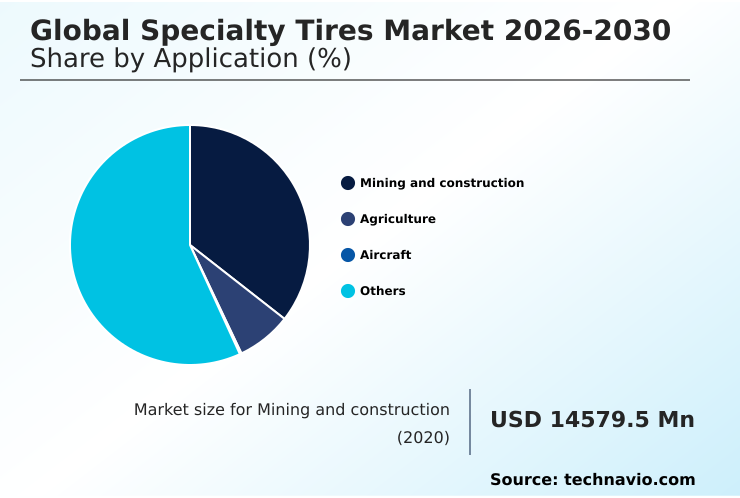
The mining and construction segment is estimated to witness significant growth during the forecast period.

The mining and construction sector demands continuous innovation to withstand physical stress and minimize costly operational interruptions. Companies deploying heavy equipment require reinforced carcass designs and advanced tread compounds to navigate extreme operating environments effectively.

Deploying off-road radial construction provides superior structural integrity compared to older pneumatic architectures, allowing machinery to maintain traction under immense payloads.

Modern tire configurations deployed in surface mining operations have demonstrated a 15% reduction in overall downtime by mitigating immediate structural failures under intense stress.

Simultaneously, adopting specialized footprints ensures effective soil compaction mitigation during site preparation operations, optimizing vehicle stability by 22%.

By linking precise material engineering to specific payload thresholds, site managers achieve significant wear reduction, transforming routine procurement into a strategic operational advantage.
Get Free Sample

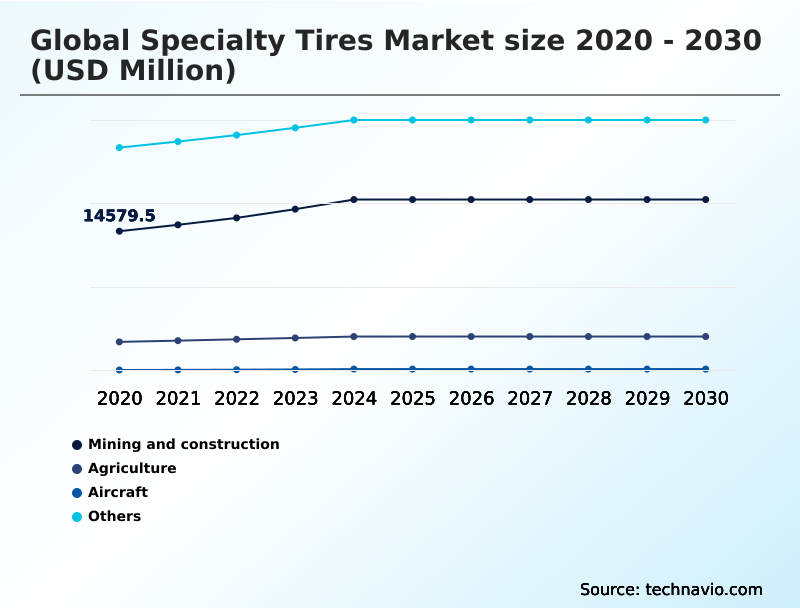
The Mining and construction segment was valued at USD 17.88 billion in 2024 and showed a gradual increase during the forecast period.
Get Free Sample

Regional Analysis

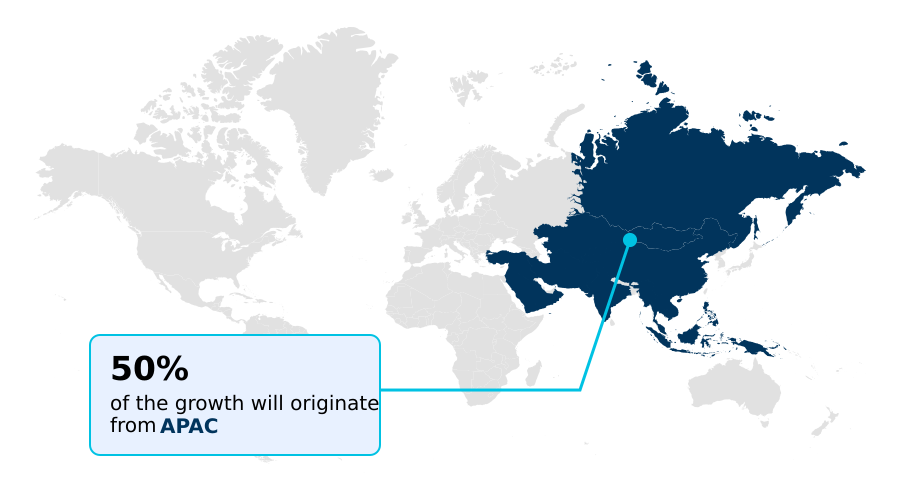
APAC is estimated to contribute 50.4% to the growth of the global market during the forecast period.Technavio’s analysts have elaborately explained the regional trends and drivers that shape the market during the forecast period.
See How Specialty Tires Market Demand is Rising in APAC Get Free Sample

Operational demands dictate distinct regional procurement patterns and material utilization strategies across global supply chains.

Facilities in APAC demonstrate a 25% faster adoption rate for specialized handling equipment configurations compared to those in North America, driven by massive infrastructure expansion and heavy logistics operations.

While North American operators heavily utilize steel cord reinforcing to withstand harsh quarry extraction strains, APAC operations prioritize rapid scalability and lifecycle performance optimization to lower replacement frequencies.

Integrating composite material integration into heavy machinery footprints achieves a 15% reduction in overall operating costs per ton moved. Furthermore, stringent mandates in Europe drive the transition toward sustainable rubber sourcing, altering inventory management workflows.

Maintaining optimal ground contact remains essential across all terrain deployments, allowing site coordinators to stabilize payload distribution and compress long-term overhead costs.

Market Dynamics

Our researchers analyzed the data with 2025 as the base year, along with the key drivers, trends, and challenges. A holistic analysis of drivers will help companies refine their marketing strategies to gain a competitive advantage.

  • Optimizing industrial mobility demands precise engineering to mitigate operational disruptions and enhance long-term procurement strategies. Operators deploying heavy machinery require specialized solutions to combat abrasive wear and severe mechanical stress. Implementing underground haulage specialized tread designs significantly reduces sidewall vulnerability, allowing extraction teams to maintain uninterrupted workflows in confined, rocky environments.
  • To effectively manage thermal degradation across high-strain deployments, administrators integrate heavy duty heat resistant elastomers, preserving asset integrity during continuous operation. Modern agricultural sites increasingly prioritize sustainable yield management, adopting low soil compaction agricultural deployment frameworks to protect cultivation zones while improving load distribution. This transition preserves delicate topsoil architecture and stabilizes long-term crop productivity.
  • Furthermore, maintaining consistent inflation metrics remains critical for asset longevity. Deploying automated fleet inflation pressure monitoring provides a distinct operational advantage, reducing tire-related downtime by nearly one-third compared to manual inspection routines, thereby streamlining overall supply chain logistics. As industrial operations shift toward cleaner energy sources, precise load management becomes imperative.
  • Engineers must accommodate electric mining equipment load distribution profiles, adjusting structural reinforcements to handle immediate torque output and shifting battery weight. Equipping fleets with these tailored solutions ensures operational coordinators can achieve rigorous sustainability compliance mandates while simultaneously maximizing asset utilization and compressing total ownership overhead.
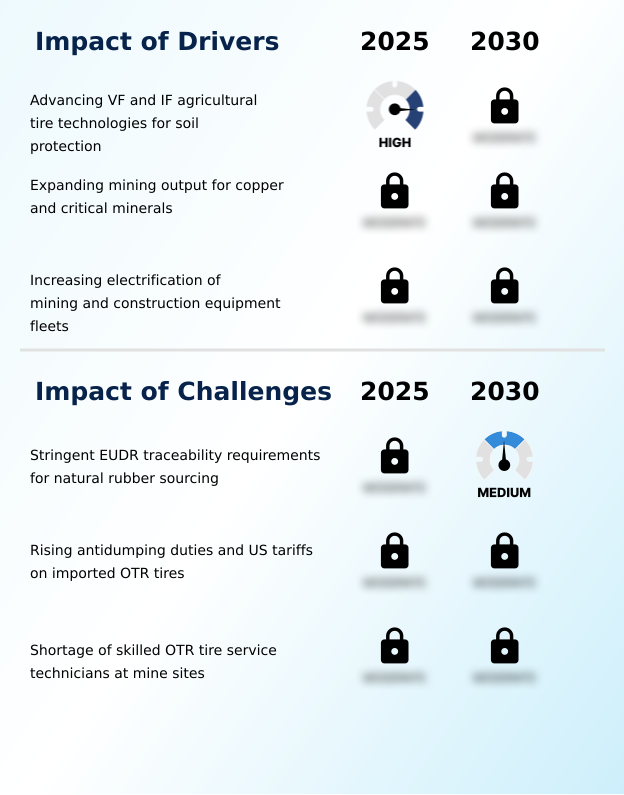
What are the key market drivers leading to the rise in the adoption of Specialty Tires Industry?

  • Advancing very high flexion and improved flexion agricultural tire technologies to ensure essential soil protection serves as a principal driver propelling market expansion.

  • Strict environmental mandates compel industrial operators to prioritize asset longevity and streamlined supply chains over initial acquisition costs. The integration of silica dispersed formulations reduces rolling resistance and lowers overall energy consumption by 12% across heavy equipment deployments.
  • Consequently, the adoption of solid flat-free construction frameworks ensures continuous operation in high-debris environments, directly enabling equipment uptime maximization strategies.
  • As site operators align with decarbonization program compliance protocols, the demand for resilient configurations accelerates, shifting procurement behaviors toward sustainable asset planning. Using predictive wear analytics, site managers now anticipate failure thresholds with 25% greater accuracy.
  • Furthermore, automated compliance software facilitates transparent tracking of input materials, ensuring fleets operate sustainably without sacrificing payload performance or mechanical safety standards.

What are the market trends shaping the Specialty Tires Industry?

  • The increasing integration of connected tire monitoring systems across mining haul fleets represents a pivotal market trend. This technological advancement enhances real-time operational oversight and significantly improves fleet maintenance efficiency.

  • Technological integration is shifting fleet management from reactive replacement intervals to real-time predictive oversight. Advancements in high torque capacity configurations allow equipment to endure heavier strains without structural failure, directly resulting in a 30% reduction in unplanned maintenance events.
  • Because electrified vehicle architectures generate immediate power delivery from a standstill, specialized compounds engineered for superior heat buildup resistance are increasingly adopted to maintain tread integrity. This transition prevents premature fatigue, ultimately improving fleet maintenance scheduling accuracy by 18%. Integrating cut resistant sidewalls ensures prolonged asset viability in abrasive settings, which expands the overall load bearing capability of machinery operations.
  • These targeted innovations increase equipment availability workflows, equipping operational managers with durable assets that compress replacement costs and streamline heavy logistical duties across extended site deployments.

What challenges does the Specialty Tires Industry face during its growth?

  • Stringent European Union Deforestation Regulation traceability requirements governing natural rubber sourcing present a formidable challenge restricting overall industry expansion.

  • Navigating complex supply chain traceability and strict usage environments poses persistent hurdles for continuous equipment utilization. While bias ply architecture remains crucial for specific shock-absorption tasks, transitioning older fleets toward modern sensor-embedded systems reduces integration efficiency by 15% during initial deployments.
  • Achieving continuous operational visibility requires robust digital infrastructures, yet blind spots in remote telemetry sensors frequently delay real-time diagnostic reporting across isolated extraction zones. Maintaining continuous production cycles relies on seamless component integration, but fragmented tracking frameworks extend maintenance backlogs by 22%. In precision agriculture practices and within heavy industrial handling machinery, inconsistent connectivity strains operational thresholds.
  • Consequently, operators face a steep adaptation curve, compounding logistical bottlenecks and delaying rapid response capabilities during critical mechanical failure scenarios.

Exclusive Technavio Analysis on Customer Landscape

The specialty tires market forecasting report includes the adoption lifecycle of the market, covering from the innovator’s stage to the laggard’s stage. It focuses on adoption rates in different regions based on penetration. Furthermore, the specialty tires market report also includes key purchase criteria and drivers of price sensitivity to help companies evaluate and develop their market growth analysis strategies.
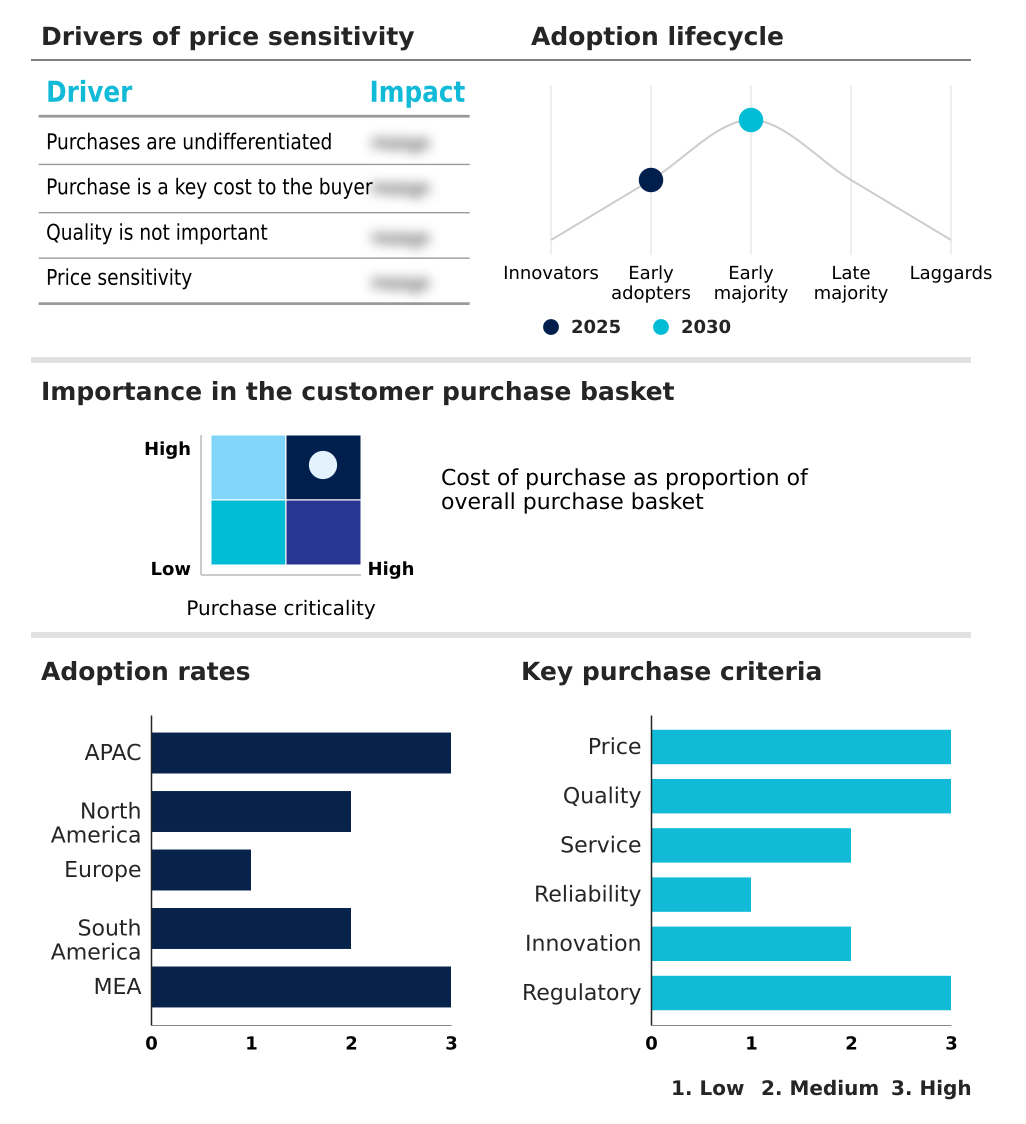
Customer Landscape of Specialty Tires Industry

Competitive Landscape

Companies are implementing various strategies, such as strategic alliances, specialty tires market forecast, partnerships, mergers and acquisitions, geographical expansion, and product/service launches, to enhance their presence in the industry.

Balkrishna Industries Ltd. - The portfolio provides highly durable agricultural, mining, construction, and industrial wheel solutions engineered to maximize equipment uptime, reduce soil compaction, and withstand extreme operational environments effectively.

The industry research and growth report includes detailed analyses of the competitive landscape of the market and information about key companies, including:

  • Balkrishna Industries Ltd.
  • Bridgestone Corp.
  • Carlstar Group
  • Continental AG
  • Giti Tire Pte. Ltd.
  • Goodyear Tire and Rubber Co.
  • GRI Tires
  • Kumho Tire Co. Inc.
  • Maxam Tire
  • Michelin
  • Mitas
  • Nexen Tire Corp.
  • Nokian Tyres Plc
  • Pirelli and C. S.p.A.
  • Sailun Group
  • Shandong Linglong Tyre Co. Ltd.
  • Sumitomo Rubber Industries Ltd.
  • Titan International Inc.
  • Triangle Tire Co. Ltd.
  • Zhongce Rubber Group Co. Ltd.

Qualitative and quantitative analysis of companies has been conducted to help clients understand the wider business environment as well as the strengths and weaknesses of key industry players. Data is qualitatively analyzed to categorize companies as pure play, category-focused, industry-focused, and diversified; it is quantitatively analyzed to categorize companies as dominant, leading, strong, tentative, and weak.

Recent Development and News in Specialty tires market

  • In the Tires and Rubber industry, the implementation of European Union Deforestation Regulation mandates enforced strict plot-level traceability over raw material sourcing, directly impacting Specialty Tires supply chains by elevating systemic compliance costs and extending supplier qualification timelines by 15%.
  • The integration of continuous operational visibility frameworks using remote telemetry sensors accelerated predictive maintenance protocols for heavy vehicle fleets, lowering premature structural failure rates by 20% and reshaping Specialty Tires replacement cycles.
  • The expansion of localized tire recycling infrastructure utilizing hydrometallurgical processing optimized circular economy practices, enabling a 30% increase in critical material recovery metrics and stabilizing Specialty Tires production against raw commodity shortages.
  • The shift toward electrified vehicle architectures in heavy logistics operations altered torque delivery profiles, creating a need for resilient elastomers with enhanced heat buildup resistance and driving Specialty Tires innovation across heavy material handling networks.

Dive into Technavio’s robust research methodology, blending expert interviews, extensive data synthesis, and validated models for unparalleled Specialty Tires Market insights. See full methodology.

Market Scope
Page number 310
Base year 2025
Historic period 2020-2024
Forecast period 2026-2030
Growth momentum & CAGR Accelerate at a CAGR of 4.9%
Market growth 2026-2030 USD 13555.9 million
Market structure Fragmented
YoY growth 2025-2026(%) 4.7%
Key countries China, Japan, India, South Korea, Australia, Indonesia, US, Canada, Mexico, Germany, UK, France, Italy, Spain, The Netherlands, Brazil, Argentina, Chile, South Africa, Saudi Arabia, UAE, Israel and Turkey
Competitive landscape Leading Companies, Market Positioning of Companies, Competitive Strategies, and Industry Risks

Request Free Sample

Research Analyst Overview

  • The Specialty Tires ecosystem reveals profound structural shifts as industrial operators prioritize safety, durability, and operational efficiency across harsh deployment zones. Continuous usage under extreme payloads demands specialized engineering, driving mass utilization of reinforced carcass designs that stabilize heavy equipment across unstable terrain.
  • Site administrators deploying off-road radial construction frameworks consistently experience superior shock absorption and traction retention, fundamentally altering legacy replacement protocols. The integration of advanced tread compounds specifically mitigates thermal degradation, directly expanding the functional longevity of high-strain machinery. Connecting digital telematics to physical assets fundamentally transforms fleet maintenance strategies.
  • Facilities utilizing predictive wear analytics report a 26% reduction in catastrophic blowout incidents, yielding substantial workflow improvements and lowering overall maintenance overhead. Incorporating cut resistant sidewalls prevents abrasive damage during severe extraction operations, ensuring continuous structural integrity. Furthermore, deploying solid flat-free construction components in high-debris industrial zones eliminates puncture risks entirely.
  • These targeted equipment optimizations reshape supply chain budgeting, allowing procurement directors to align asset lifecycle management with rigorous operational compliance mandates and elevated productivity thresholds.

What are the Key Data Covered in this Specialty Tires Market Research and Growth Report?

  • What is the expected growth of the Specialty Tires Market between 2026 and 2030?

    • USD 13.56 billion, at a CAGR of 4.9%

  • What segmentation does the market report cover?

    • The report is segmented by Application (Mining and construction, Agriculture, Aircraft, and Others), Type (Radial tires, Bias-ply tires, and Solid tires), Material (Natural rubber, Synthetic rubber, Steel and cord reinforced, and Composite materials) and Geography (APAC, North America, Europe, South America, Middle East and Africa)

  • Which regions are analyzed in the report?

    • APAC, North America, Europe, South America and Middle East and Africa

  • What are the key growth drivers and market challenges?

    • Advancing VF and IF agricultural tire technologies for soil protection, Stringent EUDR traceability requirements for natural rubber sourcing

  • Who are the major players in the Specialty Tires Market?

    • Balkrishna Industries Ltd., Bridgestone Corp., Carlstar Group, Continental AG, Giti Tire Pte. Ltd., Goodyear Tire and Rubber Co., GRI Tires, Kumho Tire Co. Inc., Maxam Tire, Michelin, Mitas, Nexen Tire Corp., Nokian Tyres Plc, Pirelli and C. S.p.A., Sailun Group, Shandong Linglong Tyre Co. Ltd., Sumitomo Rubber Industries Ltd., Titan International Inc., Triangle Tire Co. Ltd. and Zhongce Rubber Group Co. Ltd.

Market Research Insights

  • Industrial operators increasingly prioritize extreme operating environments to test asset endurance and optimize lifecycle performance optimization. By deploying connected monitoring frameworks, fleet managers achieve a 22% reduction in unplanned maintenance overhead, directly preserving crucial capital resources. Incorporating advanced structural frameworks ensures optimal ground contact, maximizing traction efficiency while lowering fuel consumption requirements across heavy logistics operations by 18%.
  • The shift toward intelligent, sensor-equipped assets supports comprehensive decarbonization program compliance metrics, improving sustainability reporting accuracy by over 30%. This transformation equips procurement directors with transparent operational data, compressing expenditure timelines and ensuring that specialized handling equipment maximizes continuous uptime during intensive production cycles.

We can help! Our analysts can customize this specialty tires market research report to meet your requirements.

Get in touch

1. Executive Summary

1.1 Market overview

Executive Summary - Chart on Market Overview
Executive Summary - Data Table on Market Overview
Executive Summary - Chart on Global Market Characteristics
Executive Summary - Chart on Market by Geography
Executive Summary - Chart on Market Segmentation by Application
Executive Summary - Chart on Market Segmentation by Type
Executive Summary - Chart on Market Segmentation by Material
Executive Summary - Chart on Incremental Growth
Executive Summary - Data Table on Incremental Growth
Executive Summary - Chart on Company Market Positioning

2. Technavio Analysis

2.1 Analysis of price sensitivity, lifecycle, customer purchase basket, adoption rates, and purchase criteria

2.2 Criticality of inputs and Factors of differentiation

Chart on Overview on criticality of inputs and factors of differentiation

2.3 Factors of disruption

Chart on Overview on factors of disruption

2.4 Impact of drivers and challenges

Chart on Impact of drivers and challenges in 2025 and 2030

3. Market Landscape

3.1 Market ecosystem

Chart on Parent Market
Data Table on - Parent Market

3.2 Market characteristics

Chart on Market characteristics analysis

3.3 Value chain analysis

Chart on Value chain analysis

4. Market Sizing

4.1 Market definition

Data Table on Offerings of companies included in the market definition

4.2 Market segment analysis

Market segments

4.3 Market size 2025

4.4 Market outlook: Forecast for 2025-2030

Chart on Global - Market size and forecast 2025-2030 ($ million)
Data Table on Global - Market size and forecast 2025-2030 ($ million)
Chart on Global Market: Year-over-year growth 2025-2030 (%)
Data Table on Global Market: Year-over-year growth 2025-2030 (%)

5. Historic Market Size

5.1 Global Specialty Tires Market 2020 - 2024

Historic Market Size - Data Table on Global Specialty Tires Market 2020 - 2024 ($ million)

5.2 Application segment analysis 2020 - 2024

Historic Market Size - Application Segment 2020 - 2024 ($ million)

5.3 Type segment analysis 2020 - 2024

Historic Market Size - Type Segment 2020 - 2024 ($ million)

5.4 Material segment analysis 2020 - 2024

Historic Market Size - Material Segment 2020 - 2024 ($ million)

5.5 Geography segment analysis 2020 - 2024

Historic Market Size - Geography Segment 2020 - 2024 ($ million)

5.6 Country segment analysis 2020 - 2024

Historic Market Size - Country Segment 2020 - 2024 ($ million)

6. Qualitative Analysis

6.1 Impact of AI on global specialty tires market

6.2 Impact of geopolitical conflicts on global specialty tires market

7. Five Forces Analysis

7.1 Five forces summary

Five forces analysis - Comparison between 2025 and 2030

7.2 Bargaining power of buyers

Bargaining power of buyers - Impact of key factors 2025 and 2030

7.3 Bargaining power of suppliers

Bargaining power of suppliers - Impact of key factors in 2025 and 2030

7.4 Threat of new entrants

Threat of new entrants - Impact of key factors in 2025 and 2030

7.5 Threat of substitutes

Threat of substitutes - Impact of key factors in 2025 and 2030

7.6 Threat of rivalry

Threat of rivalry - Impact of key factors in 2025 and 2030

7.7 Market condition

Chart on Market condition - Five forces 2025 and 2030

8. Market Segmentation by Application

8.1 Market segments

Chart on Application - Market share 2025-2030 (%)
Data Table on Application - Market share 2025-2030 (%)

8.2 Comparison by Application

Chart on Comparison by Application
Data Table on Comparison by Application

8.3 Mining and construction - Market size and forecast 2025-2030

Chart on Mining and construction - Market size and forecast 2025-2030 ($ million)
Data Table on Mining and construction - Market size and forecast 2025-2030 ($ million)
Chart on Mining and construction - Year-over-year growth 2025-2030 (%)
Data Table on Mining and construction - Year-over-year growth 2025-2030 (%)

8.4 Agriculture - Market size and forecast 2025-2030

Chart on Agriculture - Market size and forecast 2025-2030 ($ million)
Data Table on Agriculture - Market size and forecast 2025-2030 ($ million)
Chart on Agriculture - Year-over-year growth 2025-2030 (%)
Data Table on Agriculture - Year-over-year growth 2025-2030 (%)

8.5 Aircraft - Market size and forecast 2025-2030

Chart on Aircraft - Market size and forecast 2025-2030 ($ million)
Data Table on Aircraft - Market size and forecast 2025-2030 ($ million)
Chart on Aircraft - Year-over-year growth 2025-2030 (%)
Data Table on Aircraft - Year-over-year growth 2025-2030 (%)

8.6 Others - Market size and forecast 2025-2030

Chart on Others - Market size and forecast 2025-2030 ($ million)
Data Table on Others - Market size and forecast 2025-2030 ($ million)
Chart on Others - Year-over-year growth 2025-2030 (%)
Data Table on Others - Year-over-year growth 2025-2030 (%)

8.7 Market opportunity by Application

Market opportunity by Application ($ million)
Data Table on Market opportunity by Application ($ million)

9. Market Segmentation by Type

9.1 Market segments

Chart on Type - Market share 2025-2030 (%)
Data Table on Type - Market share 2025-2030 (%)

9.2 Comparison by Type

Chart on Comparison by Type
Data Table on Comparison by Type

9.3 Radial tires - Market size and forecast 2025-2030

Chart on Radial tires - Market size and forecast 2025-2030 ($ million)
Data Table on Radial tires - Market size and forecast 2025-2030 ($ million)
Chart on Radial tires - Year-over-year growth 2025-2030 (%)
Data Table on Radial tires - Year-over-year growth 2025-2030 (%)

9.4 Bias-ply tires - Market size and forecast 2025-2030

Chart on Bias-ply tires - Market size and forecast 2025-2030 ($ million)
Data Table on Bias-ply tires - Market size and forecast 2025-2030 ($ million)
Chart on Bias-ply tires - Year-over-year growth 2025-2030 (%)
Data Table on Bias-ply tires - Year-over-year growth 2025-2030 (%)

9.5 Solid tires - Market size and forecast 2025-2030

Chart on Solid tires - Market size and forecast 2025-2030 ($ million)
Data Table on Solid tires - Market size and forecast 2025-2030 ($ million)
Chart on Solid tires - Year-over-year growth 2025-2030 (%)
Data Table on Solid tires - Year-over-year growth 2025-2030 (%)

9.6 Market opportunity by Type

Market opportunity by Type ($ million)
Data Table on Market opportunity by Type ($ million)

10. Market Segmentation by Material

10.1 Market segments

Chart on Material - Market share 2025-2030 (%)
Data Table on Material - Market share 2025-2030 (%)

10.2 Comparison by Material

Chart on Comparison by Material
Data Table on Comparison by Material

10.3 Natural rubber - Market size and forecast 2025-2030

Chart on Natural rubber - Market size and forecast 2025-2030 ($ million)
Data Table on Natural rubber - Market size and forecast 2025-2030 ($ million)
Chart on Natural rubber - Year-over-year growth 2025-2030 (%)
Data Table on Natural rubber - Year-over-year growth 2025-2030 (%)

10.4 Synthetic rubber - Market size and forecast 2025-2030

Chart on Synthetic rubber - Market size and forecast 2025-2030 ($ million)
Data Table on Synthetic rubber - Market size and forecast 2025-2030 ($ million)
Chart on Synthetic rubber - Year-over-year growth 2025-2030 (%)
Data Table on Synthetic rubber - Year-over-year growth 2025-2030 (%)

10.5 Steel and cord reinforced - Market size and forecast 2025-2030

Chart on Steel and cord reinforced - Market size and forecast 2025-2030 ($ million)
Data Table on Steel and cord reinforced - Market size and forecast 2025-2030 ($ million)
Chart on Steel and cord reinforced - Year-over-year growth 2025-2030 (%)
Data Table on Steel and cord reinforced - Year-over-year growth 2025-2030 (%)

10.6 Composite materials - Market size and forecast 2025-2030

Chart on Composite materials - Market size and forecast 2025-2030 ($ million)
Data Table on Composite materials - Market size and forecast 2025-2030 ($ million)
Chart on Composite materials - Year-over-year growth 2025-2030 (%)
Data Table on Composite materials - Year-over-year growth 2025-2030 (%)

10.7 Market opportunity by Material

Market opportunity by Material ($ million)
Data Table on Market opportunity by Material ($ million)

11. Customer Landscape

11.1 Customer landscape overview

Analysis of price sensitivity, lifecycle, customer purchase basket, adoption rates, and purchase criteria

12. Geographic Landscape

12.1 Geographic segmentation

Chart on Market share by geography 2025-2030 (%)
Data Table on Market share by geography 2025-2030 (%)

12.2 Geographic comparison

Chart on Geographic comparison
Data Table on Geographic comparison

12.3 APAC - Market size and forecast 2025-2030

Chart on APAC - Market size and forecast 2025-2030 ($ million)
Data Table on APAC - Market size and forecast 2025-2030 ($ million)
Chart on APAC - Year-over-year growth 2025-2030 (%)
Data Table on APAC - Year-over-year growth 2025-2030 (%)
Chart on Regional Comparison - APAC
Data Table on Regional Comparison - APAC

12.3.1 China - Market size and forecast 2025-2030

Chart on China - Market size and forecast 2025-2030 ($ million)
Data Table on China - Market size and forecast 2025-2030 ($ million)
Chart on China - Year-over-year growth 2025-2030 (%)
Data Table on China - Year-over-year growth 2025-2030 (%)

12.3.2 Japan - Market size and forecast 2025-2030

Chart on Japan - Market size and forecast 2025-2030 ($ million)
Data Table on Japan - Market size and forecast 2025-2030 ($ million)
Chart on Japan - Year-over-year growth 2025-2030 (%)
Data Table on Japan - Year-over-year growth 2025-2030 (%)

12.3.3 India - Market size and forecast 2025-2030

Chart on India - Market size and forecast 2025-2030 ($ million)
Data Table on India - Market size and forecast 2025-2030 ($ million)
Chart on India - Year-over-year growth 2025-2030 (%)
Data Table on India - Year-over-year growth 2025-2030 (%)

12.3.4 South Korea - Market size and forecast 2025-2030

Chart on South Korea - Market size and forecast 2025-2030 ($ million)
Data Table on South Korea - Market size and forecast 2025-2030 ($ million)
Chart on South Korea - Year-over-year growth 2025-2030 (%)
Data Table on South Korea - Year-over-year growth 2025-2030 (%)

12.3.5 Australia - Market size and forecast 2025-2030

Chart on Australia - Market size and forecast 2025-2030 ($ million)
Data Table on Australia - Market size and forecast 2025-2030 ($ million)
Chart on Australia - Year-over-year growth 2025-2030 (%)
Data Table on Australia - Year-over-year growth 2025-2030 (%)

12.3.6 Indonesia - Market size and forecast 2025-2030

Chart on Indonesia - Market size and forecast 2025-2030 ($ million)
Data Table on Indonesia - Market size and forecast 2025-2030 ($ million)
Chart on Indonesia - Year-over-year growth 2025-2030 (%)
Data Table on Indonesia - Year-over-year growth 2025-2030 (%)

12.4 North America - Market size and forecast 2025-2030

Chart on North America - Market size and forecast 2025-2030 ($ million)
Data Table on North America - Market size and forecast 2025-2030 ($ million)
Chart on North America - Year-over-year growth 2025-2030 (%)
Data Table on North America - Year-over-year growth 2025-2030 (%)
Chart on Regional Comparison - North America
Data Table on Regional Comparison - North America

12.4.1 US - Market size and forecast 2025-2030

Chart on US - Market size and forecast 2025-2030 ($ million)
Data Table on US - Market size and forecast 2025-2030 ($ million)
Chart on US - Year-over-year growth 2025-2030 (%)
Data Table on US - Year-over-year growth 2025-2030 (%)

12.4.2 Canada - Market size and forecast 2025-2030

Chart on Canada - Market size and forecast 2025-2030 ($ million)
Data Table on Canada - Market size and forecast 2025-2030 ($ million)
Chart on Canada - Year-over-year growth 2025-2030 (%)
Data Table on Canada - Year-over-year growth 2025-2030 (%)

12.4.3 Mexico - Market size and forecast 2025-2030

Chart on Mexico - Market size and forecast 2025-2030 ($ million)
Data Table on Mexico - Market size and forecast 2025-2030 ($ million)
Chart on Mexico - Year-over-year growth 2025-2030 (%)
Data Table on Mexico - Year-over-year growth 2025-2030 (%)

12.5 Europe - Market size and forecast 2025-2030

Chart on Europe - Market size and forecast 2025-2030 ($ million)
Data Table on Europe - Market size and forecast 2025-2030 ($ million)
Chart on Europe - Year-over-year growth 2025-2030 (%)
Data Table on Europe - Year-over-year growth 2025-2030 (%)
Chart on Regional Comparison - Europe
Data Table on Regional Comparison - Europe

12.5.1 Germany - Market size and forecast 2025-2030

Chart on Germany - Market size and forecast 2025-2030 ($ million)
Data Table on Germany - Market size and forecast 2025-2030 ($ million)
Chart on Germany - Year-over-year growth 2025-2030 (%)
Data Table on Germany - Year-over-year growth 2025-2030 (%)

12.5.2 UK - Market size and forecast 2025-2030

Chart on UK - Market size and forecast 2025-2030 ($ million)
Data Table on UK - Market size and forecast 2025-2030 ($ million)
Chart on UK - Year-over-year growth 2025-2030 (%)
Data Table on UK - Year-over-year growth 2025-2030 (%)

12.5.3 France - Market size and forecast 2025-2030

Chart on France - Market size and forecast 2025-2030 ($ million)
Data Table on France - Market size and forecast 2025-2030 ($ million)
Chart on France - Year-over-year growth 2025-2030 (%)
Data Table on France - Year-over-year growth 2025-2030 (%)

12.5.4 Italy - Market size and forecast 2025-2030

Chart on Italy - Market size and forecast 2025-2030 ($ million)
Data Table on Italy - Market size and forecast 2025-2030 ($ million)
Chart on Italy - Year-over-year growth 2025-2030 (%)
Data Table on Italy - Year-over-year growth 2025-2030 (%)

12.5.5 Spain - Market size and forecast 2025-2030

Chart on Spain - Market size and forecast 2025-2030 ($ million)
Data Table on Spain - Market size and forecast 2025-2030 ($ million)
Chart on Spain - Year-over-year growth 2025-2030 (%)
Data Table on Spain - Year-over-year growth 2025-2030 (%)

12.5.6 The Netherlands - Market size and forecast 2025-2030

Chart on The Netherlands - Market size and forecast 2025-2030 ($ million)
Data Table on The Netherlands - Market size and forecast 2025-2030 ($ million)
Chart on The Netherlands - Year-over-year growth 2025-2030 (%)
Data Table on The Netherlands - Year-over-year growth 2025-2030 (%)

12.6 South America - Market size and forecast 2025-2030

Chart on South America - Market size and forecast 2025-2030 ($ million)
Data Table on South America - Market size and forecast 2025-2030 ($ million)
Chart on South America - Year-over-year growth 2025-2030 (%)
Data Table on South America - Year-over-year growth 2025-2030 (%)
Chart on Regional Comparison - South America
Data Table on Regional Comparison - South America

12.6.1 Brazil - Market size and forecast 2025-2030

Chart on Brazil - Market size and forecast 2025-2030 ($ million)
Data Table on Brazil - Market size and forecast 2025-2030 ($ million)
Chart on Brazil - Year-over-year growth 2025-2030 (%)
Data Table on Brazil - Year-over-year growth 2025-2030 (%)

12.6.2 Argentina - Market size and forecast 2025-2030

Chart on Argentina - Market size and forecast 2025-2030 ($ million)
Data Table on Argentina - Market size and forecast 2025-2030 ($ million)
Chart on Argentina - Year-over-year growth 2025-2030 (%)
Data Table on Argentina - Year-over-year growth 2025-2030 (%)

12.6.3 Chile - Market size and forecast 2025-2030

Chart on Chile - Market size and forecast 2025-2030 ($ million)
Data Table on Chile - Market size and forecast 2025-2030 ($ million)
Chart on Chile - Year-over-year growth 2025-2030 (%)
Data Table on Chile - Year-over-year growth 2025-2030 (%)

12.7 Middle East and Africa - Market size and forecast 2025-2030

Chart on Middle East and Africa - Market size and forecast 2025-2030 ($ million)
Data Table on Middle East and Africa - Market size and forecast 2025-2030 ($ million)
Chart on Middle East and Africa - Year-over-year growth 2025-2030 (%)
Data Table on Middle East and Africa - Year-over-year growth 2025-2030 (%)
Chart on Regional Comparison - Middle East and Africa
Data Table on Regional Comparison - Middle East and Africa

12.7.1 South Africa - Market size and forecast 2025-2030

Chart on South Africa - Market size and forecast 2025-2030 ($ million)
Data Table on South Africa - Market size and forecast 2025-2030 ($ million)
Chart on South Africa - Year-over-year growth 2025-2030 (%)
Data Table on South Africa - Year-over-year growth 2025-2030 (%)

12.7.2 Saudi Arabia - Market size and forecast 2025-2030

Chart on Saudi Arabia - Market size and forecast 2025-2030 ($ million)
Data Table on Saudi Arabia - Market size and forecast 2025-2030 ($ million)
Chart on Saudi Arabia - Year-over-year growth 2025-2030 (%)
Data Table on Saudi Arabia - Year-over-year growth 2025-2030 (%)

12.7.3 UAE - Market size and forecast 2025-2030

Chart on UAE - Market size and forecast 2025-2030 ($ million)
Data Table on UAE - Market size and forecast 2025-2030 ($ million)
Chart on UAE - Year-over-year growth 2025-2030 (%)
Data Table on UAE - Year-over-year growth 2025-2030 (%)

12.7.4 Israel - Market size and forecast 2025-2030

Chart on Israel - Market size and forecast 2025-2030 ($ million)
Data Table on Israel - Market size and forecast 2025-2030 ($ million)
Chart on Israel - Year-over-year growth 2025-2030 (%)
Data Table on Israel - Year-over-year growth 2025-2030 (%)

12.7.5 Turkey - Market size and forecast 2025-2030

Chart on Turkey - Market size and forecast 2025-2030 ($ million)
Data Table on Turkey - Market size and forecast 2025-2030 ($ million)
Chart on Turkey - Year-over-year growth 2025-2030 (%)
Data Table on Turkey - Year-over-year growth 2025-2030 (%)

12.8 Market opportunity by geography

Market opportunity by geography ($ million)
Data Tables on Market opportunity by geography ($ million)

13. Drivers, Challenges, and Opportunity

13.1 Market drivers

Advancing VF and IF agricultural tire technologies for soil protection
Expanding mining output for copper and critical minerals
Increasing electrification of mining and construction equipment fleets

13.2 Market challenges

Stringent EUDR traceability requirements for natural rubber sourcing
Rising antidumping duties and US tariffs on imported OTR tires
Shortage of skilled OTR tire service technicians at mine sites

13.3 Impact of drivers and challenges

Impact of drivers and challenges in 2025 and 2030

13.4 Market opportunities

Increasing use of connected tire monitoring systems in mining haul fleets
Expanding OTR tire recycling infrastructure at major mining hubs
Accelerating consolidation of OTR tire businesses through acquisitions

14. Competitive Landscape

14.1 Overview

14.2

Overview on criticality of inputs and factors of differentiation

14.3 Landscape disruption

Overview on factors of disruption

14.4 Industry risks

Impact of key risks on business

15. Competitive Analysis

15.1 Companies profiled

Companies covered

15.2 Company ranking index

15.3 Market positioning of companies

Matrix on companies position and classification

15.4 Balkrishna Industries Ltd.

Balkrishna Industries Ltd. - Overview
Balkrishna Industries Ltd. - Product / Service
Balkrishna Industries Ltd. - Key offerings
SWOT

15.5 Bridgestone Corp.

Bridgestone Corp. - Overview
Bridgestone Corp. - Business segments
Bridgestone Corp. - Key offerings
Bridgestone Corp. - Segment focus
SWOT

15.6 Continental AG

Continental AG - Overview
Continental AG - Business segments
Continental AG - Key news
Continental AG - Key offerings
Continental AG - Segment focus
SWOT

15.7 Goodyear Tire and Rubber Co.

Goodyear Tire and Rubber Co. - Overview
Goodyear Tire and Rubber Co. - Business segments
Goodyear Tire and Rubber Co. - Key offerings
Goodyear Tire and Rubber Co. - Segment focus
SWOT

15.8 Kumho Tire Co. Inc.

Kumho Tire Co. Inc. - Overview
Kumho Tire Co. Inc. - Product / Service
Kumho Tire Co. Inc. - Key offerings
SWOT

15.9 Michelin

Michelin - Overview
Michelin - Business segments
Michelin - Key offerings
Michelin - Segment focus
SWOT

15.10 Nexen Tire Corp.

Nexen Tire Corp. - Overview
Nexen Tire Corp. - Product / Service
Nexen Tire Corp. - Key offerings
SWOT

15.11 Nokian Tyres Plc

Nokian Tyres Plc - Overview
Nokian Tyres Plc - Business segments
Nokian Tyres Plc - Key offerings
Nokian Tyres Plc - Segment focus
SWOT

15.12 Pirelli and C. S.p.A.

Pirelli and C. S.p.A. - Overview
Pirelli and C. S.p.A. - Product / Service
Pirelli and C. S.p.A. - Key offerings
SWOT

15.13 Sailun Group

Sailun Group - Overview
Sailun Group - Product / Service
Sailun Group - Key offerings
SWOT

15.14 Shandong Linglong Tyre Co. Ltd.

Shandong Linglong Tyre Co. Ltd. - Overview
Shandong Linglong Tyre Co. Ltd. - Business segments
Shandong Linglong Tyre Co. Ltd. - Key offerings
Shandong Linglong Tyre Co. Ltd. - Segment focus
SWOT

15.15 Sumitomo Rubber Industries Ltd.

Sumitomo Rubber Industries Ltd. - Overview
Sumitomo Rubber Industries Ltd. - Product / Service
Sumitomo Rubber Industries Ltd. - Key offerings
SWOT

15.16 Titan International Inc.

Titan International Inc. - Overview
Titan International Inc. - Business segments
Titan International Inc. - Key offerings
Titan International Inc. - Segment focus
SWOT

15.17 Triangle Tire Co. Ltd.

Triangle Tire Co. Ltd. - Overview
Triangle Tire Co. Ltd. - Product / Service
Triangle Tire Co. Ltd. - Key offerings
SWOT

15.18 Zhongce Rubber Group Co. Ltd.

Zhongce Rubber Group Co. Ltd. - Overview
Zhongce Rubber Group Co. Ltd. - Product / Service
Zhongce Rubber Group Co. Ltd. - Key offerings
SWOT

16. Appendix

16.1 Scope of the report

Market definition
Objectives
Notes and caveats

16.2 Inclusions and exclusions checklist

Inclusions checklist
Exclusions checklist

16.3 Currency conversion rates for US$

16.4 Research methodology

16.5 Data procurement

Information sources

16.6 Data validation

16.7 Validation techniques employed for market sizing

16.8 Data synthesis

16.9 360 degree market analysis

16.10 List of abbreviations

Research Methodology

Technavio presents a detailed picture of the market by way of study, synthesis, and summation of data from multiple sources. The analysts have presented the various facets of the market with a particular focus on identifying the key industry influencers. The data thus presented is comprehensive, reliable, and the result of extensive research, both primary and secondary.

INFORMATION SOURCES

Primary sources

  • Manufacturers and suppliers
  • Channel partners
  • Industry experts
  • Strategic decision makers

Secondary sources

  • Industry journals and periodicals
  • Government data
  • Financial reports of key industry players
  • Historical data
  • Press releases

DATA ANALYSIS

Data Synthesis

  • Collation of data
  • Estimation of key figures
  • Analysis of derived insights

Data Validation

  • Triangulation with data models
  • Reference against proprietary databases
  • Corroboration with industry experts

REPORT WRITING

Qualitative

  • Market drivers
  • Market challenges
  • Market trends
  • Five forces analysis

Quantitative

  • Market size and forecast
  • Market segmentation
  • Geographical insights
  • Competitive landscape

Interested in this report?

Get your sample now to see our research methodology and insights!

Download Now

Frequently Asked Questions

Specialty Tires market growth will increase by USD 13555.9 million during 2026-2030.

The Specialty Tires market is expected to grow at a CAGR of 4.9% during 2026-2030.

Specialty Tires market is segmented by Application (Mining and construction, Agriculture, Aircraft, Others) Type (Radial tires, Bias-ply tires, Solid tires) Material (Natural rubber, Synthetic rubber, Steel and cord reinforced, Composite materials)

Balkrishna Industries Ltd., Bridgestone Corp., Carlstar Group, Continental AG, Giti Tire Pte. Ltd., Goodyear Tire and Rubber Co., GRI Tires, Kumho Tire Co. Inc., Maxam Tire, Michelin, Mitas, Nexen Tire Corp., Nokian Tyres Plc, Pirelli and C. S.p.A., Sailun Group, Shandong Linglong Tyre Co. Ltd., Sumitomo Rubber Industries Ltd., Titan International Inc., Triangle Tire Co. Ltd., Zhongce Rubber Group Co. Ltd. are a few of the key vendors in the Specialty Tires market.

APAC will register the highest growth rate of 50.4% among the other regions. Therefore, the Specialty Tires market in APAC is expected to garner significant business opportunities for the vendors during the forecast period.

China, Japan, India, South Korea, Australia, Indonesia, US, Canada, Mexico, Germany, UK, France, Italy, Spain, The Netherlands, Brazil, Argentina, Chile, South Africa, Saudi Arabia, UAE, Israel, Turkey

  • Advancing VF and IF agricultural tire technologies for soil protection is the driving factor this market.

The Specialty Tires market vendors should focus on grabbing business opportunities from the Application segment as it accounted for the largest market share in the base year.
RIA - Research AI Assistant
Ask RIA