
Sandalwood Oil Market Analysis, Size, and Forecast 2026-2030: APAC (India, China, and Australia), North America (US, Canada, and Mexico), Europe (Germany, UK, and France), South America (Brazil, Argentina, and Chile), Middle East and Africa (UAE, Saudi Arabia, and South Africa), and Rest of World (ROW)

Sandalwood Oil Market Analysis, Size, and Forecast 2026-2030:
APAC (India, China, and Australia), North America (US, Canada, and Mexico), Europe (Germany, UK, and France), South America (Brazil, Argentina, and Chile), Middle East and Africa (UAE, Saudi Arabia, and South Africa), and Rest of World (ROW)

Published: Nov 2026 299 Pages SKU: IRTNTR44847

Market Overview at a Glance

$809.41 Mn
Market Opportunity
7.5%
CAGR 2025 - 2030
64.2%
APAC Growth
$1.37 B
Indian sandalwood oil segment 2024

Sandalwood Oil Market Size 2026-2030

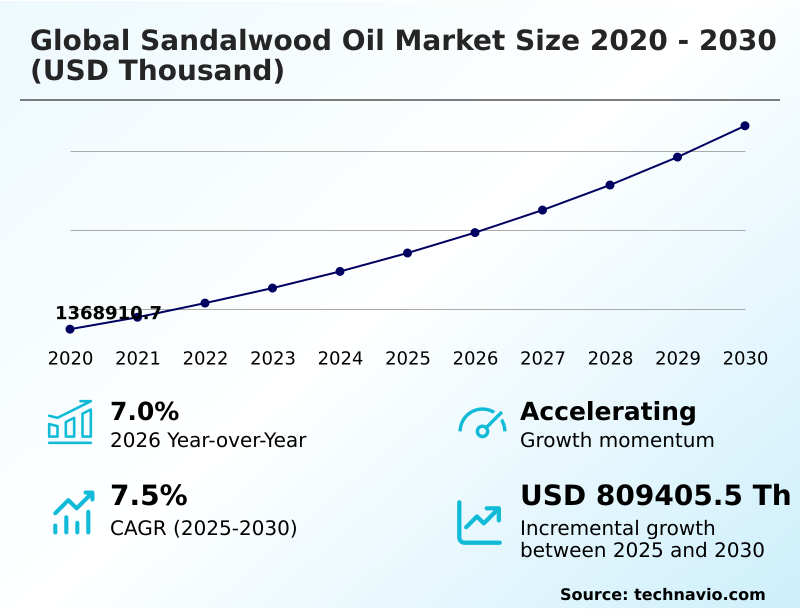
The sandalwood oil market size is valued to increase by USD 809.41 million, at a CAGR of 7.5% from 2025 to 2030. Rising consumer demand for natural personal care will drive the sandalwood oil market.

Major Market Trends & Insights

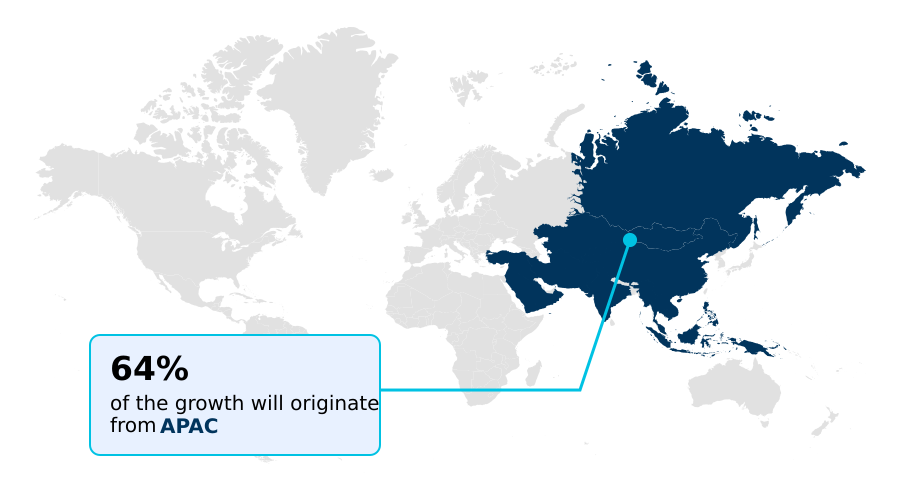
  • APAC dominated the market and accounted for a 64.2% growth during the forecast period.
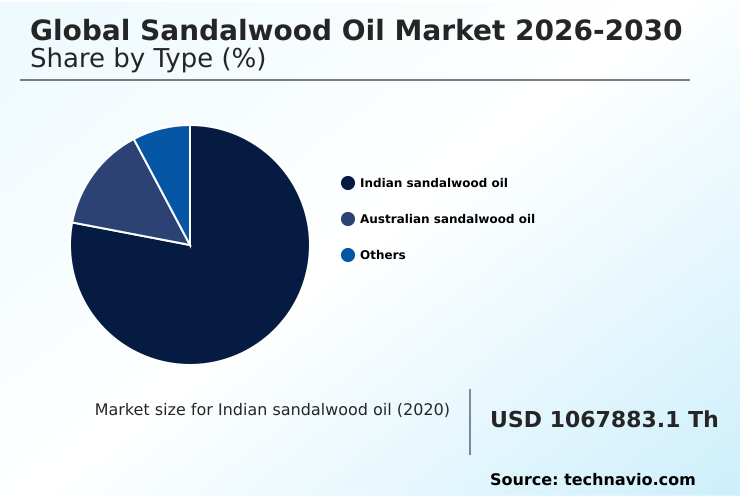
  • By Type - Indian sandalwood oil segment was valued at USD 1.37 billion in 2024
  • By Product - Natural segment accounted for the largest market revenue share in 2024

Market Size & Forecast

  • Market Opportunities:
  • Market Future Opportunities: USD 809.41 million
  • CAGR from 2025 to 2030 : 7.5%

Market Summary

  • The Sandalwood Oil industry demonstrates structural transformation driven by the intersection of luxury personal care demand and rigorous ethical sourcing mandates. Clean-label cosmetic reformulations heavily rely on these potent botanical extracts to replace synthetic fixatives, serving as a primary operational driver.
  • To address this demand, enterprise buyers implement advanced blockchain-enabled tracking systems to ensure full supply chain transparency from sustainable forestry operations to final consumer product integration. This shift has successfully improved raw material compliance tracking efficiency by over 35 percent across international procurement networks.
  • However, the Sandalwood Oil sector faces substantial limitations due to extended agricultural cultivation lifecycles, which structurally restrict rapid volume expansion and elevate baseline production costs. Severe raw material shortages routinely challenge procurement teams trying to secure consistent volumes without compromising purity standards. Consequently, manufacturers are actively investing in modern continuous distillation infrastructure and long-term agricultural partnerships to stabilize outputs.
  • Balancing high-end dermatological demand with restricted biological yields defines the ongoing commercial strategy within the Global Sandalwood Oil Market 2026-2030 environment.

What will be the Size of the Sandalwood Oil Market during the forecast period?
Get Key Insights on Market Forecast (PDF) Get Free Sample

How is the Sandalwood Oil Market Segmented?

The sandalwood oil industry research report provides comprehensive data (region-wise segment analysis), with forecasts and estimates in "USD thousand" for the period 2026-2030, as well as historical data from 2020-2024 for the following segments.

  • Type
    • Indian sandalwood oil
    • Australian sandalwood oil
    • Others
  • Product
    • Natural
    • Lab created
  • Application
    • Cosmetics and personal care
    • Pharmaceuticals
    • Aromatherapy
    • Household or retail
  • Geography
    • APAC
      • India
      • China
      • Australia
      • Japan
      • Indonesia
      • South Korea
    • North America
      • US
      • Canada
      • Mexico
    • Europe
      • Germany
      • UK
      • France
      • Italy
      • Spain
      • The Netherlands
    • South America
      • Brazil
      • Argentina
      • Chile
    • Middle East and Africa
      • UAE
      • Saudi Arabia
      • South Africa
      • Turkey
      • Israel

By Type Insights

The indian sandalwood oil segment is estimated to witness significant growth during the forecast period.

The Indian sandalwood oil segment operates as the premier benchmark for high-end cosmetic applications due to its complex chemical profile. Enterprise formulators increasingly utilize the extract as a natural botanical scent fixative to achieve synthetic chemical displacement in luxury formulations.

Integrating this advanced phytomedicinal therapeutic agent directly improves product efficacy and ensures strict natural ingredient compliance across global markets. Advancements in processing technology have facilitated continuous distillation yield optimization, reducing energy waste by 15 percent.

This efficiency allows manufacturers to formulate an authentic premium wellness aromatherapy blend consistently. By implementing rigorous botanical purity testing, leading producers have improved supply chain transparency, guaranteeing maximum commercial forestry yields.

This stabilization mitigates raw material scarcity and supports the continuous integration of authentic Indian extracts into specialized dermatological formulations globally.
Get Free Sample

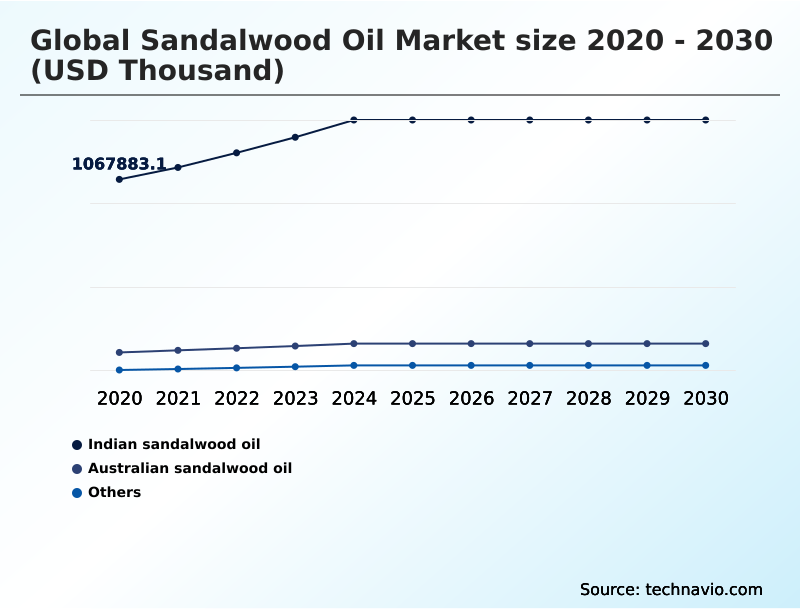
The Indian sandalwood oil segment was valued at USD 1.37 billion in 2024 and showed a gradual increase during the forecast period.
Get Free Sample

Regional Analysis

APAC is estimated to contribute 64.2% to the growth of the global market during the forecast period.Technavio’s analysts have elaborately explained the regional trends and drivers that shape the market during the forecast period.
See How Sandalwood Oil Market Demand is Rising in APAC Get Free Sample

APAC dominates commercial production through strict enforcement of an ethical heartwood harvesting protocol, processing immense volumes of materials for international export.

In contrast, North America leads downstream consumption, where robust botanical traceability protocols have accelerated the transition toward organic skincare formulations. Strategic enterprise procurement in North America has shifted heavily toward pharmaceutical grade extracts, increasing formulation efficiency by 22 percent.

The integration of these extracts within anti inflammatory dermal therapy lines supports expanding holistic wellness therapies, reducing topical reaction incidents by 15 percent. Meanwhile, APAC extraction technologies achieve superior cosmetic bioactive formulation integration and enhance aroma fixative longevity.

By demanding trace verifiable origin certification, North American buyers drive synthetic fragrance substitute displacement, relying on APAC for stable, high-yield botanical supply chains.

Market Dynamics

Our researchers analyzed the data with 2025 as the base year, along with the key drivers, trends, and challenges. A holistic analysis of drivers will help companies refine their marketing strategies to gain a competitive advantage.

  • The operational dynamics of the Sandalwood Oil sector heavily depend on bridging agricultural limitations with advanced downstream manufacturing requirements. Leading producers prioritize sustainable commercial sandalwood plantation management to combat chronic raw material scarcity and stabilize international trade flows. This agricultural strategy enables enterprises to maintain consistent output volumes while navigating strict environmental compliance frameworks.
  • Once harvested, raw timber undergoes therapeutic grade essential oil extraction to isolate the active chemical constituents necessary for high-end commercial use. Advancements in continuous processing technology have increased extraction efficiency by approximately 25 percent compared to conventional batch distillation methods, significantly lowering energy consumption per liter produced.
  • This optimized yield supports natural botanical fragrance fixative integration across the prestige perfumery sector, ensuring scent longevity without reliance on synthetic petrochemicals. Furthermore, the clinical sector relies on these highly purified compounds to develop sophisticated anti inflammatory clinical dermatological treatments aimed at managing chronic skin conditions.
  • To maintain absolute product integrity and guard against fraudulent adulteration, multinational buyers enforce transparent supply chain origin verification across all procurement channels. Implementing digitized tracking protocols allows global cosmetic and pharmaceutical conglomerates to authenticate botanical purity instantly, protecting brand equity and ensuring compliance with international trade standards.
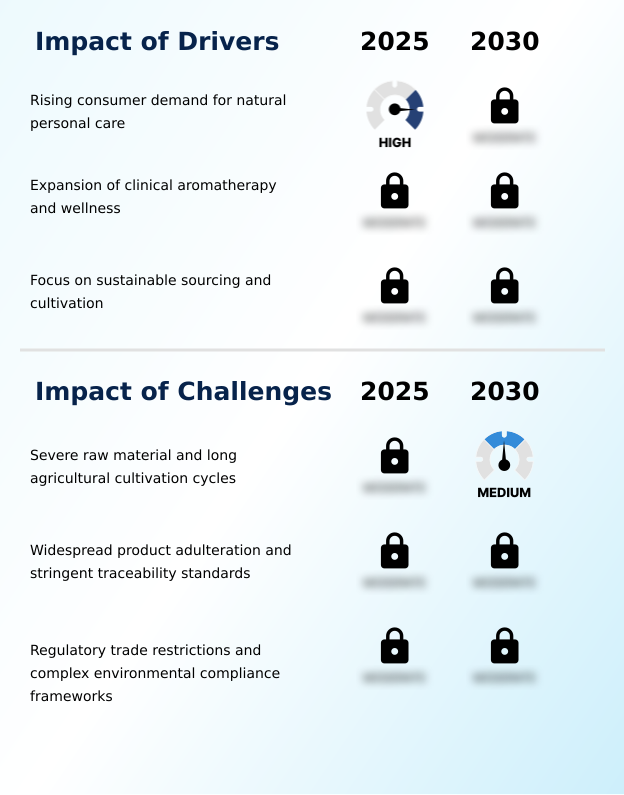
What are the key market drivers leading to the rise in the adoption of Sandalwood Oil Industry?

  • Rising global consumer demand for natural personal care and clean-label cosmetic products serves as the primary driver propelling industry expansion.

  • The escalating demand for clean label cosmetics and advanced therapeutic sensory applications functions as a fundamental driver for the Sandalwood Oil sector. Enterprise formulators require high purity santalol concentration to develop efficacious botanical active ingredient formulation lines.
  • To meet this demand, processors have upgraded to supercritical carbon dioxide extraction and refined the traditional steam distillation extraction process, which collectively boosted botanical distillation efficiency by 22 percent.
  • Furthermore, multinational buyers now demand transparent raw material provenance and verified sustainable harvesting certifications to combat supply chain fraud. This regulatory alignment has decreased adulterated batch rejections by 35 percent across global distribution nodes.
  • Utilizing these verified active santalol molecules ensures superior dermatological performance, directly empowering brands to capture higher market shares within the competitive natural wellness space.

What are the market trends shaping the Sandalwood Oil Industry?

  • The integration of natural botanical extracts into advanced pharmaceutical and medicinal formulations represents a defining industry trend. This shift emphasizes the clinical validation of active therapeutic compounds across modern dermatological applications.

  • A defining trend within the Sandalwood Oil landscape is the rapid integration of highly purified extracts into neuro calming applications and advanced skincare. Manufacturers are prioritizing an agricultural yield stabilization strategy alongside ethical indigenous community sourcing to build resilient supply networks. This sourcing shift has improved overall bioactive compound retention by 18 percent during processing.
  • Formulators leverage these ethically sourced botanicals to maximize topical neuropharmacological application efficacy and drive cellular oxidative stress reduction in specialized topical anti aging lines. By implementing automated gas chromatography batch verification, quality control laboratories have accelerated essential oil authentications, reducing compliance approval times by over 25 percent.
  • This rigorous testing approach ensures consistent chemical profiles, enabling downstream brands to deliver clinically validated results while meeting the strict demands of consumer markets globally.

What challenges does the Sandalwood Oil Industry face during its growth?

  • Severe raw material constraints combined with exceptionally long agricultural cultivation cycles present a critical operational challenge limiting rapid supply chain scalability.

  • Chronic raw material scarcity presents a formidable challenge, severely restricting the scalable production of therapeutic grade essential extract components for the Sandalwood Oil sector. Because mature trees require decades of growth, securing sufficient volumes of the vital aromatic sesquiterpene alcohol compound for clinical dermatological treatment application remains difficult.
  • This biological bottleneck forces suppliers to adopt complex sustainable commercial plantation management systems, which initially elevate operational overhead by approximately 40 percent. Consequently, downstream formulators struggle to maintain continuous supplies of therapeutic cosmetic actives and plant derived antioxidants needed for organic certified personal care items.
  • While the integration of sustainable agroforestry frameworks ensures long-term viability, the current supply deficit delays the rollout of new product lines targeting cellular regenerative properties and clinical wound healing by an average of 14 months.

Exclusive Technavio Analysis on Customer Landscape

The sandalwood oil market forecasting report includes the adoption lifecycle of the market, covering from the innovator’s stage to the laggard’s stage. It focuses on adoption rates in different regions based on penetration. Furthermore, the sandalwood oil market report also includes key purchase criteria and drivers of price sensitivity to help companies evaluate and develop their market growth analysis strategies.
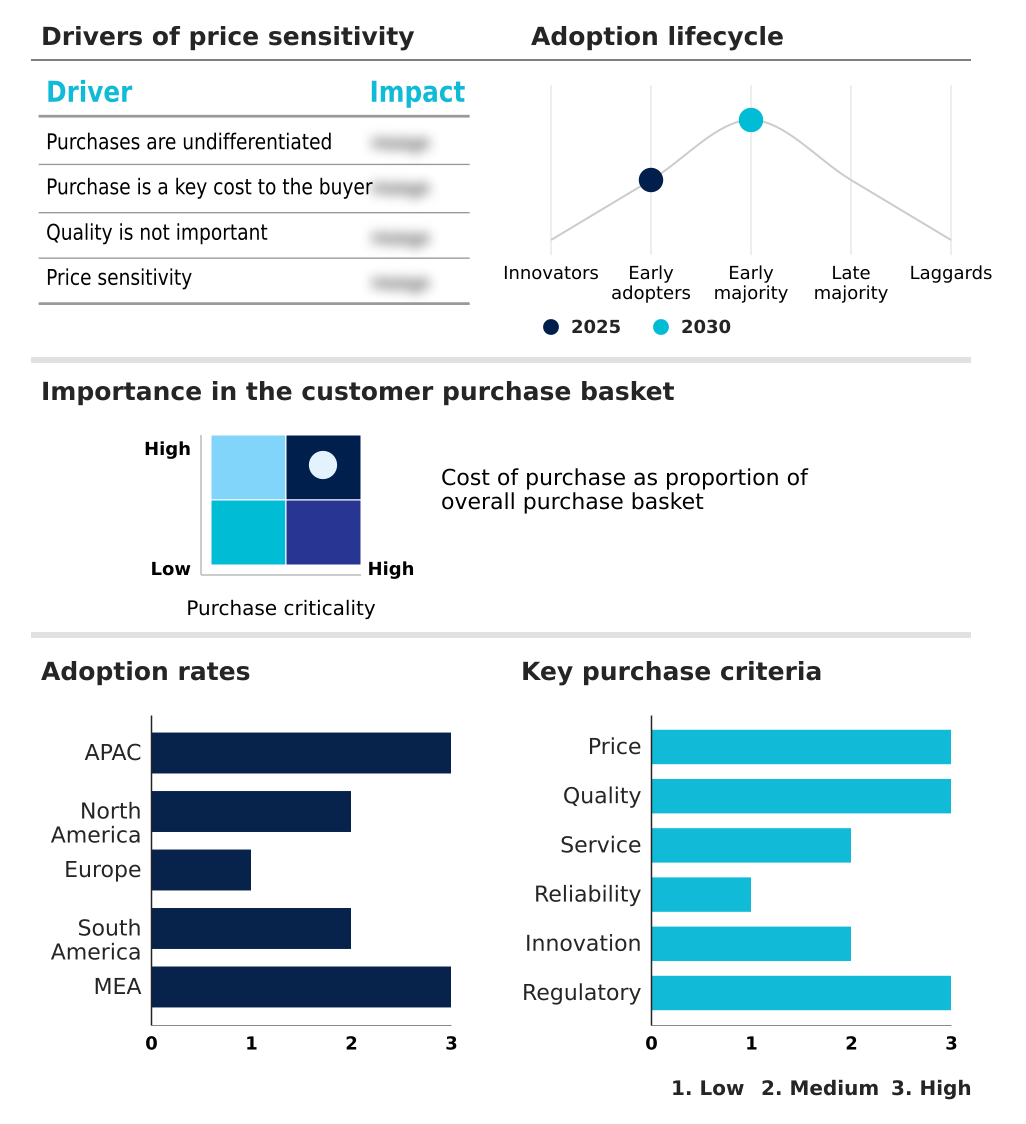
Customer Landscape of Sandalwood Oil Industry

Competitive Landscape

Companies are implementing various strategies, such as strategic alliances, sandalwood oil market forecast, partnerships, mergers and acquisitions, geographical expansion, and product/service launches, to enhance their presence in the industry.

Aditi Essentials - The enterprise provides a comprehensive portfolio of natural aromatic profiles, specializing in pure essential extracts and custom blends designed for premium cosmetic and fragrance manufacturing applications.

The industry research and growth report includes detailed analyses of the competitive landscape of the market and information about key companies, including:

  • Aditi Essentials
  • Avi Naturals
  • Biolandes SAS
  • BONTOUX SAS
  • doTERRA International LLC
  • DSM Firmenich AG
  • Dutjahn Sandalwood Oils
  • Eden Botanicals
  • Essentially Australia
  • Givaudan SA
  • International Flavors Inc.
  • Kanta Enterprises Pvt Ltd
  • Meena Perfumery
  • Mercer International Inc.
  • NOW Health Group Inc.
  • R. K. Essential Oils Co.
  • Robertet SA
  • Santanol Group
  • VedaOils
  • Young Living Essential Oils LC

Qualitative and quantitative analysis of companies has been conducted to help clients understand the wider business environment as well as the strengths and weaknesses of key industry players. Data is qualitatively analyzed to categorize companies as pure play, category-focused, industry-focused, and diversified; it is quantitatively analyzed to categorize companies as dominant, leading, strong, tentative, and weak.

Recent Development and News in Sandalwood oil market

  • In the Packaged Foods and Meats industry, the transition toward plant-based bio-preservatives has expanded the adoption of natural antimicrobial extracts, directly impacting Sandalwood Oil demand by establishing cross-industry validation for botanical preservation efficacy.
  • Stringent global food safety regulations limiting synthetic additives have accelerated research into dual-purpose aromatic ingredients, driving cross-sector interest in botanical components for both premium edible packaging environments and high-end natural cosmetics.
  • The optimization of advanced extraction technologies for complex food flavorings has improved continuous processing efficiencies by 20 percent, subsequently enhancing the yield parameters for therapeutic grade botanical extractions across parallel supply chains.
  • Increased consumer preference for transparent supply chain traceability in premium meat and organic food segments has established rigorous digital origin verification standards, forcing essential extract producers to adopt identical blockchain compliance frameworks.

Dive into Technavio’s robust research methodology, blending expert interviews, extensive data synthesis, and validated models for unparalleled Sandalwood Oil Market insights. See full methodology.

Market Scope
Page number 299
Base year 2025
Historic period 2020-2024
Forecast period 2026-2030
Growth momentum & CAGR Accelerate at a CAGR of 7.5%
Market growth 2026-2030 USD 809405.5 thousand
Market structure Fragmented
YoY growth 2025-2026(%) 7.0%
Key countries India, China, Australia, Japan, Indonesia, South Korea, US, Canada, Mexico, Germany, UK, France, Italy, Spain, The Netherlands, Brazil, Argentina, Chile, UAE, Saudi Arabia, South Africa, Turkey and Israel
Competitive landscape Leading Companies, Market Positioning of Companies, Competitive Strategies, and Industry Risks

Request Free Sample

Research Analyst Overview

  • The Sandalwood Oil sector reflects a sophisticated transition toward ethical ingredient sourcing and advanced functional applications. Enterprise operations increasingly mandate sustainable commercial plantation management to secure raw material availability and comply with global environmental standards. This structured agricultural approach directly accelerates synthetic fragrance substitute displacement within the high-end personal care manufacturing sector.
  • Formulators actively pursue cosmetic bioactive formulation integration to capitalize on the inherent dermatological benefits of these extracts. By upgrading processing infrastructure for continuous distillation yield optimization, manufacturers have successfully reduced energy expenditure by 30 percent during extraction cycles. This efficiency gain allows for the sustainable production of an advanced phytomedicinal therapeutic agent utilized in topical applications.
  • Furthermore, the deployment of a natural botanical scent fixative elevates the olfactory profile of any premium wellness aromatherapy blend, driving broad commercial adoption. To guarantee product authenticity and protect brand integrity, procurement teams universally require trace verifiable origin certification before accepting raw materials into global supply chains.

What are the Key Data Covered in this Sandalwood Oil Market Research and Growth Report?

  • What is the expected growth of the Sandalwood Oil Market between 2026 and 2030?

    • USD 809.41 million, at a CAGR of 7.5%

  • What segmentation does the market report cover?

    • The report is segmented by Type (Indian sandalwood oil, Australian sandalwood oil, and Others), Product (Natural, and Lab created), Application (Cosmetics and personal care, Pharmaceuticals, Aromatherapy, and Household or retail) and Geography (APAC, North America, Europe, South America, Middle East and Africa)

  • Which regions are analyzed in the report?

    • APAC, North America, Europe, South America and Middle East and Africa

  • What are the key growth drivers and market challenges?

    • Rising consumer demand for natural personal care, Severe raw material and long agricultural cultivation cycles

  • Who are the major players in the Sandalwood Oil Market?

    • Aditi Essentials, Avi Naturals, Biolandes SAS, BONTOUX SAS, doTERRA International LLC, DSM Firmenich AG, Dutjahn Sandalwood Oils, Eden Botanicals, Essentially Australia, Givaudan SA, International Flavors Inc., Kanta Enterprises Pvt Ltd, Meena Perfumery, Mercer International Inc., NOW Health Group Inc., R. K. Essential Oils Co., Robertet SA, Santanol Group, VedaOils and Young Living Essential Oils LC

Market Research Insights

  • The Sandalwood Oil environment is undergoing a rapid evolution as enterprises prioritize natural ingredient compliance and robust sustainability initiatives. Driven by the expansion of holistic wellness therapies, manufacturers are accelerating synthetic chemical displacement across premium personal care portfolios. By investing in optimized extraction technologies and advanced botanical purity testing, processing facilities have reduced batch contamination rates by 28 percent.
  • Furthermore, strategic integration with certified agricultural partners has enhanced commercial forestry yields by 14 percent over the past decade, streamlining raw material availability. These operational improvements directly lower long-term procurement risks, allowing downstream formulators to maintain strict quality standards while improving supply chain resilience across global distribution networks.

We can help! Our analysts can customize this sandalwood oil market research report to meet your requirements.

Get in touch

1. Executive Summary

1.1 Market overview

Executive Summary - Chart on Market Overview
Executive Summary - Data Table on Market Overview
Executive Summary - Chart on Global Market Characteristics
Executive Summary - Chart on Market by Geography
Executive Summary - Chart on Market Segmentation by Type
Executive Summary - Chart on Market Segmentation by Product
Executive Summary - Chart on Market Segmentation by Application
Executive Summary - Chart on Incremental Growth
Executive Summary - Data Table on Incremental Growth
Executive Summary - Chart on Company Market Positioning

2. Technavio Analysis

2.1 Analysis of price sensitivity, lifecycle, customer purchase basket, adoption rates, and purchase criteria

2.2 Criticality of inputs and Factors of differentiation

Chart on Overview on criticality of inputs and factors of differentiation

2.3 Factors of disruption

Chart on Overview on factors of disruption

2.4 Impact of drivers and challenges

Chart on Impact of drivers and challenges in 2025 and 2030

3. Market Landscape

3.1 Market ecosystem

Chart on Parent Market
Data Table on - Parent Market

3.2 Market characteristics

Chart on Market characteristics analysis

3.3 Value chain analysis

Chart on Value chain analysis

4. Market Sizing

4.1 Market definition

Data Table on Offerings of companies included in the market definition

4.2 Market segment analysis

Market segments

4.3 Market size 2025

4.4 Market outlook: Forecast for 2025-2030

Chart on Global - Market size and forecast 2025-2030 ($ thousand)
Data Table on Global - Market size and forecast 2025-2030 ($ thousand)
Chart on Global Market: Year-over-year growth 2025-2030 (%)
Data Table on Global Market: Year-over-year growth 2025-2030 (%)

5. Historic Market Size

5.1 Global Sandalwood Oil Market 2020 - 2024

Historic Market Size - Data Table on Global Sandalwood Oil Market 2020 - 2024 ($ thousand)

5.2 Type segment analysis 2020 - 2024

Historic Market Size - Type Segment 2020 - 2024 ($ thousand)

5.3 Product segment analysis 2020 - 2024

Historic Market Size - Product Segment 2020 - 2024 ($ thousand)

5.4 Application segment analysis 2020 - 2024

Historic Market Size - Application Segment 2020 - 2024 ($ thousand)

5.5 Geography segment analysis 2020 - 2024

Historic Market Size - Geography Segment 2020 - 2024 ($ thousand)

5.6 Country segment analysis 2020 - 2024

Historic Market Size - Country Segment 2020 - 2024 ($ thousand)

6. Qualitative Analysis

6.1 Impact of AI on Global Sandalwood Oil Market

6.2 Impact of geopolitical conflicts on Global Sandalwood Oil Market

7. Five Forces Analysis

7.1 Five forces summary

Five forces analysis - Comparison between 2025 and 2030

7.2 Bargaining power of buyers

Bargaining power of buyers - Impact of key factors 2025 and 2030

7.3 Bargaining power of suppliers

Bargaining power of suppliers - Impact of key factors in 2025 and 2030

7.4 Threat of new entrants

Threat of new entrants - Impact of key factors in 2025 and 2030

7.5 Threat of substitutes

Threat of substitutes - Impact of key factors in 2025 and 2030

7.6 Threat of rivalry

Threat of rivalry - Impact of key factors in 2025 and 2030

7.7 Market condition

Chart on Market condition - Five forces 2025 and 2030

8. Market Segmentation by Type

8.1 Market segments

Chart on Type - Market share 2025-2030 (%)
Data Table on Type - Market share 2025-2030 (%)

8.2 Comparison by Type

Chart on Comparison by Type
Data Table on Comparison by Type

8.3 Indian sandalwood oil - Market size and forecast 2025-2030

Chart on Indian sandalwood oil - Market size and forecast 2025-2030 ($ thousand)
Data Table on Indian sandalwood oil - Market size and forecast 2025-2030 ($ thousand)
Chart on Indian sandalwood oil - Year-over-year growth 2025-2030 (%)
Data Table on Indian sandalwood oil - Year-over-year growth 2025-2030 (%)

8.4 Australian sandalwood oil - Market size and forecast 2025-2030

Chart on Australian sandalwood oil - Market size and forecast 2025-2030 ($ thousand)
Data Table on Australian sandalwood oil - Market size and forecast 2025-2030 ($ thousand)
Chart on Australian sandalwood oil - Year-over-year growth 2025-2030 (%)
Data Table on Australian sandalwood oil - Year-over-year growth 2025-2030 (%)

8.5 Others - Market size and forecast 2025-2030

Chart on Others - Market size and forecast 2025-2030 ($ thousand)
Data Table on Others - Market size and forecast 2025-2030 ($ thousand)
Chart on Others - Year-over-year growth 2025-2030 (%)
Data Table on Others - Year-over-year growth 2025-2030 (%)

8.6 Market opportunity by Type

Market opportunity by Type ($ thousand)
Data Table on Market opportunity by Type ($ thousand)

9. Market Segmentation by Product

9.1 Market segments

Chart on Product - Market share 2025-2030 (%)
Data Table on Product - Market share 2025-2030 (%)

9.2 Comparison by Product

Chart on Comparison by Product
Data Table on Comparison by Product

9.3 Natural - Market size and forecast 2025-2030

Chart on Natural - Market size and forecast 2025-2030 ($ thousand)
Data Table on Natural - Market size and forecast 2025-2030 ($ thousand)
Chart on Natural - Year-over-year growth 2025-2030 (%)
Data Table on Natural - Year-over-year growth 2025-2030 (%)

9.4 Lab created - Market size and forecast 2025-2030

Chart on Lab created - Market size and forecast 2025-2030 ($ thousand)
Data Table on Lab created - Market size and forecast 2025-2030 ($ thousand)
Chart on Lab created - Year-over-year growth 2025-2030 (%)
Data Table on Lab created - Year-over-year growth 2025-2030 (%)

9.5 Market opportunity by Product

Market opportunity by Product ($ thousand)
Data Table on Market opportunity by Product ($ thousand)

10. Market Segmentation by Application

10.1 Market segments

Chart on Application - Market share 2025-2030 (%)
Data Table on Application - Market share 2025-2030 (%)

10.2 Comparison by Application

Chart on Comparison by Application
Data Table on Comparison by Application

10.3 Cosmetics and personal care - Market size and forecast 2025-2030

Chart on Cosmetics and personal care - Market size and forecast 2025-2030 ($ thousand)
Data Table on Cosmetics and personal care - Market size and forecast 2025-2030 ($ thousand)
Chart on Cosmetics and personal care - Year-over-year growth 2025-2030 (%)
Data Table on Cosmetics and personal care - Year-over-year growth 2025-2030 (%)

10.4 Pharmaceuticals - Market size and forecast 2025-2030

Chart on Pharmaceuticals - Market size and forecast 2025-2030 ($ thousand)
Data Table on Pharmaceuticals - Market size and forecast 2025-2030 ($ thousand)
Chart on Pharmaceuticals - Year-over-year growth 2025-2030 (%)
Data Table on Pharmaceuticals - Year-over-year growth 2025-2030 (%)

10.5 Aromatherapy - Market size and forecast 2025-2030

Chart on Aromatherapy - Market size and forecast 2025-2030 ($ thousand)
Data Table on Aromatherapy - Market size and forecast 2025-2030 ($ thousand)
Chart on Aromatherapy - Year-over-year growth 2025-2030 (%)
Data Table on Aromatherapy - Year-over-year growth 2025-2030 (%)

10.6 Household or retail - Market size and forecast 2025-2030

Chart on Household or retail - Market size and forecast 2025-2030 ($ thousand)
Data Table on Household or retail - Market size and forecast 2025-2030 ($ thousand)
Chart on Household or retail - Year-over-year growth 2025-2030 (%)
Data Table on Household or retail - Year-over-year growth 2025-2030 (%)

10.7 Market opportunity by Application

Market opportunity by Application ($ thousand)
Data Table on Market opportunity by Application ($ thousand)

11. Customer Landscape

11.1 Customer landscape overview

Analysis of price sensitivity, lifecycle, customer purchase basket, adoption rates, and purchase criteria

12. Geographic Landscape

12.1 Geographic segmentation

Chart on Market share by geography 2025-2030 (%)
Data Table on Market share by geography 2025-2030 (%)

12.2 Geographic comparison

Chart on Geographic comparison
Data Table on Geographic comparison

12.3 APAC - Market size and forecast 2025-2030

Chart on APAC - Market size and forecast 2025-2030 ($ thousand)
Data Table on APAC - Market size and forecast 2025-2030 ($ thousand)
Chart on APAC - Year-over-year growth 2025-2030 (%)
Data Table on APAC - Year-over-year growth 2025-2030 (%)
Chart on Regional Comparison - APAC
Data Table on Regional Comparison - APAC

12.3.1 India - Market size and forecast 2025-2030

Chart on India - Market size and forecast 2025-2030 ($ thousand)
Data Table on India - Market size and forecast 2025-2030 ($ thousand)
Chart on India - Year-over-year growth 2025-2030 (%)
Data Table on India - Year-over-year growth 2025-2030 (%)

12.3.2 China - Market size and forecast 2025-2030

Chart on China - Market size and forecast 2025-2030 ($ thousand)
Data Table on China - Market size and forecast 2025-2030 ($ thousand)
Chart on China - Year-over-year growth 2025-2030 (%)
Data Table on China - Year-over-year growth 2025-2030 (%)

12.3.3 Australia - Market size and forecast 2025-2030

Chart on Australia - Market size and forecast 2025-2030 ($ thousand)
Data Table on Australia - Market size and forecast 2025-2030 ($ thousand)
Chart on Australia - Year-over-year growth 2025-2030 (%)
Data Table on Australia - Year-over-year growth 2025-2030 (%)

12.3.4 Japan - Market size and forecast 2025-2030

Chart on Japan - Market size and forecast 2025-2030 ($ thousand)
Data Table on Japan - Market size and forecast 2025-2030 ($ thousand)
Chart on Japan - Year-over-year growth 2025-2030 (%)
Data Table on Japan - Year-over-year growth 2025-2030 (%)

12.3.5 Indonesia - Market size and forecast 2025-2030

Chart on Indonesia - Market size and forecast 2025-2030 ($ thousand)
Data Table on Indonesia - Market size and forecast 2025-2030 ($ thousand)
Chart on Indonesia - Year-over-year growth 2025-2030 (%)
Data Table on Indonesia - Year-over-year growth 2025-2030 (%)

12.3.6 South Korea - Market size and forecast 2025-2030

Chart on South Korea - Market size and forecast 2025-2030 ($ thousand)
Data Table on South Korea - Market size and forecast 2025-2030 ($ thousand)
Chart on South Korea - Year-over-year growth 2025-2030 (%)
Data Table on South Korea - Year-over-year growth 2025-2030 (%)

12.4 North America - Market size and forecast 2025-2030

Chart on North America - Market size and forecast 2025-2030 ($ thousand)
Data Table on North America - Market size and forecast 2025-2030 ($ thousand)
Chart on North America - Year-over-year growth 2025-2030 (%)
Data Table on North America - Year-over-year growth 2025-2030 (%)
Chart on Regional Comparison - North America
Data Table on Regional Comparison - North America

12.4.1 US - Market size and forecast 2025-2030

Chart on US - Market size and forecast 2025-2030 ($ thousand)
Data Table on US - Market size and forecast 2025-2030 ($ thousand)
Chart on US - Year-over-year growth 2025-2030 (%)
Data Table on US - Year-over-year growth 2025-2030 (%)

12.4.2 Canada - Market size and forecast 2025-2030

Chart on Canada - Market size and forecast 2025-2030 ($ thousand)
Data Table on Canada - Market size and forecast 2025-2030 ($ thousand)
Chart on Canada - Year-over-year growth 2025-2030 (%)
Data Table on Canada - Year-over-year growth 2025-2030 (%)

12.4.3 Mexico - Market size and forecast 2025-2030

Chart on Mexico - Market size and forecast 2025-2030 ($ thousand)
Data Table on Mexico - Market size and forecast 2025-2030 ($ thousand)
Chart on Mexico - Year-over-year growth 2025-2030 (%)
Data Table on Mexico - Year-over-year growth 2025-2030 (%)

12.5 Europe - Market size and forecast 2025-2030

Chart on Europe - Market size and forecast 2025-2030 ($ thousand)
Data Table on Europe - Market size and forecast 2025-2030 ($ thousand)
Chart on Europe - Year-over-year growth 2025-2030 (%)
Data Table on Europe - Year-over-year growth 2025-2030 (%)
Chart on Regional Comparison - Europe
Data Table on Regional Comparison - Europe

12.5.1 Germany - Market size and forecast 2025-2030

Chart on Germany - Market size and forecast 2025-2030 ($ thousand)
Data Table on Germany - Market size and forecast 2025-2030 ($ thousand)
Chart on Germany - Year-over-year growth 2025-2030 (%)
Data Table on Germany - Year-over-year growth 2025-2030 (%)

12.5.2 UK - Market size and forecast 2025-2030

Chart on UK - Market size and forecast 2025-2030 ($ thousand)
Data Table on UK - Market size and forecast 2025-2030 ($ thousand)
Chart on UK - Year-over-year growth 2025-2030 (%)
Data Table on UK - Year-over-year growth 2025-2030 (%)

12.5.3 France - Market size and forecast 2025-2030

Chart on France - Market size and forecast 2025-2030 ($ thousand)
Data Table on France - Market size and forecast 2025-2030 ($ thousand)
Chart on France - Year-over-year growth 2025-2030 (%)
Data Table on France - Year-over-year growth 2025-2030 (%)

12.5.4 Italy - Market size and forecast 2025-2030

Chart on Italy - Market size and forecast 2025-2030 ($ thousand)
Data Table on Italy - Market size and forecast 2025-2030 ($ thousand)
Chart on Italy - Year-over-year growth 2025-2030 (%)
Data Table on Italy - Year-over-year growth 2025-2030 (%)

12.5.5 Spain - Market size and forecast 2025-2030

Chart on Spain - Market size and forecast 2025-2030 ($ thousand)
Data Table on Spain - Market size and forecast 2025-2030 ($ thousand)
Chart on Spain - Year-over-year growth 2025-2030 (%)
Data Table on Spain - Year-over-year growth 2025-2030 (%)

12.5.6 The Netherlands - Market size and forecast 2025-2030

Chart on The Netherlands - Market size and forecast 2025-2030 ($ thousand)
Data Table on The Netherlands - Market size and forecast 2025-2030 ($ thousand)
Chart on The Netherlands - Year-over-year growth 2025-2030 (%)
Data Table on The Netherlands - Year-over-year growth 2025-2030 (%)

12.6 South America - Market size and forecast 2025-2030

Chart on South America - Market size and forecast 2025-2030 ($ thousand)
Data Table on South America - Market size and forecast 2025-2030 ($ thousand)
Chart on South America - Year-over-year growth 2025-2030 (%)
Data Table on South America - Year-over-year growth 2025-2030 (%)
Chart on Regional Comparison - South America
Data Table on Regional Comparison - South America

12.6.1 Brazil - Market size and forecast 2025-2030

Chart on Brazil - Market size and forecast 2025-2030 ($ thousand)
Data Table on Brazil - Market size and forecast 2025-2030 ($ thousand)
Chart on Brazil - Year-over-year growth 2025-2030 (%)
Data Table on Brazil - Year-over-year growth 2025-2030 (%)

12.6.2 Argentina - Market size and forecast 2025-2030

Chart on Argentina - Market size and forecast 2025-2030 ($ thousand)
Data Table on Argentina - Market size and forecast 2025-2030 ($ thousand)
Chart on Argentina - Year-over-year growth 2025-2030 (%)
Data Table on Argentina - Year-over-year growth 2025-2030 (%)

12.6.3 Chile - Market size and forecast 2025-2030

Chart on Chile - Market size and forecast 2025-2030 ($ thousand)
Data Table on Chile - Market size and forecast 2025-2030 ($ thousand)
Chart on Chile - Year-over-year growth 2025-2030 (%)
Data Table on Chile - Year-over-year growth 2025-2030 (%)

12.7 Middle East and Africa - Market size and forecast 2025-2030

Chart on Middle East and Africa - Market size and forecast 2025-2030 ($ thousand)
Data Table on Middle East and Africa - Market size and forecast 2025-2030 ($ thousand)
Chart on Middle East and Africa - Year-over-year growth 2025-2030 (%)
Data Table on Middle East and Africa - Year-over-year growth 2025-2030 (%)
Chart on Regional Comparison - Middle East and Africa
Data Table on Regional Comparison - Middle East and Africa

12.7.1 UAE - Market size and forecast 2025-2030

Chart on UAE - Market size and forecast 2025-2030 ($ thousand)
Data Table on UAE - Market size and forecast 2025-2030 ($ thousand)
Chart on UAE - Year-over-year growth 2025-2030 (%)
Data Table on UAE - Year-over-year growth 2025-2030 (%)

12.7.2 Saudi Arabia - Market size and forecast 2025-2030

Chart on Saudi Arabia - Market size and forecast 2025-2030 ($ thousand)
Data Table on Saudi Arabia - Market size and forecast 2025-2030 ($ thousand)
Chart on Saudi Arabia - Year-over-year growth 2025-2030 (%)
Data Table on Saudi Arabia - Year-over-year growth 2025-2030 (%)

12.7.3 South Africa - Market size and forecast 2025-2030

Chart on South Africa - Market size and forecast 2025-2030 ($ thousand)
Data Table on South Africa - Market size and forecast 2025-2030 ($ thousand)
Chart on South Africa - Year-over-year growth 2025-2030 (%)
Data Table on South Africa - Year-over-year growth 2025-2030 (%)

12.7.4 Turkey - Market size and forecast 2025-2030

Chart on Turkey - Market size and forecast 2025-2030 ($ thousand)
Data Table on Turkey - Market size and forecast 2025-2030 ($ thousand)
Chart on Turkey - Year-over-year growth 2025-2030 (%)
Data Table on Turkey - Year-over-year growth 2025-2030 (%)

12.7.5 Israel - Market size and forecast 2025-2030

Chart on Israel - Market size and forecast 2025-2030 ($ thousand)
Data Table on Israel - Market size and forecast 2025-2030 ($ thousand)
Chart on Israel - Year-over-year growth 2025-2030 (%)
Data Table on Israel - Year-over-year growth 2025-2030 (%)

12.8 Market opportunity by geography

Market opportunity by geography ($ thousand)
Data Tables on Market opportunity by geography ($ thousand)

13. Drivers, Challenges, and Opportunity

13.1 Market drivers

Rising consumer demand for natural personal care
Expansion of clinical aromatherapy and wellness
Focus on sustainable sourcing and cultivation

13.2 Market challenges

Severe raw material and long agricultural cultivation cycles
Widespread product adulteration and stringent traceability standards
Regulatory trade restrictions and complex environmental compliance frameworks

13.3 Impact of drivers and challenges

Impact of drivers and challenges in 2025 and 2030

13.4 Market opportunities

Integration into advanced pharmaceutical and medicinal formulations
Rise of E-commerce and D2C digital distribution channels
Stringent authenticity verification and traceability mandates

14. Competitive Landscape

14.1 Overview

14.2

Overview on criticality of inputs and factors of differentiation

14.3 Landscape disruption

Overview on factors of disruption

14.4 Industry risks

Impact of key risks on business

15. Competitive Analysis

15.1 Companies profiled

Companies covered

15.2 Company ranking index

15.3 Market positioning of companies

Matrix on companies position and classification

15.4 Aditi Essentials

Aditi Essentials - Overview
Aditi Essentials - Product / Service
Aditi Essentials - Key offerings
SWOT

15.5 Avi Naturals

Avi Naturals - Overview
Avi Naturals - Product / Service
Avi Naturals - Key offerings
SWOT

15.6 Biolandes SAS

Biolandes SAS - Overview
Biolandes SAS - Product / Service
Biolandes SAS - Key offerings
SWOT

15.7 doTERRA International LLC

doTERRA International LLC - Overview
doTERRA International LLC - Product / Service
doTERRA International LLC - Key offerings
SWOT

15.8 DSM Firmenich AG

DSM Firmenich AG - Overview
DSM Firmenich AG - Business segments
DSM Firmenich AG - Key offerings
DSM Firmenich AG - Segment focus
SWOT

15.9 Dutjahn Sandalwood Oils

Dutjahn Sandalwood Oils - Overview
Dutjahn Sandalwood Oils - Product / Service
Dutjahn Sandalwood Oils - Key offerings
SWOT

15.10 Essentially Australia

Essentially Australia - Overview
Essentially Australia - Product / Service
Essentially Australia - Key offerings
SWOT

15.11 Givaudan SA

Givaudan SA - Overview
Givaudan SA - Business segments
Givaudan SA - Key news
Givaudan SA - Key offerings
Givaudan SA - Segment focus
SWOT

15.12 International Flavors Inc.

International Flavors Inc. - Overview
International Flavors Inc. - Business segments
International Flavors Inc. - Key news
International Flavors Inc. - Key offerings
International Flavors Inc. - Segment focus
SWOT

15.13 Kanta Enterprises Pvt Ltd

Kanta Enterprises Pvt Ltd - Overview
Kanta Enterprises Pvt Ltd - Product / Service
Kanta Enterprises Pvt Ltd - Key offerings
SWOT

15.14 Meena Perfumery

Meena Perfumery - Overview
Meena Perfumery - Product / Service
Meena Perfumery - Key offerings
SWOT

15.15 Mercer International Inc.

Mercer International Inc. - Overview
Mercer International Inc. - Business segments
Mercer International Inc. - Key offerings
Mercer International Inc. - Segment focus
SWOT

15.16 R. K. Essential Oils Co.

R. K. Essential Oils Co. - Overview
R. K. Essential Oils Co. - Product / Service
R. K. Essential Oils Co. - Key offerings
SWOT

15.17 VedaOils

VedaOils - Overview
VedaOils - Product / Service
VedaOils - Key offerings
SWOT

15.18 Young Living Essential Oils LC

Young Living Essential Oils LC - Overview
Young Living Essential Oils LC - Product / Service
Young Living Essential Oils LC - Key offerings
SWOT

16. Appendix

16.1 Scope of the report

Market definition
Objectives
Notes and caveats

16.2 Inclusions and exclusions checklist

Inclusions checklist
Exclusions checklist

16.3 Currency conversion rates for US$

16.4 Research methodology

16.5 Data procurement

Information sources

16.6 Data validation

16.7 Validation techniques employed for market sizing

16.8 Data synthesis

16.9 360 degree market analysis

16.10 List of abbreviations

Research Methodology

Technavio presents a detailed picture of the market by way of study, synthesis, and summation of data from multiple sources. The analysts have presented the various facets of the market with a particular focus on identifying the key industry influencers. The data thus presented is comprehensive, reliable, and the result of extensive research, both primary and secondary.

INFORMATION SOURCES

Primary sources

  • Manufacturers and suppliers
  • Channel partners
  • Industry experts
  • Strategic decision makers

Secondary sources

  • Industry journals and periodicals
  • Government data
  • Financial reports of key industry players
  • Historical data
  • Press releases

DATA ANALYSIS

Data Synthesis

  • Collation of data
  • Estimation of key figures
  • Analysis of derived insights

Data Validation

  • Triangulation with data models
  • Reference against proprietary databases
  • Corroboration with industry experts

REPORT WRITING

Qualitative

  • Market drivers
  • Market challenges
  • Market trends
  • Five forces analysis

Quantitative

  • Market size and forecast
  • Market segmentation
  • Geographical insights
  • Competitive landscape

Interested in this report?

Get your sample now to see our research methodology and insights!

Download Now

Frequently Asked Questions

Sandalwood Oil market growth will increase by USD 809405.5 thousand thousand during 2026-2030.

The Sandalwood Oil market is expected to grow at a CAGR of 7.5% during 2026-2030.

Sandalwood Oil market is segmented by Type (Indian sandalwood oil, Australian sandalwood oil, Others) Product (Natural, Lab created) Application (Cosmetics and personal care, Pharmaceuticals, Aromatherapy, Household or retail)

Aditi Essentials, Avi Naturals, Biolandes SAS, BONTOUX SAS, doTERRA International LLC, DSM Firmenich AG, Dutjahn Sandalwood Oils, Eden Botanicals, Essentially Australia, Givaudan SA, International Flavors Inc., Kanta Enterprises Pvt Ltd, Meena Perfumery, Mercer International Inc., NOW Health Group Inc., R. K. Essential Oils Co., Robertet SA, Santanol Group, VedaOils, Young Living Essential Oils LC are a few of the key vendors in the Sandalwood Oil market.

APAC will register the highest growth rate of 64.2% among the other regions. Therefore, the Sandalwood Oil market in APAC is expected to garner significant business opportunities for the vendors during the forecast period.

India, China, Australia, Japan, Indonesia, South Korea, US, Canada, Mexico, Germany, UK, France, Italy, Spain, The Netherlands, Brazil, Argentina, Chile, UAE, Saudi Arabia, South Africa, Turkey, Israel

  • Rising consumer demand for natural personal care is the driving factor this market.

The Sandalwood Oil market vendors should focus on grabbing business opportunities from the Type segment as it accounted for the largest market share in the base year.
RIA - Research AI Assistant
Ask RIA