Restaurant Technology Market Analysis, Size, and Forecast 2026-2030: North America (US, Canada, and Mexico), Europe (UK, Germany, and France), APAC (China, India, and Japan), Middle East and Africa (UAE, Saudi Arabia, and South Africa), South America (Brazil, Argentina, and Chile), and Rest of World (ROW)

Restaurant Technology Market Analysis, Size, and Forecast 2026-2030:
North America (US, Canada, and Mexico), Europe (UK, Germany, and France), APAC (China, India, and Japan), Middle East and Africa (UAE, Saudi Arabia, and South Africa), South America (Brazil, Argentina, and Chile), and Rest of World (ROW)

Published: Nov 2026 302 Pages SKU: IRTNTR80594

Market Overview at a Glance

$15.68 B
Market Opportunity
16.4%
CAGR 2025 - 2030
37.3%
North America Growth
$4.20 B
RMS segment 2024

Restaurant Technology Market Size 2026-2030

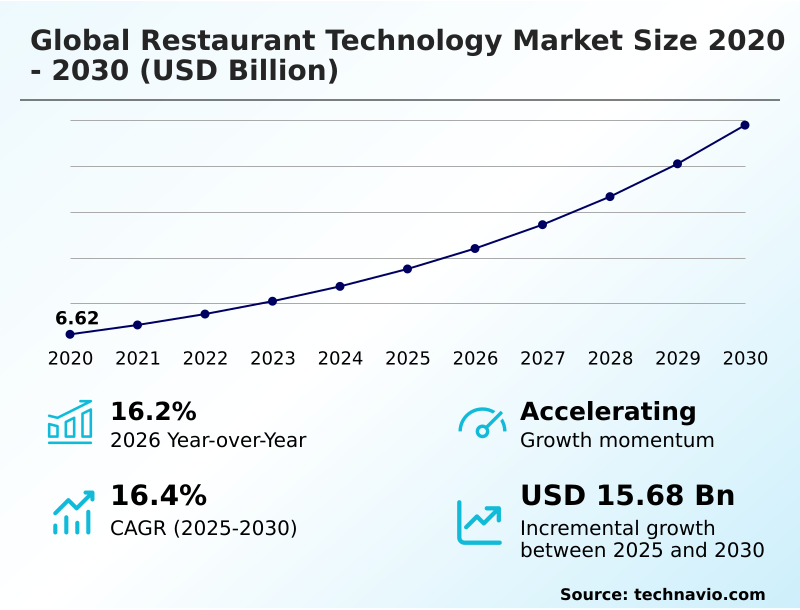
The restaurant technology market size is valued to increase by USD 15.68 billion, at a CAGR of 16.4% from 2025 to 2030. Persistent operating costs driving automation adoption will drive the restaurant technology market.

Major Market Trends & Insights

  • North America dominated the market and accounted for a 37.3% growth during the forecast period.
  • By Type - RMS segment was valued at USD 4.20 billion in 2024
  • By End-user - Quick-service restaurants segment accounted for the largest market revenue share in 2024

Market Size & Forecast

  • Market Opportunities: USD 22.82 billion
  • Market Future Opportunities: USD 15.68 billion
  • CAGR from 2025 to 2030 : 16.4%

Market Summary

  • The Restaurant Technology Market is undergoing a rapid structural transformation driven by the critical necessity to digitize high-volume transaction environments and optimize labor utilization. Establishments are aggressively abandoning static legacy systems in favor of dynamic, omnichannel ecosystems capable of managing complex, real-time data flows.
  • For instance, multi-unit franchise operators successfully utilize predictive analytics integrated with supply chain modules to automatically generate raw ingredient purchase orders, subsequently reducing inventory waste. Enterprises deploying these integrated software suites achieve a 25% faster order processing throughput compared to those relying on manual ledger accounting and fragmented hardware.
  • Escalating frontline wage rates act as a primary growth catalyst, forcing hospitality brands to deploy self-service kiosks and automated kitchen routing to protect operating margins. Conversely, systemic software fragmentation creates profound operational friction, as closed proprietary architectures frequently block seamless data synchronization between front-of-house registers and backend accounting frameworks.
  • Resolving these profound data interoperability hurdles remains critical for scaling digital commerce applications and ensuring consistent, low-latency order execution across decentralized dining networks.

What will be the Size of the Restaurant Technology Market during the forecast period?
Get Key Insights on Market Forecast (PDF) Get Free Sample

How is the Restaurant Technology Market Segmented?

The restaurant technology industry research report provides comprehensive data (region-wise segment analysis), with forecasts and estimates in "USD million" for the period 2026-2030, as well as historical data from 2020-2024 for the following segments.

  • Type
    • RMS
    • Point of sale systems
    • Online ordering systems
    • Payment processing solutions
    • Others
  • End-user
    • Quick-service restaurants
    • Full-service restaurants
    • Others
  • Deployment
    • Cloud-based
    • On-premise
    • Hybrid
  • Geography
    • North America
      • US
      • Canada
      • Mexico
    • Europe
      • UK
      • Germany
      • France
      • Italy
      • Spain
      • The Netherlands
    • APAC
      • China
      • India
      • Japan
      • Australia
      • South Korea
      • Indonesia
    • Middle East and Africa
      • UAE
      • Saudi Arabia
      • South Africa
      • Turkey
      • Egypt
    • South America
      • Brazil
      • Argentina
      • Chile

By Type Insights

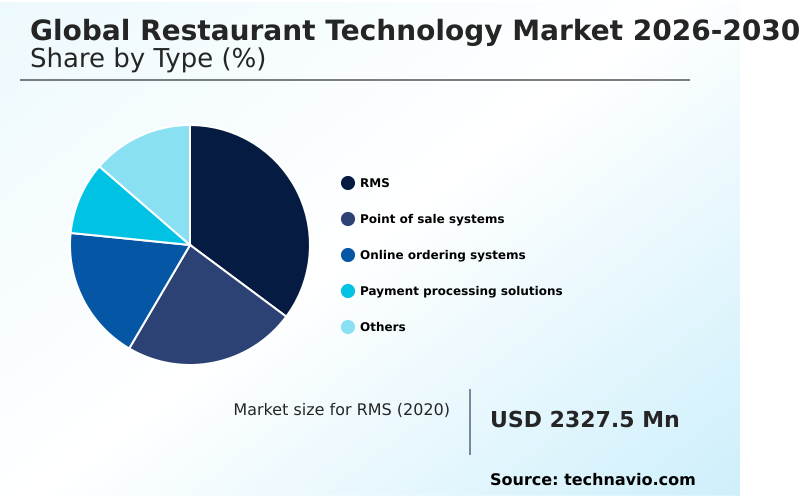
The rms segment is estimated to witness significant growth during the forecast period.

The restaurant management systems segment fundamentally shifts how multi-unit operators synchronize back-of-house workflows. By centralizing inventory prediction algorithms and recipe cost analysis within robust cloud native management platforms, enterprises eliminate manual errors.

Abandoning fragmented legacy transactional software in favor of centralized digital nervous systems enables managers to leverage predictive demand forecasting, seamlessly constructing automated prep scheduling tools.

Implementation of these ecosystems demonstrably enhances precision, with multi-unit enterprises typically seeing a 15% improvement in daily labor utilization.

Furthermore, seamless data handoffs between direct to consumer web portals and automated kitchen display networks continuously refine table turnover speeds, while integrated tableside mobile payment terminals ensure fast, frictionless transaction settlements without requiring guests to leave their seats.
Get Free Sample

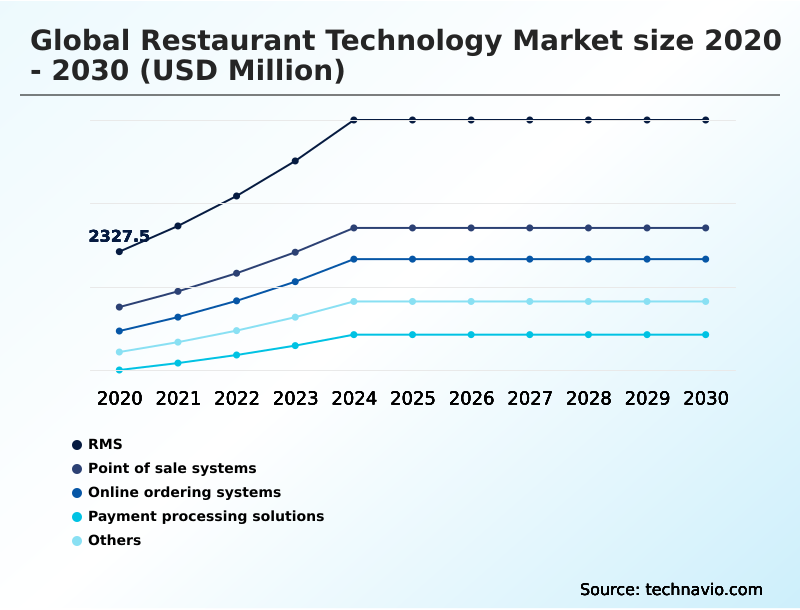
The RMS segment was valued at USD 4.20 billion in 2024 and showed a gradual increase during the forecast period.
Get Free Sample

Regional Analysis

North America is estimated to contribute 37.3% to the growth of the global market during the forecast period.Technavio’s analysts have elaborately explained the regional trends and drivers that shape the market during the forecast period.
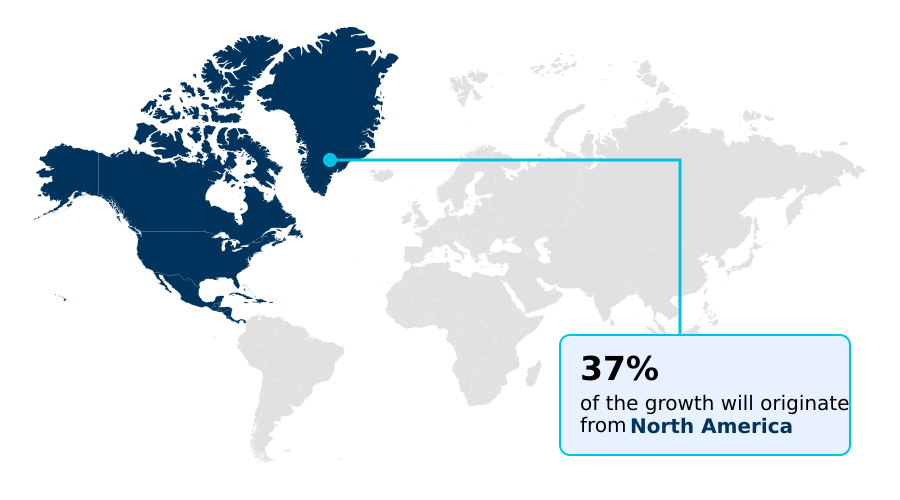
See How Restaurant Technology Market Demand is Rising in North America Get Free Sample

The regional dynamics reveal stark contrasts in digital infrastructure, particularly when comparing the consolidated North American sector with the rapidly expanding APAC region.

North American operators exhibit a 40% higher adoption rate of automated upselling prompts and contactless payment processing than European counterparts.

This urgency drives massive investments in application programming interfaces to seamlessly connect third party delivery marketplaces with back-of-house operations to manage multi channel digital engagement.

Conversely, APAC accelerates the deployment of native mobile ordering applications and decentralized peer to peer payment protocols at a pace 35% faster than the Western average.

To minimize bottlenecks, Asian enterprises heavily integrate progressive web application frameworks and dynamic geofencing modules to optimize prep times.

These regional disparities dictate distinct strategies, wherein North American investments target robust offline redundancy to prevent outages, while APAC prioritizes rapid digital throughput.

Market Dynamics

Our researchers analyzed the data with 2025 as the base year, along with the key drivers, trends, and challenges. A holistic analysis of drivers will help companies refine their marketing strategies to gain a competitive advantage.

  • The continuous evolution of hospitality infrastructure relies heavily on the implementation of cloud native point of sale architectures, which serve as the foundational digital backbone for multi-unit operators. By moving away from rigid legacy hardware, enterprises facilitate seamless omnichannel digital order aggregation systems, ensuring that incoming digital tickets from various delivery networks merge cleanly into a single production queue.
  • To manage this influx efficiently, the deployment of automated kitchen display synchronization protocols allows for dynamic ticket pacing, significantly reducing food preparation delays. Concurrently, predictive labor scheduling algorithms integration acts as a critical mechanism to optimize shift coverage, yielding up to a 15% superior labor efficiency margin compared to traditional manual roster planning.
  • As consumer preferences shift toward immediate convenience, progressive web application ordering interfaces alongside contactless tableside payment processing modules empower guests to dictate their own dining pace. The integration of conversational artificial intelligence order intake further expedites drive-thru throughput, effectively eliminating manual entry errors.
  • In the back-of-house environment, proactive risk mitigation is achieved through continuous internet of things environmental monitoring and predictive maintenance sensor network deployment, ensuring refrigeration units operate securely without unexpected failure. Automated thermal receipt printing integration supports accurate bag assembly, while computer vision food quality inspection verifies portion consistency before dispatch.
  • By leveraging these comprehensive technologies, including frictionless omnichannel order fulfillment systems, automated prep scheduling optimization tools, and decentralized peer to peer payment frameworks tied to dynamic loyalty program reward engines, operators successfully safeguard profitability while consistently elevating the guest experience.
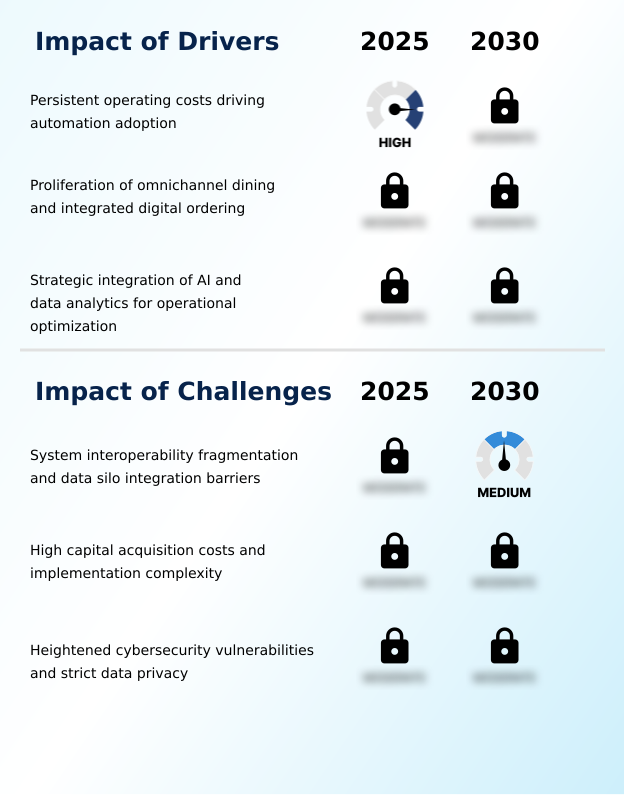
What are the key market drivers leading to the rise in the adoption of Restaurant Technology Industry?

  • Persistent operating costs and structural labor deficits are actively driving the aggressive adoption of automated software and hardware solutions.

  • Severe structural labor deficits and escalating frontline wage rates act as primary catalysts accelerating the widespread deployment of automated drive thru automation and self-service interfaces.
  • As operators struggle to maintain shift coverage, they increasingly rely on deep neural networks and natural language processing engines to manage front-of-house order intake.
  • The integration of advanced automated speech recognition algorithms within conversational artificial intelligence interfaces drastically reduces the necessity for human cashiers, allowing enterprises to lower localized labor expenditures by up to 25%.
  • Furthermore, migrating to unified cloud ecosystems empowered by localized edge computing hardware optimizes off-premises dispatch logistics and complex split check calculations. Establishments adopting predictive labor scheduling and these synchronized data pipelines experience a 20% improvement in achieving frictionless order fulfillment.
  • This profound technological shift empowers operators to mitigate operating overhead while preserving seamless service continuity.

What are the market trends shaping the Restaurant Technology Industry?

  • An accelerated shift toward unified cloud-native point-of-sale architectures constitutes a dominant emerging trend. This structural migration enables food service enterprises to maintain centralized data control and frictionless third-party integration across multi-location networks.

  • The rapid migration toward decentralized social media commerce constitutes a dominant structural shift within the Restaurant Technology ecosystem. As modern consumers demand frictionless interactions, food service enterprises are aggressively adopting decentralized ordering protocols and sophisticated omnichannel order aggregation platforms to manage incoming tickets.
  • Consequently, operators are integrating automated optical sensors and intelligent computer vision quality control systems to enforce strict standards at high-velocity assembly stations. Establishments utilizing these advanced visual inspection tools have successfully reduced order inaccuracy complaints by 28%.
  • Concurrently, the deployment of smart digital menu boards has improved promotional conversion rates by 18%, while automated thermal monitoring hardware guarantees food safety compliance. By leveraging thermal receipt integration and secure biometric payment modules, operators systematically eliminate front-of-house congestion, fundamentally transforming high-volume dining into a highly automated commercial operation.

What challenges does the Restaurant Technology Industry face during its growth?

  • System interoperability fragmentation and severe data silo integration barriers represent primary challenges obstructing seamless digital transformation.

  • Severe system interoperability fragmentation and closed proprietary software architectures represent significant operational barriers within the Restaurant Technology landscape. Food service enterprises frequently operate disjointed technology stacks that lack standardized data communication protocols, creating profound data silos between point of sale architecture and backend systems.
  • When managers attempt to synchronize dynamic loyalty engines with outdated central registers, extreme system latency frequently occurs during peak hours. Facilities burdened by these integration hurdles typically experience a 15% increase in administrative reconciliation tasks, severely depressing operational efficiency.
  • Furthermore, the necessity to deploy complex multi factor authentication systems and strict point to point encryption to protect consumer data introduces substantial implementation friction. While the integration of internet of things sensors, thermal monitoring probes, and predictive maintenance sensors is critical for equipment reliability, overcoming entrenched integration barriers requires extensive capital investment to construct custom middleware connections.

Exclusive Technavio Analysis on Customer Landscape

The restaurant technology market forecasting report includes the adoption lifecycle of the market, covering from the innovator’s stage to the laggard’s stage. It focuses on adoption rates in different regions based on penetration. Furthermore, the restaurant technology market report also includes key purchase criteria and drivers of price sensitivity to help companies evaluate and develop their market growth analysis strategies.
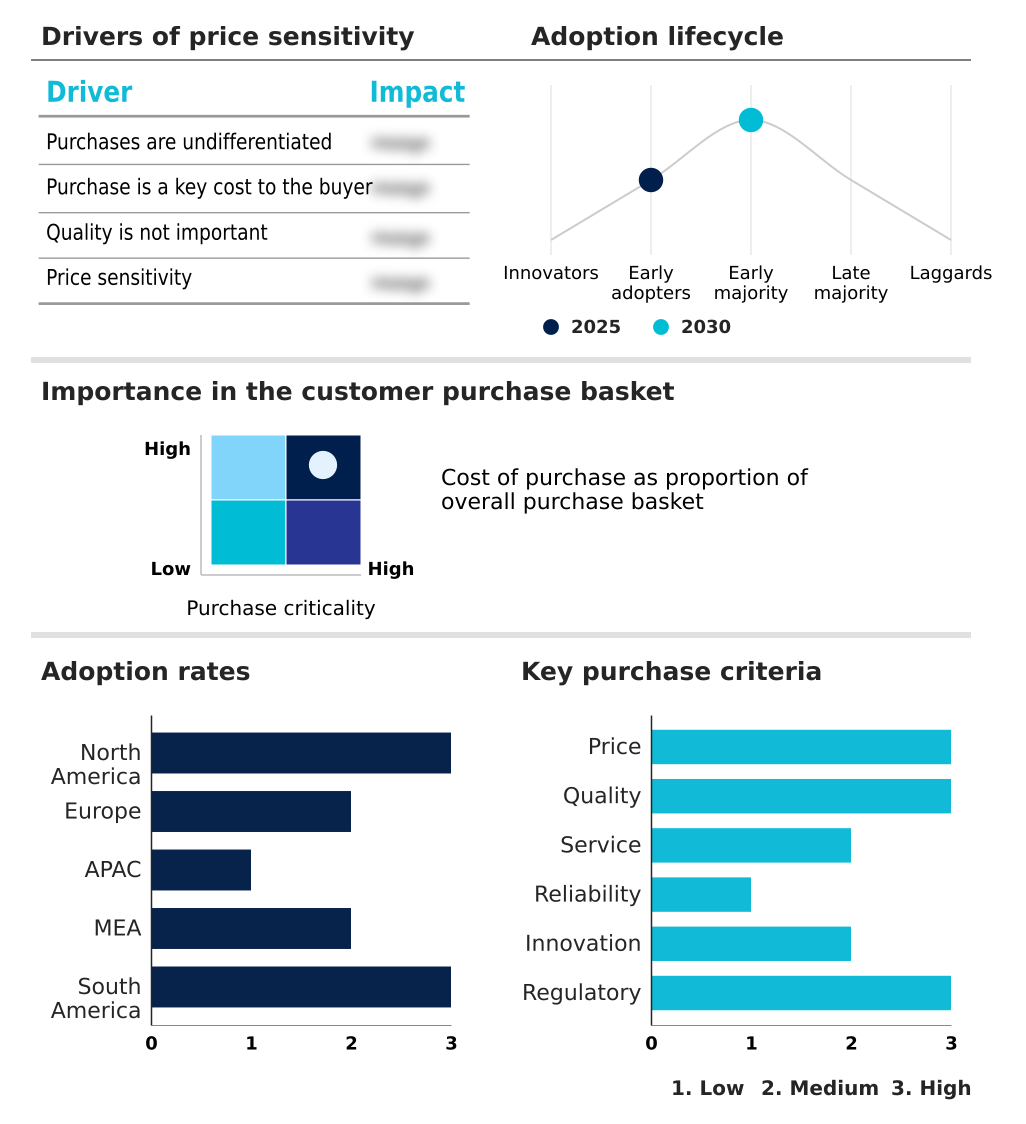
Customer Landscape of Restaurant Technology Industry

Competitive Landscape

Companies are implementing various strategies, such as strategic alliances, restaurant technology market forecast, partnerships, mergers and acquisitions, geographical expansion, and product/service launches, to enhance their presence in the industry.

7shifts Employee Scheduling - Agilysys delivers advanced hospitality software, providing integrated point of sale platforms, kitchen display systems, and robust inventory management tools engineered to streamline complex food service operations efficiently.

The industry research and growth report includes detailed analyses of the competitive landscape of the market and information about key companies, including:

  • 7shifts Employee Scheduling
  • Agilysys Inc.
  • Block Inc.
  • ChowNow Inc.
  • Clover Network LLC
  • Digitory Solutions Pvt. Ltd.
  • Fishbowl Inc.
  • Fourth Enterprises LLC
  • HungerRush Inc
  • MarginEdge Co.
  • NCR Payment Solutions LLC
  • Odoo SA
  • Olo Inc.
  • OpenTable Inc.
  • Oracle Corp.
  • Shift4 Payments Inc.
  • SmartSense
  • SpotOn Transact LLC
  • Toast Inc.
  • TouchBistro Inc.

Qualitative and quantitative analysis of companies has been conducted to help clients understand the wider business environment as well as the strengths and weaknesses of key industry players. Data is qualitatively analyzed to categorize companies as pure play, category-focused, industry-focused, and diversified; it is quantitatively analyzed to categorize companies as dominant, leading, strong, tentative, and weak.

Recent Development and News in Restaurant technology market

  • In the Application Software industry, the rapid transition toward unified cloud ecosystems and decentralized peer to peer payment frameworks has fundamentally accelerated workflow interoperability, directly impacting Restaurant Technology demand by forcing operators to abandon legacy transactional software in favor of integrated point of sale architecture.
  • Strict enforcement of data privacy regulations such as the General Data Protection Regulation has mandated the deployment of multi factor authentication systems and point to point encryption protocols, subsequently driving food service enterprises to upgrade their secure biometric payment modules to maintain compliance.
  • The accelerated integration of deep neural networks and natural language processing engines within enterprise automation suites has dramatically improved automated speech recognition accuracy, propelling the hospitality sector to adopt conversational artificial intelligence interfaces for drive-thru and phone order intake.
  • Widespread adoption of edge computing hardware alongside internet of things sensors across supply chain logistics has drastically reduced processing latency, directly enabling the seamless deployment of automated thermal monitoring hardware and predictive maintenance sensors within commercial kitchen environments.

Dive into Technavio’s robust research methodology, blending expert interviews, extensive data synthesis, and validated models for unparalleled Restaurant Technology Market insights. See full methodology.

Market Scope
Page number 302
Base year 2025
Historic period 2020-2024
Forecast period 2026-2030
Growth momentum & CAGR Accelerate at a CAGR of 16.4%
Market growth 2026-2030 USD 15684.5 million
Market structure Fragmented
YoY growth 2025-2026(%) 16.2%
Key countries US, Canada, Mexico, UK, Germany, France, Italy, Spain, The Netherlands, China, India, Japan, Australia, South Korea, Indonesia, UAE, Saudi Arabia, South Africa, Turkey, Egypt, Brazil, Argentina and Chile
Competitive landscape Leading Companies, Market Positioning of Companies, Competitive Strategies, and Industry Risks

Request Free Sample

Research Analyst Overview

  • The Restaurant Technology sector is experiencing a fundamental structural evolution, characterized by the aggressive transition from fragmented hardware to holistic, data-driven platforms. Boardroom executives are increasingly prioritizing robust offline redundancy and biometric payment modules as central pillars of their enterprise risk management and compliance strategies.
  • By embedding predictive labor scheduling algorithms directly into core management systems, operators optimize workforce deployment in real-time. Facilities leveraging computer vision quality control have successfully achieved a 20% reduction in order inaccuracy rates, directly enhancing customer retention and minimizing ingredient waste.
  • To combat transaction bottlenecks, enterprises are rapidly adopting decentralized ordering protocols alongside advanced omnichannel order aggregation tools, ensuring seamless ticket routing from digital storefronts to the kitchen. Furthermore, the strategic deployment of thermal monitoring probes and predictive maintenance sensors guarantees strict adherence to food safety protocols, averting catastrophic equipment failures.
  • This widespread adoption of interconnected digital infrastructure fundamentally shifts operational paradigms, transforming reactive restaurant management into a highly predictable, automated, and scalable commercial enterprise.

What are the Key Data Covered in this Restaurant Technology Market Research and Growth Report?

  • What is the expected growth of the Restaurant Technology Market between 2026 and 2030?

    • USD 15.68 billion, at a CAGR of 16.4%

  • What segmentation does the market report cover?

    • The report is segmented by Type (RMS, Point of sale systems, Online ordering systems, Payment processing solutions, and Others), End-user (Quick-service restaurants, Full-service restaurants, and Others), Deployment (Cloud-based, On-premise, and Hybrid) and Geography (North America, Europe, APAC, Middle East and Africa, South America)

  • Which regions are analyzed in the report?

    • North America, Europe, APAC, Middle East and Africa and South America

  • What are the key growth drivers and market challenges?

    • Persistent operating costs driving automation adoption, System interoperability fragmentation and data silo integration barriers

  • Who are the major players in the Restaurant Technology Market?

    • 7shifts Employee Scheduling, Agilysys Inc., Block Inc., ChowNow Inc., Clover Network LLC, Digitory Solutions Pvt. Ltd., Fishbowl Inc., Fourth Enterprises LLC, HungerRush Inc, MarginEdge Co., NCR Payment Solutions LLC, Odoo SA, Olo Inc., OpenTable Inc., Oracle Corp., Shift4 Payments Inc., SmartSense, SpotOn Transact LLC, Toast Inc. and TouchBistro Inc.

Market Research Insights

  • The Restaurant Technology ecosystem is rapidly transitioning as operators prioritize centralized digital nervous systems to streamline multi channel digital engagement. Establishments integrating unified cloud ecosystems report a 22% reduction in order processing latency, directly enhancing table turnover speeds.
  • Furthermore, the deployment of tableside mobile payment terminals equipped with point to point encryption has increased payment settlement efficiency by 30%, vastly improving operational throughput during peak dining hours. By leveraging sophisticated proprietary software architectures that consolidate fragmented data streams, food service brands systematically eliminate manual reconciliation tasks.
  • These strategic technology deployments drastically lower administrative overhead, allowing hospitality enterprises to maintain robust compliance standards while delivering a seamless, high-velocity guest experience across diverse service models.

We can help! Our analysts can customize this restaurant technology market research report to meet your requirements.

Get in touch

1. Executive Summary

1.1 Market overview

Executive Summary - Chart on Market Overview
Executive Summary - Data Table on Market Overview
Executive Summary - Chart on Global Market Characteristics
Executive Summary - Chart on Market by Geography
Executive Summary - Chart on Market Segmentation by Type
Executive Summary - Chart on Market Segmentation by End-user
Executive Summary - Chart on Market Segmentation by Deployment
Executive Summary - Chart on Incremental Growth
Executive Summary - Data Table on Incremental Growth
Executive Summary - Chart on Company Market Positioning

2. Technavio Analysis

2.1 Analysis of price sensitivity, lifecycle, customer purchase basket, adoption rates, and purchase criteria

2.2 Criticality of inputs and Factors of differentiation

Chart on Overview on criticality of inputs and factors of differentiation

2.3 Factors of disruption

Chart on Overview on factors of disruption

2.4 Impact of drivers and challenges

Chart on Impact of drivers and challenges in 2025 and 2030

3. Market Landscape

3.1 Market ecosystem

Chart on Parent Market
Data Table on - Parent Market

3.2 Market characteristics

Chart on Market characteristics analysis

3.3 Value chain analysis

Chart on Value chain analysis

4. Market Sizing

4.1 Market definition

Data Table on Offerings of companies included in the market definition

4.2 Market segment analysis

Market segments

4.3 Market size 2025

4.4 Market outlook: Forecast for 2025-2030

Chart on Global - Market size and forecast 2025-2030 ($ million)
Data Table on Global - Market size and forecast 2025-2030 ($ million)
Chart on Global Market: Year-over-year growth 2025-2030 (%)
Data Table on Global Market: Year-over-year growth 2025-2030 (%)

5. Historic Market Size

5.1 Global Restaurant Technology Market 2020 - 2024

Historic Market Size - Data Table on Global Restaurant Technology Market 2020 - 2024 ($ million)

5.2 Type segment analysis 2020 - 2024

Historic Market Size - Type Segment 2020 - 2024 ($ million)

5.3 End-user segment analysis 2020 - 2024

Historic Market Size - End-user Segment 2020 - 2024 ($ million)

5.4 Deployment segment analysis 2020 - 2024

Historic Market Size - Deployment Segment 2020 - 2024 ($ million)

5.5 Geography segment analysis 2020 - 2024

Historic Market Size - Geography Segment 2020 - 2024 ($ million)

5.6 Country segment analysis 2020 - 2024

Historic Market Size - Country Segment 2020 - 2024 ($ million)

6. Qualitative Analysis

6.1 Impact of AI in Global Restaurant Technology Market

6.2 Impact of Geopolitical Conflicts on Global Restaurant Technology Market

7. Five Forces Analysis

7.1 Five forces summary

Five forces analysis - Comparison between 2025 and 2030

7.2 Bargaining power of buyers

Bargaining power of buyers - Impact of key factors 2025 and 2030

7.3 Bargaining power of suppliers

Bargaining power of suppliers - Impact of key factors in 2025 and 2030

7.4 Threat of new entrants

Threat of new entrants - Impact of key factors in 2025 and 2030

7.5 Threat of substitutes

Threat of substitutes - Impact of key factors in 2025 and 2030

7.6 Threat of rivalry

Threat of rivalry - Impact of key factors in 2025 and 2030

7.7 Market condition

Chart on Market condition - Five forces 2025 and 2030

8. Market Segmentation by Type

8.1 Market segments

Chart on Type - Market share 2025-2030 (%)
Data Table on Type - Market share 2025-2030 (%)

8.2 Comparison by Type

Chart on Comparison by Type
Data Table on Comparison by Type

8.3 RMS - Market size and forecast 2025-2030

Chart on RMS - Market size and forecast 2025-2030 ($ million)
Data Table on RMS - Market size and forecast 2025-2030 ($ million)
Chart on RMS - Year-over-year growth 2025-2030 (%)
Data Table on RMS - Year-over-year growth 2025-2030 (%)

8.4 Point of sale systems - Market size and forecast 2025-2030

Chart on Point of sale systems - Market size and forecast 2025-2030 ($ million)
Data Table on Point of sale systems - Market size and forecast 2025-2030 ($ million)
Chart on Point of sale systems - Year-over-year growth 2025-2030 (%)
Data Table on Point of sale systems - Year-over-year growth 2025-2030 (%)

8.5 Online ordering systems - Market size and forecast 2025-2030

Chart on Online ordering systems - Market size and forecast 2025-2030 ($ million)
Data Table on Online ordering systems - Market size and forecast 2025-2030 ($ million)
Chart on Online ordering systems - Year-over-year growth 2025-2030 (%)
Data Table on Online ordering systems - Year-over-year growth 2025-2030 (%)

8.6 Payment processing solutions - Market size and forecast 2025-2030

Chart on Payment processing solutions - Market size and forecast 2025-2030 ($ million)
Data Table on Payment processing solutions - Market size and forecast 2025-2030 ($ million)
Chart on Payment processing solutions - Year-over-year growth 2025-2030 (%)
Data Table on Payment processing solutions - Year-over-year growth 2025-2030 (%)

8.7 Others - Market size and forecast 2025-2030

Chart on Others - Market size and forecast 2025-2030 ($ million)
Data Table on Others - Market size and forecast 2025-2030 ($ million)
Chart on Others - Year-over-year growth 2025-2030 (%)
Data Table on Others - Year-over-year growth 2025-2030 (%)

8.8 Market opportunity by Type

Market opportunity by Type ($ million)
Data Table on Market opportunity by Type ($ million)

9. Market Segmentation by End-user

9.1 Market segments

Chart on End-user - Market share 2025-2030 (%)
Data Table on End-user - Market share 2025-2030 (%)

9.2 Comparison by End-user

Chart on Comparison by End-user
Data Table on Comparison by End-user

9.3 Quick-service restaurants - Market size and forecast 2025-2030

Chart on Quick-service restaurants - Market size and forecast 2025-2030 ($ million)
Data Table on Quick-service restaurants - Market size and forecast 2025-2030 ($ million)
Chart on Quick-service restaurants - Year-over-year growth 2025-2030 (%)
Data Table on Quick-service restaurants - Year-over-year growth 2025-2030 (%)

9.4 Full-service restaurants - Market size and forecast 2025-2030

Chart on Full-service restaurants - Market size and forecast 2025-2030 ($ million)
Data Table on Full-service restaurants - Market size and forecast 2025-2030 ($ million)
Chart on Full-service restaurants - Year-over-year growth 2025-2030 (%)
Data Table on Full-service restaurants - Year-over-year growth 2025-2030 (%)

9.5 Others - Market size and forecast 2025-2030

Chart on Others - Market size and forecast 2025-2030 ($ million)
Data Table on Others - Market size and forecast 2025-2030 ($ million)
Chart on Others - Year-over-year growth 2025-2030 (%)
Data Table on Others - Year-over-year growth 2025-2030 (%)

9.6 Market opportunity by End-user

Market opportunity by End-user ($ million)
Data Table on Market opportunity by End-user ($ million)

10. Market Segmentation by Deployment

10.1 Market segments

Chart on Deployment - Market share 2025-2030 (%)
Data Table on Deployment - Market share 2025-2030 (%)

10.2 Comparison by Deployment

Chart on Comparison by Deployment
Data Table on Comparison by Deployment

10.3 Cloud-based - Market size and forecast 2025-2030

Chart on Cloud-based - Market size and forecast 2025-2030 ($ million)
Data Table on Cloud-based - Market size and forecast 2025-2030 ($ million)
Chart on Cloud-based - Year-over-year growth 2025-2030 (%)
Data Table on Cloud-based - Year-over-year growth 2025-2030 (%)

10.4 On-premise - Market size and forecast 2025-2030

Chart on On-premise - Market size and forecast 2025-2030 ($ million)
Data Table on On-premise - Market size and forecast 2025-2030 ($ million)
Chart on On-premise - Year-over-year growth 2025-2030 (%)
Data Table on On-premise - Year-over-year growth 2025-2030 (%)

10.5 Hybrid - Market size and forecast 2025-2030

Chart on Hybrid - Market size and forecast 2025-2030 ($ million)
Data Table on Hybrid - Market size and forecast 2025-2030 ($ million)
Chart on Hybrid - Year-over-year growth 2025-2030 (%)
Data Table on Hybrid - Year-over-year growth 2025-2030 (%)

10.6 Market opportunity by Deployment

Market opportunity by Deployment ($ million)
Data Table on Market opportunity by Deployment ($ million)

11. Customer Landscape

11.1 Customer landscape overview

Analysis of price sensitivity, lifecycle, customer purchase basket, adoption rates, and purchase criteria

12. Geographic Landscape

12.1 Geographic segmentation

Chart on Market share by geography 2025-2030 (%)
Data Table on Market share by geography 2025-2030 (%)

12.2 Geographic comparison

Chart on Geographic comparison
Data Table on Geographic comparison

12.3 North America - Market size and forecast 2025-2030

Chart on North America - Market size and forecast 2025-2030 ($ million)
Data Table on North America - Market size and forecast 2025-2030 ($ million)
Chart on North America - Year-over-year growth 2025-2030 (%)
Data Table on North America - Year-over-year growth 2025-2030 (%)
Chart on Regional Comparison - North America
Data Table on Regional Comparison - North America

12.3.1 US - Market size and forecast 2025-2030

Chart on US - Market size and forecast 2025-2030 ($ million)
Data Table on US - Market size and forecast 2025-2030 ($ million)
Chart on US - Year-over-year growth 2025-2030 (%)
Data Table on US - Year-over-year growth 2025-2030 (%)

12.3.2 Canada - Market size and forecast 2025-2030

Chart on Canada - Market size and forecast 2025-2030 ($ million)
Data Table on Canada - Market size and forecast 2025-2030 ($ million)
Chart on Canada - Year-over-year growth 2025-2030 (%)
Data Table on Canada - Year-over-year growth 2025-2030 (%)

12.3.3 Mexico - Market size and forecast 2025-2030

Chart on Mexico - Market size and forecast 2025-2030 ($ million)
Data Table on Mexico - Market size and forecast 2025-2030 ($ million)
Chart on Mexico - Year-over-year growth 2025-2030 (%)
Data Table on Mexico - Year-over-year growth 2025-2030 (%)

12.4 Europe - Market size and forecast 2025-2030

Chart on Europe - Market size and forecast 2025-2030 ($ million)
Data Table on Europe - Market size and forecast 2025-2030 ($ million)
Chart on Europe - Year-over-year growth 2025-2030 (%)
Data Table on Europe - Year-over-year growth 2025-2030 (%)
Chart on Regional Comparison - Europe
Data Table on Regional Comparison - Europe

12.4.1 UK - Market size and forecast 2025-2030

Chart on UK - Market size and forecast 2025-2030 ($ million)
Data Table on UK - Market size and forecast 2025-2030 ($ million)
Chart on UK - Year-over-year growth 2025-2030 (%)
Data Table on UK - Year-over-year growth 2025-2030 (%)

12.4.2 Germany - Market size and forecast 2025-2030

Chart on Germany - Market size and forecast 2025-2030 ($ million)
Data Table on Germany - Market size and forecast 2025-2030 ($ million)
Chart on Germany - Year-over-year growth 2025-2030 (%)
Data Table on Germany - Year-over-year growth 2025-2030 (%)

12.4.3 France - Market size and forecast 2025-2030

Chart on France - Market size and forecast 2025-2030 ($ million)
Data Table on France - Market size and forecast 2025-2030 ($ million)
Chart on France - Year-over-year growth 2025-2030 (%)
Data Table on France - Year-over-year growth 2025-2030 (%)

12.4.4 Italy - Market size and forecast 2025-2030

Chart on Italy - Market size and forecast 2025-2030 ($ million)
Data Table on Italy - Market size and forecast 2025-2030 ($ million)
Chart on Italy - Year-over-year growth 2025-2030 (%)
Data Table on Italy - Year-over-year growth 2025-2030 (%)

12.4.5 Spain - Market size and forecast 2025-2030

Chart on Spain - Market size and forecast 2025-2030 ($ million)
Data Table on Spain - Market size and forecast 2025-2030 ($ million)
Chart on Spain - Year-over-year growth 2025-2030 (%)
Data Table on Spain - Year-over-year growth 2025-2030 (%)

12.4.6 The Netherlands - Market size and forecast 2025-2030

Chart on The Netherlands - Market size and forecast 2025-2030 ($ million)
Data Table on The Netherlands - Market size and forecast 2025-2030 ($ million)
Chart on The Netherlands - Year-over-year growth 2025-2030 (%)
Data Table on The Netherlands - Year-over-year growth 2025-2030 (%)

12.5 APAC - Market size and forecast 2025-2030

Chart on APAC - Market size and forecast 2025-2030 ($ million)
Data Table on APAC - Market size and forecast 2025-2030 ($ million)
Chart on APAC - Year-over-year growth 2025-2030 (%)
Data Table on APAC - Year-over-year growth 2025-2030 (%)
Chart on Regional Comparison - APAC
Data Table on Regional Comparison - APAC

12.5.1 China - Market size and forecast 2025-2030

Chart on China - Market size and forecast 2025-2030 ($ million)
Data Table on China - Market size and forecast 2025-2030 ($ million)
Chart on China - Year-over-year growth 2025-2030 (%)
Data Table on China - Year-over-year growth 2025-2030 (%)

12.5.2 India - Market size and forecast 2025-2030

Chart on India - Market size and forecast 2025-2030 ($ million)
Data Table on India - Market size and forecast 2025-2030 ($ million)
Chart on India - Year-over-year growth 2025-2030 (%)
Data Table on India - Year-over-year growth 2025-2030 (%)

12.5.3 Japan - Market size and forecast 2025-2030

Chart on Japan - Market size and forecast 2025-2030 ($ million)
Data Table on Japan - Market size and forecast 2025-2030 ($ million)
Chart on Japan - Year-over-year growth 2025-2030 (%)
Data Table on Japan - Year-over-year growth 2025-2030 (%)

12.5.4 Australia - Market size and forecast 2025-2030

Chart on Australia - Market size and forecast 2025-2030 ($ million)
Data Table on Australia - Market size and forecast 2025-2030 ($ million)
Chart on Australia - Year-over-year growth 2025-2030 (%)
Data Table on Australia - Year-over-year growth 2025-2030 (%)

12.5.5 South Korea - Market size and forecast 2025-2030

Chart on South Korea - Market size and forecast 2025-2030 ($ million)
Data Table on South Korea - Market size and forecast 2025-2030 ($ million)
Chart on South Korea - Year-over-year growth 2025-2030 (%)
Data Table on South Korea - Year-over-year growth 2025-2030 (%)

12.5.6 Indonesia - Market size and forecast 2025-2030

Chart on Indonesia - Market size and forecast 2025-2030 ($ million)
Data Table on Indonesia - Market size and forecast 2025-2030 ($ million)
Chart on Indonesia - Year-over-year growth 2025-2030 (%)
Data Table on Indonesia - Year-over-year growth 2025-2030 (%)

12.6 Middle East and Africa - Market size and forecast 2025-2030

Chart on Middle East and Africa - Market size and forecast 2025-2030 ($ million)
Data Table on Middle East and Africa - Market size and forecast 2025-2030 ($ million)
Chart on Middle East and Africa - Year-over-year growth 2025-2030 (%)
Data Table on Middle East and Africa - Year-over-year growth 2025-2030 (%)
Chart on Regional Comparison - Middle East and Africa
Data Table on Regional Comparison - Middle East and Africa

12.6.1 UAE - Market size and forecast 2025-2030

Chart on UAE - Market size and forecast 2025-2030 ($ million)
Data Table on UAE - Market size and forecast 2025-2030 ($ million)
Chart on UAE - Year-over-year growth 2025-2030 (%)
Data Table on UAE - Year-over-year growth 2025-2030 (%)

12.6.2 Saudi Arabia - Market size and forecast 2025-2030

Chart on Saudi Arabia - Market size and forecast 2025-2030 ($ million)
Data Table on Saudi Arabia - Market size and forecast 2025-2030 ($ million)
Chart on Saudi Arabia - Year-over-year growth 2025-2030 (%)
Data Table on Saudi Arabia - Year-over-year growth 2025-2030 (%)

12.6.3 South Africa - Market size and forecast 2025-2030

Chart on South Africa - Market size and forecast 2025-2030 ($ million)
Data Table on South Africa - Market size and forecast 2025-2030 ($ million)
Chart on South Africa - Year-over-year growth 2025-2030 (%)
Data Table on South Africa - Year-over-year growth 2025-2030 (%)

12.6.4 Turkey - Market size and forecast 2025-2030

Chart on Turkey - Market size and forecast 2025-2030 ($ million)
Data Table on Turkey - Market size and forecast 2025-2030 ($ million)
Chart on Turkey - Year-over-year growth 2025-2030 (%)
Data Table on Turkey - Year-over-year growth 2025-2030 (%)

12.6.5 Egypt - Market size and forecast 2025-2030

Chart on Egypt - Market size and forecast 2025-2030 ($ million)
Data Table on Egypt - Market size and forecast 2025-2030 ($ million)
Chart on Egypt - Year-over-year growth 2025-2030 (%)
Data Table on Egypt - Year-over-year growth 2025-2030 (%)

12.7 South America - Market size and forecast 2025-2030

Chart on South America - Market size and forecast 2025-2030 ($ million)
Data Table on South America - Market size and forecast 2025-2030 ($ million)
Chart on South America - Year-over-year growth 2025-2030 (%)
Data Table on South America - Year-over-year growth 2025-2030 (%)
Chart on Regional Comparison - South America
Data Table on Regional Comparison - South America

12.7.1 Brazil - Market size and forecast 2025-2030

Chart on Brazil - Market size and forecast 2025-2030 ($ million)
Data Table on Brazil - Market size and forecast 2025-2030 ($ million)
Chart on Brazil - Year-over-year growth 2025-2030 (%)
Data Table on Brazil - Year-over-year growth 2025-2030 (%)

12.7.2 Argentina - Market size and forecast 2025-2030

Chart on Argentina - Market size and forecast 2025-2030 ($ million)
Data Table on Argentina - Market size and forecast 2025-2030 ($ million)
Chart on Argentina - Year-over-year growth 2025-2030 (%)
Data Table on Argentina - Year-over-year growth 2025-2030 (%)

12.7.3 Chile - Market size and forecast 2025-2030

Chart on Chile - Market size and forecast 2025-2030 ($ million)
Data Table on Chile - Market size and forecast 2025-2030 ($ million)
Chart on Chile - Year-over-year growth 2025-2030 (%)
Data Table on Chile - Year-over-year growth 2025-2030 (%)

12.8 Market opportunity by geography

Market opportunity by geography ($ million)
Data Tables on Market opportunity by geography ($ million)

13. Drivers, Challenges, and Opportunity

13.1 Market drivers

Persistent operating costs driving automation adoption
Proliferation of omnichannel dining and integrated digital ordering
Strategic integration of AI and data analytics for operational optimization

13.2 Market challenges

System interoperability fragmentation and data silo integration barriers
High capital acquisition costs and implementation complexity
Heightened cybersecurity vulnerabilities and strict data privacy

13.3 Impact of drivers and challenges

Impact of drivers and challenges in 2025 and 2030

13.4 Market opportunities

Accelerated shift toward unified cloud-native point-of-sale architectures
Integration of conversational voice and automated drive interfaces
Expansion of computer vision and smart sensors in back-of-house kitchen

14. Competitive Landscape

14.1 Overview

14.2

Overview on criticality of inputs and factors of differentiation

14.3 Landscape disruption

Overview on factors of disruption

14.4 Industry risks

Impact of key risks on business

15. Competitive Analysis

15.1 Companies profiled

Companies covered

15.2 Company ranking index

15.3 Market positioning of companies

Matrix on companies position and classification

15.4 Agilysys Inc.

Agilysys Inc. - Overview
Agilysys Inc. - Business segments
Agilysys Inc. - Key offerings
Agilysys Inc. - Segment focus
SWOT

15.5 Block Inc.

Block Inc. - Overview
Block Inc. - Business segments
Block Inc. - Key offerings
Block Inc. - Segment focus
SWOT

15.6 ChowNow Inc.

ChowNow Inc. - Overview
ChowNow Inc. - Product / Service
ChowNow Inc. - Key offerings
SWOT

15.7 Clover Network LLC

Clover Network LLC - Overview
Clover Network LLC - Product / Service
Clover Network LLC - Key offerings
SWOT

15.8 Fourth Enterprises LLC

Fourth Enterprises LLC - Overview
Fourth Enterprises LLC - Product / Service
Fourth Enterprises LLC - Key offerings
SWOT

15.9 NCR Payment Solutions LLC

NCR Payment Solutions LLC - Overview
NCR Payment Solutions LLC - Business segments
NCR Payment Solutions LLC - Key offerings
NCR Payment Solutions LLC - Segment focus
SWOT

15.10 Odoo SA

Odoo SA - Overview
Odoo SA - Product / Service
Odoo SA - Key offerings
SWOT

15.11 Olo Inc.

Olo Inc. - Overview
Olo Inc. - Product / Service
Olo Inc. - Key offerings
SWOT

15.12 OpenTable Inc.

OpenTable Inc. - Overview
OpenTable Inc. - Product / Service
OpenTable Inc. - Key offerings
SWOT

15.13 Oracle Corp.

Oracle Corp. - Overview
Oracle Corp. - Business segments
Oracle Corp. - Key news
Oracle Corp. - Key offerings
Oracle Corp. - Segment focus
SWOT

15.14 Shift4 Payments Inc.

Shift4 Payments Inc. - Overview
Shift4 Payments Inc. - Business segments
Shift4 Payments Inc. - Key offerings
Shift4 Payments Inc. - Segment focus
SWOT

15.15 SmartSense

SmartSense - Overview
SmartSense - Product / Service
SmartSense - Key offerings
SWOT

15.16 SpotOn Transact LLC

SpotOn Transact LLC - Overview
SpotOn Transact LLC - Product / Service
SpotOn Transact LLC - Key offerings
SWOT

15.17 Toast Inc.

Toast Inc. - Overview
Toast Inc. - Product / Service
Toast Inc. - Key offerings
SWOT

15.18 TouchBistro Inc.

TouchBistro Inc. - Overview
TouchBistro Inc. - Product / Service
TouchBistro Inc. - Key offerings
SWOT

16. Appendix

16.1 Scope of the report

Market definition
Objectives
Notes and caveats

16.2 Inclusions and exclusions checklist

Inclusions checklist
Exclusions checklist

16.3 Currency conversion rates for US$

16.4 Research methodology

16.5 Data procurement

Information sources

16.6 Data validation

16.7 Validation techniques employed for market sizing

16.8 Data synthesis

16.9 360 degree market analysis

16.10 List of abbreviations

Research Methodology

Technavio presents a detailed picture of the market by way of study, synthesis, and summation of data from multiple sources. The analysts have presented the various facets of the market with a particular focus on identifying the key industry influencers. The data thus presented is comprehensive, reliable, and the result of extensive research, both primary and secondary.

INFORMATION SOURCES

Primary sources

  • Manufacturers and suppliers
  • Channel partners
  • Industry experts
  • Strategic decision makers

Secondary sources

  • Industry journals and periodicals
  • Government data
  • Financial reports of key industry players
  • Historical data
  • Press releases

DATA ANALYSIS

Data Synthesis

  • Collation of data
  • Estimation of key figures
  • Analysis of derived insights

Data Validation

  • Triangulation with data models
  • Reference against proprietary databases
  • Corroboration with industry experts

REPORT WRITING

Qualitative

  • Market drivers
  • Market challenges
  • Market trends
  • Five forces analysis

Quantitative

  • Market size and forecast
  • Market segmentation
  • Geographical insights
  • Competitive landscape

Interested in this report?

Get your sample now to see our research methodology and insights!

Download Now

Frequently Asked Questions

Restaurant Technology market growth will increase by USD 15684.5 million during 2026-2030.

The Restaurant Technology market is expected to grow at a CAGR of 16.4% during 2026-2030.

Restaurant Technology market is segmented by Type (RMS, Point of sale systems, Online ordering systems, Payment processing solutions, Others) End-user (Quick-service restaurants, Full-service restaurants, Others) Deployment (Cloud-based, On-premise, Hybrid)

7shifts Employee Scheduling, Agilysys Inc., Block Inc., ChowNow Inc., Clover Network LLC, Digitory Solutions Pvt. Ltd., Fishbowl Inc., Fourth Enterprises LLC, HungerRush Inc, MarginEdge Co., NCR Payment Solutions LLC, Odoo SA, Olo Inc., OpenTable Inc., Oracle Corp., Shift4 Payments Inc., SmartSense, SpotOn Transact LLC, Toast Inc., TouchBistro Inc. are a few of the key vendors in the Restaurant Technology market.

North America will register the highest growth rate of 37.3% among the other regions. Therefore, the Restaurant Technology market in North America is expected to garner significant business opportunities for the vendors during the forecast period.

US, Canada, Mexico, UK, Germany, France, Italy, Spain, The Netherlands, China, India, Japan, Australia, South Korea, Indonesia, UAE, Saudi Arabia, South Africa, Turkey, Egypt, Brazil, Argentina, Chile

  • Persistent operating costs driving automation adoption is the driving factor this market.

The Restaurant Technology market vendors should focus on grabbing business opportunities from the Type segment as it accounted for the largest market share in the base year.
RIA - Research AI Assistant
Ask RIA