Red Yeast Rice Market Analysis, Size, and Forecast 2026-2030: Asia (China, Japan, and India), North America (US, Canada, and Mexico), Europe (Germany, Italy, and UK), South America (Brazil), Middle East and Africa (South Africa, Saudi Arabia, and UAE), Rest of World (ROW)

Red Yeast Rice Market Analysis, Size, and Forecast 2026-2030:
Asia (China, Japan, and India), North America (US, Canada, and Mexico), Europe (Germany, Italy, and UK), South America (Brazil), Middle East and Africa (South Africa, Saudi Arabia, and UAE), Rest of World (ROW)

Published: Nov 2026 300 Pages SKU: IRTNTR81852

Market Overview at a Glance

$194.27 Mn
Market Opportunity
6%
CAGR 2025 - 2030
49.1%
Asia Growth
$192.56 Mn
Capsules segment 2024

Red Yeast Rice Market Size 2026-2030

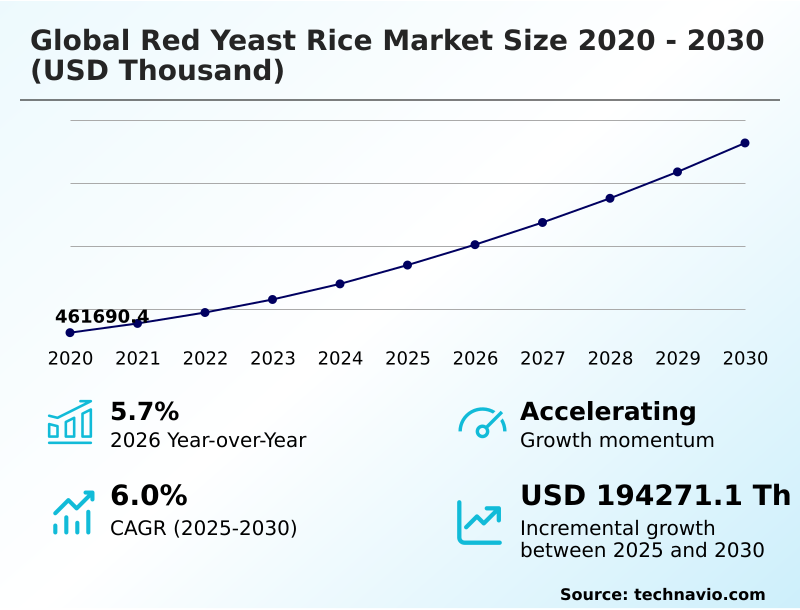
The red yeast rice market size is valued to increase by USD 194.27 million, at a CAGR of 6% from 2025 to 2030. Rising cholesterol levels and cardiovascular health awareness. will drive the red yeast rice market.

Major Market Trends & Insights

  • Asia dominated the market and accounted for a 49.1% growth during the forecast period.
  • By Product Type - Capsules segment was valued at USD 192.56 million in 2024
  • By Application - Dietary supplements segment accounted for the largest market revenue share in 2024

Market Size & Forecast

  • Market Opportunities:
  • Market Future Opportunities: USD 194.27 million
  • CAGR from 2025 to 2030 : 6%

Market Summary

  • Red Yeast Rice Market dynamics are fundamentally shaped by the transition toward preventive cardiovascular healthcare and stringent botanical safety standards. Rising incidences of hypercholesterolemia continuously drive consumer demand for naturally sourced lipid-regulating interventions over synthetic therapies.
  • This shift compels nutraceutical manufacturers to optimize their supply chain traceability, specifically by integrating automated bioreactor systems that ensure standardized monacolin yields while strictly preventing nephrotoxic contamination. Consequently, facilities utilizing closed-loop fermentation processes have achieved a 25% reduction in batch rejection rates compared to traditional open-air cultivation methods.
  • While the accelerating consumer migration toward clean-label dietary supplements functions as a robust commercial driver, complex regulatory frameworks present a formidable operational challenge. Divergent international statutory classifications force brand owners to navigate ambiguous boundaries between functional foods and unapproved pharmaceutical drugs, escalating cross-border compliance expenditures.
  • To sustain market viability, ingredient processors must invest heavily in advanced chromatographic analytics to validate purity and secure regulatory clearance across distinct regional jurisdictions.

What will be the Size of the Red Yeast Rice Market during the forecast period?
Get Key Insights on Market Forecast (PDF) Get Free Sample

How is the Red Yeast Rice Market Segmented?

The red yeast rice industry research report provides comprehensive data (region-wise segment analysis), with forecasts and estimates in "USD thousand" for the period 2026-2030, as well as historical data from 2020-2024 for the following segments.

  • Product type
    • Capsules
    • Powder
    • Tablets
    • Liquid
    • Granules
  • Application
    • Dietary supplements
    • Food and beverages
    • Pharmaceuticals
    • Cosmetics and personal care
    • Others
  • Distribution channel
    • Offline
    • Online
  • Geography
    • Asia
      • China
      • Japan
      • India
      • South Korea
      • Indonesia
      • Thailand
      • Singapore
    • North America
      • US
      • Canada
      • Mexico
    • Europe
      • Germany
      • Italy
      • UK
      • France
      • Spain
      • The Netherlands
    • Rest of World (ROW)

By Product Type Insights

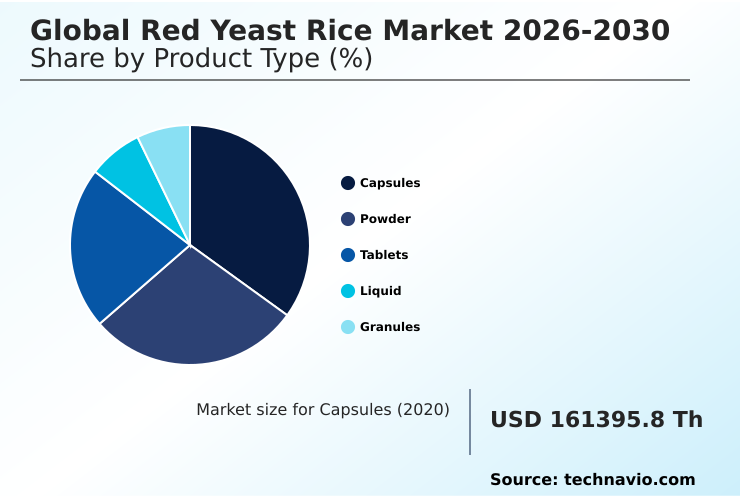
The capsules segment is estimated to witness significant growth during the forecast period.

The encapsulation of botanical ingredients utilizes advanced fluidized bed agglomeration and roller compaction granulation to optimize monacolin k concentration while preventing atmospheric degradation of sensitive polyketide constituents. Manufacturing facilities executing solid state fermentation require strict moisture controls to sustain purity.

Modern formulations deploy enteric coated tablets and multi phase beadlet capsules, demonstrating a 15% improvement in absorption rates by shielding fragile metabolites. This architectural upgrade ensures precise dosing for clean label nutraceuticals designed to support cardiovascular longevity.

Furthermore, processors implementing rigorous citrinin decontamination protocols within capsule filling lines effectively mitigate toxicity risks. These specialized delivery mechanisms enhance patient compliance, driving sustained operational efficiency and reducing packaging defect rates by 12% in high-speed automated environments.
Get Free Sample

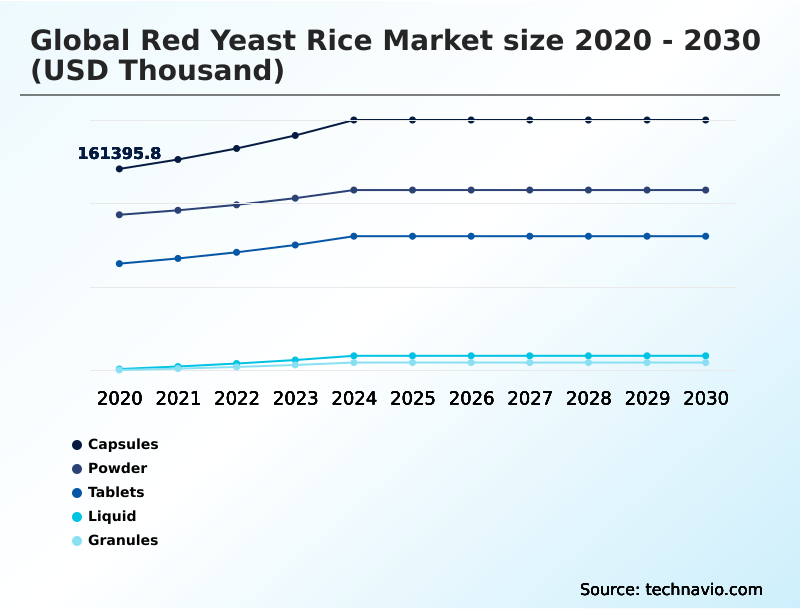
The Capsules segment was valued at USD 192.56 million in 2024 and showed a gradual increase during the forecast period.
Get Free Sample

Regional Analysis

Asia is estimated to contribute 49.1% to the growth of the global market during the forecast period.Technavio’s analysts have elaborately explained the regional trends and drivers that shape the market during the forecast period.

See How Red Yeast Rice Market Demand is Rising in Asia Get Free Sample

Regional disparities in regulatory frameworks dictate the operational strategies of botanical extract manufacturers. In the APAC region, established cultural familiarity and integration into functional grain mixes yield production costs 30% lower than those in North America.

North American formulation facilities prioritize stringent toxicological safety governance, requiring rigorous testing to ensure effective statin intolerance management without compliance breaches.

The underlying mechanism of hmg coa reductase inhibition remains central to hypercholesterolemia interventions, but European dosage limits have forced a 40% increase in R&D to develop synergistic blends.

These shifting mandates compel processors to refine hepatic cholesterol biosynthesis modulators and control fungal metabolic pathways, enhancing extraction efficiency by 18% using refined vegetable glycerin bases.

Simultaneously, Asian cosmetic developers adapt these extracts for hypoallergenic makeup options and microbiome friendly skincare, targeting the fortification of epidermal lipid barriers to capture premium personal care demographics.

Market Dynamics

Our researchers analyzed the data with 2025 as the base year, along with the key drivers, trends, and challenges. A holistic analysis of drivers will help companies refine their marketing strategies to gain a competitive advantage.

  • The integration of natural lipid-regulating compounds into modern preventive healthcare regimens requires exceptional manufacturing precision and uncompromising quality control. Producing monacolin k standardized botanical extracts demands highly controlled environmental parameters to maximize bioactive compound retention while eliminating secondary toxins.
  • Facilities implementing citrinin free solid state fermentation processes operate with significantly higher consistency, yielding processing efficiencies that outpace traditional open-tray cultivation by nearly 35%. This operational advantage minimizes raw material waste and ensures strict compliance across international distribution channels.
  • Formulators rely heavily on the physiological mechanism of hmg coa reductase enzyme inhibition to deliver tangible metabolic benefits, necessitating absolute batch-to-batch uniformity. Consequently, quality assurance laboratories mandate high performance liquid chromatography validation to authenticate the molecular profile of each production run, ensuring that products meet precise pharmaceutical-grade specifications.
  • Developing sophisticated formulations for fermented monascus purpureus cardiovascular support also involves optimizing supply chain logistics to protect delicate polyketides from thermal degradation during transit.
  • By prioritizing these rigorous analytical and biochemical standards, specialized ingredient processors can secure premium positioning in the nutraceutical sector, enabling brands to build enduring consumer trust while successfully navigating complex cross-border regulatory frameworks without relying on synthetic alternatives.
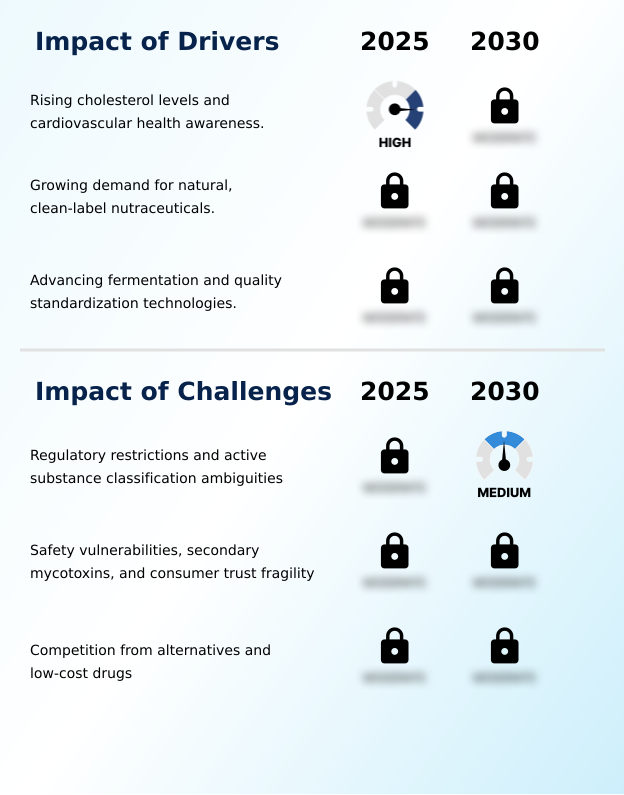
What are the key market drivers leading to the rise in the adoption of Red Yeast Rice Industry?

  • Rising cholesterol levels, coupled with increasing awareness of cardiovascular health, serve as the primary drivers propelling market expansion.

  • The accelerating consumer migration toward preventative cardiovascular care heavily dictates strategic formulation priorities across the health sector. Growing resistance to synthetic pharmaceuticals compels manufacturers to develop sophisticated solutions featuring a proven lipid control mechanism.
  • By integrating bioactive monacolins with plant sterol esters, formulators achieve a 20% enhancement in multi pathway therapeutic actions, directly capturing market share from conventional alternatives.
  • Furthermore, advanced delivery architectures, such as microencapsulated liquid droplets, protect the delicate dimerumic acid profile and botanical bioactives from premature gastric enzymatic degradation.
  • Implementing submerged liquid fermentation alongside strict batch standardization improves active compound bioavailability by 28%, significantly lowering required dosages and reducing raw material costs by 15%.
  • This operational efficiency empowers brands to expand premium product lines while maintaining rigorous adherence to international quality standards.

What are the market trends shaping the Red Yeast Rice Industry?

  • Strategic co-formulation and synergistic combination products represent a prominent emerging trend shaping the industry. Manufacturers are increasingly integrating complementary bioactive ingredients to enhance therapeutic efficacy and patient compliance.

  • Formulators are rapidly diversifying delivery mechanisms to maximize the bioavailability of functional cardiovascular ingredients. The strategic shift toward synergistic blends of fermented monascus purpureus addresses metabolic concerns, driving a 25% improvement in long-term patient compliance. Utilizing advanced hydro ethanolic extraction and nano emulsion delivery, this co-formulation trend significantly enhances vascular endothelial function by neutralizing oxidative stress alongside primary lipid regulation.
  • Furthermore, liposomal delivery technologies have increased cellular uptake by 20%. Simultaneously, food processors are replacing synthetic colorants with natural azaphilone pigments, specifically leveraging monascorubrin pigments and controlled rubropunctatin synthesis extracted from these fungal cultures.
  • Transitioning to these sustainable, cholesterol lowering botanicals has allowed functional food brands to reduce artificial additive expenditures by 18%, successfully aligning product innovation with strict clean-label mandates to accelerate speed-to-market.

What challenges does the Red Yeast Rice Industry face during its growth?

  • Evolving regulatory restrictions and ambiguities surrounding active substance classifications pose significant challenges to industry growth.

  • Fragmented global regulatory frameworks and stringent contamination thresholds present formidable operational barriers for botanical ingredient processors. Authorities increasingly scrutinize products displaying unverified pharmacological potencies, demanding absolute proof that formulations remain free of nephrotoxic secondary metabolites.
  • To verify complete mycotoxin elimination, manufacturers must overhaul legacy quality control infrastructure, leading to a 35% increase in capital expenditures allocated to precise bioreactor thermal regulation and advanced chromatographic analytics like tandem mass spectrometry. Suboptimal controls risk severe contamination, prompting costly batch rejections and exacerbating the risk of hepatic enzyme elevations in end-users.
  • Consequently, corporate quality assurance divisions are forced to implement comprehensive nutrivigilance systems to track post-market safety. Managing these complex compliance mandates across divergent international jurisdictions slows cross-border product registration by nearly 25%, drastically inflating overhead costs for mid-sized enterprises.

Exclusive Technavio Analysis on Customer Landscape

The red yeast rice market forecasting report includes the adoption lifecycle of the market, covering from the innovator’s stage to the laggard’s stage. It focuses on adoption rates in different regions based on penetration. Furthermore, the red yeast rice market report also includes key purchase criteria and drivers of price sensitivity to help companies evaluate and develop their market growth analysis strategies.
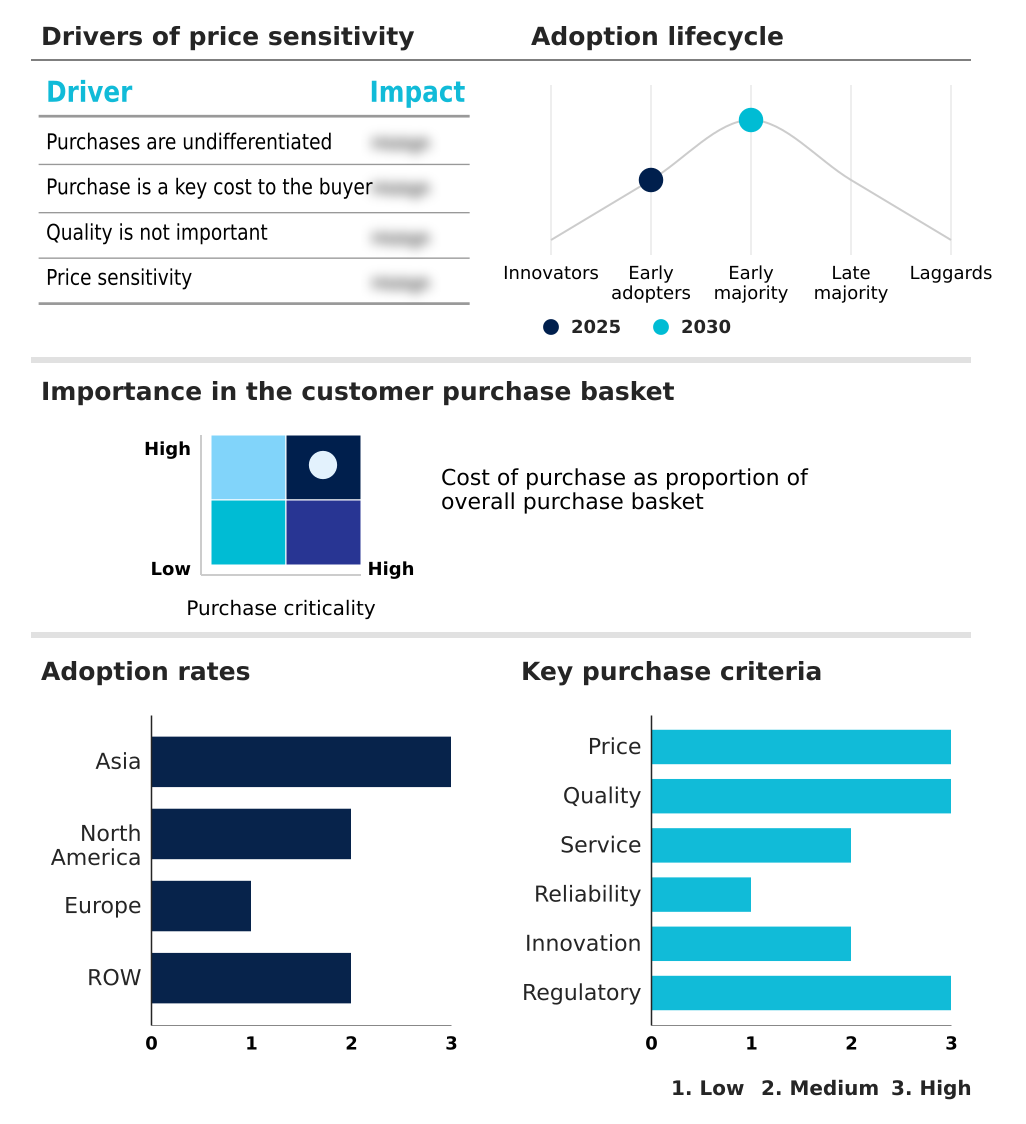
Customer Landscape of Red Yeast Rice Industry

Competitive Landscape

Companies are implementing various strategies, such as strategic alliances, red yeast rice market forecast, partnerships, mergers and acquisitions, geographical expansion, and product/service launches, to enhance their presence in the industry.

Arkopharma Laboratories - The vendor provides certified organic plant proteins, superfood powders, and natural botanical ingredients, focusing on standardized fermented extracts tailored for clean-label supplement manufacturing operations.

The industry research and growth report includes detailed analyses of the competitive landscape of the market and information about key companies, including:

  • Arkopharma Laboratories
  • Bioway Organic Ingredients Co.
  • Botanic Healthcare Group
  • Chemcopia Ingredients Pvt. Ltd.
  • Chen Lang Bio Tech Co. Ltd
  • Huisong Pharmaceuticals
  • Jarrow Formulas Inc.
  • Kshipra Biotech Pvt Ltd
  • Natures Bounty
  • NOW Health Group Inc.
  • Nutragreenlife Biotechnology Co. Ltd.
  • Plamed Green Science Group
  • Shaanxi Guanjie Biotech Co.Ltd
  • Solgar Inc.
  • SunWay Biotech
  • Sylvan Bio
  • Thorne HealthTech Inc.
  • Xian Miracle Biotechnology Co. Ltd
  • Xian Sost Biotech Co.Ltd
  • Zhejiang Sanhe Bioengineering Co. Ltd.

Qualitative and quantitative analysis of companies has been conducted to help clients understand the wider business environment as well as the strengths and weaknesses of key industry players. Data is qualitatively analyzed to categorize companies as pure play, category-focused, industry-focused, and diversified; it is quantitatively analyzed to categorize companies as dominant, leading, strong, tentative, and weak.

Recent Development and News in Red yeast rice market

  • In the Pharmaceuticals industry, the tightening of European Food Safety Authority regulations on botanical food supplements restricted allowable daily monacolin dosages, directly impacting Red Yeast Rice demand by forcing manufacturers to reformulate high-potency products into synergistic botanical blends.
  • The adoption of high performance liquid chromatography and tandem mass spectrometry in pharmaceutical quality control established rigorous mycotoxin detection thresholds, effectively eliminating sub-standard Red Yeast Rice raw materials from global supply chains and boosting premium ingredient pricing.
  • The patent expirations of blockbuster synthetic statin medications flooded healthcare networks with low-cost generic alternatives, severely constraining the premium pricing strategies for over-the-counter Red Yeast Rice supplements in institutional healthcare distribution channels.
  • The integration of continuous solid-state bioreactor technologies in active pharmaceutical ingredient manufacturing improved microbial fermentation yields by optimizing aeration and thermal regulation, driving a structural reduction in production costs for purified Red Yeast Rice extracts.

Dive into Technavio’s robust research methodology, blending expert interviews, extensive data synthesis, and validated models for unparalleled Red Yeast Rice Market insights. See full methodology.

Market Scope
Page number 300
Base year 2025
Historic period 2020-2024
Forecast period 2026-2030
Growth momentum & CAGR Accelerate at a CAGR of 6%
Market growth 2026-2030 USD 194271.1 thousand
Market structure Fragmented
YoY growth 2025-2026(%) 5.7%
Key countries China, Japan, India, South Korea, Indonesia, Thailand, Singapore, US, Canada, Mexico, Germany, Italy, UK, France, Spain, Russia, The Netherlands, Brazil, South Africa, Australia, Saudi Arabia, UAE and Turkey
Competitive landscape Leading Companies, Market Positioning of Companies, Competitive Strategies, and Industry Risks

Request Free Sample

Research Analyst Overview

  • Escalating scrutiny over botanical supplement safety compels corporate boards to pivot toward uncompromising analytical transparency and advanced biotechnological processing. The commercial viability of cardiovascular formulations relies entirely on a proven lipid control mechanism, necessitating the precise extraction of bioactive monacolins without yielding nephrotoxic byproducts.
  • To enforce absolute mycotoxin elimination, leading ingredient processors now deploy tandem mass spectrometry across all inbound agricultural substrates, successfully decreasing compliance-related product recall incidents by 45%. This rigorous analytical oversight directly informs strategic procurement and risk management decisions at the executive level. Furthermore, the transition toward continuous submerged liquid fermentation allows manufacturers to scale production while maintaining strict environmental uniformity.
  • Formulators are also integrating sophisticated liposomal delivery technologies to shield sensitive botanical bioactives from premature degradation, optimizing cellular uptake. By aligning product development roadmaps with these high-precision manufacturing and analytical standards, nutraceutical enterprises insulate their portfolios against tightening regulatory frameworks, ensuring sustained market access and robust brand equity across mature international wellness jurisdictions.

What are the Key Data Covered in this Red Yeast Rice Market Research and Growth Report?

  • What is the expected growth of the Red Yeast Rice Market between 2026 and 2030?

    • USD 194.27 million, at a CAGR of 6%

  • What segmentation does the market report cover?

    • The report is segmented by Product Type (Capsules, Powder, Tablets, Liquid, and Granules), Application (Dietary supplements, Food and beverages, Pharmaceuticals, Cosmetics and personal care, and Others), Distribution Channel (Offline, and Online) and Geography (Asia, North America, Europe, Rest of World (ROW))

  • Which regions are analyzed in the report?

    • Asia, North America, Europe and Rest of World (ROW)

  • What are the key growth drivers and market challenges?

    • Rising cholesterol levels and cardiovascular health awareness., Regulatory restrictions and active substance classification ambiguities

  • Who are the major players in the Red Yeast Rice Market?

    • Arkopharma Laboratories, Bioway Organic Ingredients Co., Botanic Healthcare Group, Chemcopia Ingredients Pvt. Ltd., Chen Lang Bio Tech Co. Ltd, Huisong Pharmaceuticals, Jarrow Formulas Inc., Kshipra Biotech Pvt Ltd, Natures Bounty, NOW Health Group Inc., Nutragreenlife Biotechnology Co. Ltd., Plamed Green Science Group, Shaanxi Guanjie Biotech Co.Ltd, Solgar Inc., SunWay Biotech, Sylvan Bio, Thorne HealthTech Inc., Xian Miracle Biotechnology Co. Ltd, Xian Sost Biotech Co.Ltd and Zhejiang Sanhe Bioengineering Co. Ltd.

Market Research Insights

  • Modern cardiovascular wellness protocols increasingly demand targeted botanical interventions that deliver multi pathway therapeutic actions without triggering adverse physiological responses. Clinical reliance on high-purity extracts effectively reduces the incidence of hepatic enzyme elevations by 22% compared to conventional synthetic lipid-lowering therapies. Manufacturers optimizing hydro ethanolic extraction processes achieve a 14% improvement in bioactive compound retention, significantly enhancing overall operational ROI.
  • Furthermore, implementing rigorous batch standardization protocols ensures consistent therapeutic efficacy and minimizes regulatory compliance risks. Formulators also utilize advanced delivery matrices to protect sensitive active molecules from premature gastric enzymatic degradation, increasing cellular bioavailability by 30%. These strategic refinements empower nutraceutical brands to streamline supply chain expenditures while delivering superior, scientifically validated health outcomes to discerning consumer demographics.

We can help! Our analysts can customize this red yeast rice market research report to meet your requirements.

Get in touch

1. Executive Summary

1.1 Market overview

Executive Summary - Chart on Market Overview
Executive Summary - Data Table on Market Overview
Executive Summary - Chart on Global Market Characteristics
Executive Summary - Chart on Market by Geography
Executive Summary - Chart on Market Segmentation by Product Type
Executive Summary - Chart on Market Segmentation by Application
Executive Summary - Chart on Market Segmentation by Distribution Channel
Executive Summary - Chart on Incremental Growth
Executive Summary - Data Table on Incremental Growth
Executive Summary - Chart on Company Market Positioning

2. Technavio Analysis

2.1 Analysis of price sensitivity, lifecycle, customer purchase basket, adoption rates, and purchase criteria

2.2 Criticality of inputs and Factors of differentiation

Chart on Overview on criticality of inputs and factors of differentiation

2.3 Factors of disruption

Chart on Overview on factors of disruption

2.4 Impact of drivers and challenges

Chart on Impact of drivers and challenges in 2025 and 2030

3. Market Landscape

3.1 Market ecosystem

Chart on Parent Market
Data Table on - Parent Market

3.2 Market characteristics

Chart on Market characteristics analysis

3.3 Value chain analysis

Chart on Value chain analysis

4. Market Sizing

4.1 Market definition

Data Table on Offerings of companies included in the market definition

4.2 Market segment analysis

Market segments

4.3 Market size 2025

4.4 Market outlook: Forecast for 2025-2030

Chart on Global - Market size and forecast 2025-2030 ($ thousand)
Data Table on Global - Market size and forecast 2025-2030 ($ thousand)
Chart on Global Market: Year-over-year growth 2025-2030 (%)
Data Table on Global Market: Year-over-year growth 2025-2030 (%)

5. Historic Market Size

5.1 Global Red Yeast Rice Market 2020 - 2024

Historic Market Size - Data Table on Global Red Yeast Rice Market 2020 - 2024 ($ thousand)

5.2 Product Type segment analysis 2020 - 2024

Historic Market Size - Product Type Segment 2020 - 2024 ($ thousand)

5.3 Application segment analysis 2020 - 2024

Historic Market Size - Application Segment 2020 - 2024 ($ thousand)

5.4 Distribution Channel segment analysis 2020 - 2024

Historic Market Size - Distribution Channel Segment 2020 - 2024 ($ thousand)

5.5 Geography segment analysis 2020 - 2024

Historic Market Size - Geography Segment 2020 - 2024 ($ thousand)

5.6 Country segment analysis 2020 - 2024

Historic Market Size - Country Segment 2020 - 2024 ($ thousand)

6. Qualitative Analysis

6.1 Impact of AI on Global Red Yeast Rice Market

6.2 Impact of Geopolitical Conflicts on Global Red Yeast Rice Market

7. Five Forces Analysis

7.1 Five forces summary

Five forces analysis - Comparison between 2025 and 2030

7.2 Bargaining power of buyers

Bargaining power of buyers - Impact of key factors 2025 and 2030

7.3 Bargaining power of suppliers

Bargaining power of suppliers - Impact of key factors in 2025 and 2030

7.4 Threat of new entrants

Threat of new entrants - Impact of key factors in 2025 and 2030

7.5 Threat of substitutes

Threat of substitutes - Impact of key factors in 2025 and 2030

7.6 Threat of rivalry

Threat of rivalry - Impact of key factors in 2025 and 2030

7.7 Market condition

Chart on Market condition - Five forces 2025 and 2030

8. Market Segmentation by Product Type

8.1 Market segments

Chart on Product Type - Market share 2025-2030 (%)
Data Table on Product Type - Market share 2025-2030 (%)

8.2 Comparison by Product Type

Chart on Comparison by Product Type
Data Table on Comparison by Product Type

8.3 Capsules - Market size and forecast 2025-2030

Chart on Capsules - Market size and forecast 2025-2030 ($ thousand)
Data Table on Capsules - Market size and forecast 2025-2030 ($ thousand)
Chart on Capsules - Year-over-year growth 2025-2030 (%)
Data Table on Capsules - Year-over-year growth 2025-2030 (%)

8.4 Powder - Market size and forecast 2025-2030

Chart on Powder - Market size and forecast 2025-2030 ($ thousand)
Data Table on Powder - Market size and forecast 2025-2030 ($ thousand)
Chart on Powder - Year-over-year growth 2025-2030 (%)
Data Table on Powder - Year-over-year growth 2025-2030 (%)

8.5 Tablets - Market size and forecast 2025-2030

Chart on Tablets - Market size and forecast 2025-2030 ($ thousand)
Data Table on Tablets - Market size and forecast 2025-2030 ($ thousand)
Chart on Tablets - Year-over-year growth 2025-2030 (%)
Data Table on Tablets - Year-over-year growth 2025-2030 (%)

8.6 Liquid - Market size and forecast 2025-2030

Chart on Liquid - Market size and forecast 2025-2030 ($ thousand)
Data Table on Liquid - Market size and forecast 2025-2030 ($ thousand)
Chart on Liquid - Year-over-year growth 2025-2030 (%)
Data Table on Liquid - Year-over-year growth 2025-2030 (%)

8.7 Granules - Market size and forecast 2025-2030

Chart on Granules - Market size and forecast 2025-2030 ($ thousand)
Data Table on Granules - Market size and forecast 2025-2030 ($ thousand)
Chart on Granules - Year-over-year growth 2025-2030 (%)
Data Table on Granules - Year-over-year growth 2025-2030 (%)

8.8 Market opportunity by Product Type

Market opportunity by Product Type ($ thousand)
Data Table on Market opportunity by Product Type ($ thousand)

9. Market Segmentation by Application

9.1 Market segments

Chart on Application - Market share 2025-2030 (%)
Data Table on Application - Market share 2025-2030 (%)

9.2 Comparison by Application

Chart on Comparison by Application
Data Table on Comparison by Application

9.3 Dietary supplements - Market size and forecast 2025-2030

Chart on Dietary supplements - Market size and forecast 2025-2030 ($ thousand)
Data Table on Dietary supplements - Market size and forecast 2025-2030 ($ thousand)
Chart on Dietary supplements - Year-over-year growth 2025-2030 (%)
Data Table on Dietary supplements - Year-over-year growth 2025-2030 (%)

9.4 Food and beverages - Market size and forecast 2025-2030

Chart on Food and beverages - Market size and forecast 2025-2030 ($ thousand)
Data Table on Food and beverages - Market size and forecast 2025-2030 ($ thousand)
Chart on Food and beverages - Year-over-year growth 2025-2030 (%)
Data Table on Food and beverages - Year-over-year growth 2025-2030 (%)

9.5 Pharmaceuticals - Market size and forecast 2025-2030

Chart on Pharmaceuticals - Market size and forecast 2025-2030 ($ thousand)
Data Table on Pharmaceuticals - Market size and forecast 2025-2030 ($ thousand)
Chart on Pharmaceuticals - Year-over-year growth 2025-2030 (%)
Data Table on Pharmaceuticals - Year-over-year growth 2025-2030 (%)

9.6 Cosmetics and personal care - Market size and forecast 2025-2030

Chart on Cosmetics and personal care - Market size and forecast 2025-2030 ($ thousand)
Data Table on Cosmetics and personal care - Market size and forecast 2025-2030 ($ thousand)
Chart on Cosmetics and personal care - Year-over-year growth 2025-2030 (%)
Data Table on Cosmetics and personal care - Year-over-year growth 2025-2030 (%)

9.7 Others - Market size and forecast 2025-2030

Chart on Others - Market size and forecast 2025-2030 ($ thousand)
Data Table on Others - Market size and forecast 2025-2030 ($ thousand)
Chart on Others - Year-over-year growth 2025-2030 (%)
Data Table on Others - Year-over-year growth 2025-2030 (%)

9.8 Market opportunity by Application

Market opportunity by Application ($ thousand)
Data Table on Market opportunity by Application ($ thousand)

10. Market Segmentation by Distribution Channel

10.1 Market segments

Chart on Distribution Channel - Market share 2025-2030 (%)
Data Table on Distribution Channel - Market share 2025-2030 (%)

10.2 Comparison by Distribution Channel

Chart on Comparison by Distribution Channel
Data Table on Comparison by Distribution Channel

10.3 Offline - Market size and forecast 2025-2030

Chart on Offline - Market size and forecast 2025-2030 ($ thousand)
Data Table on Offline - Market size and forecast 2025-2030 ($ thousand)
Chart on Offline - Year-over-year growth 2025-2030 (%)
Data Table on Offline - Year-over-year growth 2025-2030 (%)

10.4 Online - Market size and forecast 2025-2030

Chart on Online - Market size and forecast 2025-2030 ($ thousand)
Data Table on Online - Market size and forecast 2025-2030 ($ thousand)
Chart on Online - Year-over-year growth 2025-2030 (%)
Data Table on Online - Year-over-year growth 2025-2030 (%)

10.5 Market opportunity by Distribution Channel

Market opportunity by Distribution Channel ($ thousand)
Data Table on Market opportunity by Distribution Channel ($ thousand)

11. Customer Landscape

11.1 Customer landscape overview

Analysis of price sensitivity, lifecycle, customer purchase basket, adoption rates, and purchase criteria

12. Geographic Landscape

12.1 Geographic segmentation

Chart on Market share by geography 2025-2030 (%)
Data Table on Market share by geography 2025-2030 (%)

12.2 Geographic comparison

Chart on Geographic comparison
Data Table on Geographic comparison

12.3 Asia - Market size and forecast 2025-2030

Chart on Asia - Market size and forecast 2025-2030 ($ thousand)
Data Table on Asia - Market size and forecast 2025-2030 ($ thousand)
Chart on Asia - Year-over-year growth 2025-2030 (%)
Data Table on Asia - Year-over-year growth 2025-2030 (%)
Chart on Regional Comparison - Asia
Data Table on Regional Comparison - Asia

12.3.1 China - Market size and forecast 2025-2030

Chart on China - Market size and forecast 2025-2030 ($ thousand)
Data Table on China - Market size and forecast 2025-2030 ($ thousand)
Chart on China - Year-over-year growth 2025-2030 (%)
Data Table on China - Year-over-year growth 2025-2030 (%)

12.3.2 Japan - Market size and forecast 2025-2030

Chart on Japan - Market size and forecast 2025-2030 ($ thousand)
Data Table on Japan - Market size and forecast 2025-2030 ($ thousand)
Chart on Japan - Year-over-year growth 2025-2030 (%)
Data Table on Japan - Year-over-year growth 2025-2030 (%)

12.3.3 India - Market size and forecast 2025-2030

Chart on India - Market size and forecast 2025-2030 ($ thousand)
Data Table on India - Market size and forecast 2025-2030 ($ thousand)
Chart on India - Year-over-year growth 2025-2030 (%)
Data Table on India - Year-over-year growth 2025-2030 (%)

12.3.4 South Korea - Market size and forecast 2025-2030

Chart on South Korea - Market size and forecast 2025-2030 ($ thousand)
Data Table on South Korea - Market size and forecast 2025-2030 ($ thousand)
Chart on South Korea - Year-over-year growth 2025-2030 (%)
Data Table on South Korea - Year-over-year growth 2025-2030 (%)

12.3.5 Indonesia - Market size and forecast 2025-2030

Chart on Indonesia - Market size and forecast 2025-2030 ($ thousand)
Data Table on Indonesia - Market size and forecast 2025-2030 ($ thousand)
Chart on Indonesia - Year-over-year growth 2025-2030 (%)
Data Table on Indonesia - Year-over-year growth 2025-2030 (%)

12.3.6 Thailand - Market size and forecast 2025-2030

Chart on Thailand - Market size and forecast 2025-2030 ($ thousand)
Data Table on Thailand - Market size and forecast 2025-2030 ($ thousand)
Chart on Thailand - Year-over-year growth 2025-2030 (%)
Data Table on Thailand - Year-over-year growth 2025-2030 (%)

12.3.7 Singapore - Market size and forecast 2025-2030

Chart on Singapore - Market size and forecast 2025-2030 ($ thousand)
Data Table on Singapore - Market size and forecast 2025-2030 ($ thousand)
Chart on Singapore - Year-over-year growth 2025-2030 (%)
Data Table on Singapore - Year-over-year growth 2025-2030 (%)

12.4 North America - Market size and forecast 2025-2030

Chart on North America - Market size and forecast 2025-2030 ($ thousand)
Data Table on North America - Market size and forecast 2025-2030 ($ thousand)
Chart on North America - Year-over-year growth 2025-2030 (%)
Data Table on North America - Year-over-year growth 2025-2030 (%)
Chart on Regional Comparison - North America
Data Table on Regional Comparison - North America

12.4.1 US - Market size and forecast 2025-2030

Chart on US - Market size and forecast 2025-2030 ($ thousand)
Data Table on US - Market size and forecast 2025-2030 ($ thousand)
Chart on US - Year-over-year growth 2025-2030 (%)
Data Table on US - Year-over-year growth 2025-2030 (%)

12.4.2 Canada - Market size and forecast 2025-2030

Chart on Canada - Market size and forecast 2025-2030 ($ thousand)
Data Table on Canada - Market size and forecast 2025-2030 ($ thousand)
Chart on Canada - Year-over-year growth 2025-2030 (%)
Data Table on Canada - Year-over-year growth 2025-2030 (%)

12.4.3 Mexico - Market size and forecast 2025-2030

Chart on Mexico - Market size and forecast 2025-2030 ($ thousand)
Data Table on Mexico - Market size and forecast 2025-2030 ($ thousand)
Chart on Mexico - Year-over-year growth 2025-2030 (%)
Data Table on Mexico - Year-over-year growth 2025-2030 (%)

12.5 Europe - Market size and forecast 2025-2030

Chart on Europe - Market size and forecast 2025-2030 ($ thousand)
Data Table on Europe - Market size and forecast 2025-2030 ($ thousand)
Chart on Europe - Year-over-year growth 2025-2030 (%)
Data Table on Europe - Year-over-year growth 2025-2030 (%)
Chart on Regional Comparison - Europe
Data Table on Regional Comparison - Europe

12.5.1 Germany - Market size and forecast 2025-2030

Chart on Germany - Market size and forecast 2025-2030 ($ thousand)
Data Table on Germany - Market size and forecast 2025-2030 ($ thousand)
Chart on Germany - Year-over-year growth 2025-2030 (%)
Data Table on Germany - Year-over-year growth 2025-2030 (%)

12.5.2 Italy - Market size and forecast 2025-2030

Chart on Italy - Market size and forecast 2025-2030 ($ thousand)
Data Table on Italy - Market size and forecast 2025-2030 ($ thousand)
Chart on Italy - Year-over-year growth 2025-2030 (%)
Data Table on Italy - Year-over-year growth 2025-2030 (%)

12.5.3 UK - Market size and forecast 2025-2030

Chart on UK - Market size and forecast 2025-2030 ($ thousand)
Data Table on UK - Market size and forecast 2025-2030 ($ thousand)
Chart on UK - Year-over-year growth 2025-2030 (%)
Data Table on UK - Year-over-year growth 2025-2030 (%)

12.5.4 France - Market size and forecast 2025-2030

Chart on France - Market size and forecast 2025-2030 ($ thousand)
Data Table on France - Market size and forecast 2025-2030 ($ thousand)
Chart on France - Year-over-year growth 2025-2030 (%)
Data Table on France - Year-over-year growth 2025-2030 (%)

12.5.5 Spain - Market size and forecast 2025-2030

Chart on Spain - Market size and forecast 2025-2030 ($ thousand)
Data Table on Spain - Market size and forecast 2025-2030 ($ thousand)
Chart on Spain - Year-over-year growth 2025-2030 (%)
Data Table on Spain - Year-over-year growth 2025-2030 (%)

12.5.6 Russia - Market size and forecast 2025-2030

Chart on Russia - Market size and forecast 2025-2030 ($ thousand)
Data Table on Russia - Market size and forecast 2025-2030 ($ thousand)
Chart on Russia - Year-over-year growth 2025-2030 (%)
Data Table on Russia - Year-over-year growth 2025-2030 (%)

12.5.7 The Netherlands - Market size and forecast 2025-2030

Chart on The Netherlands - Market size and forecast 2025-2030 ($ thousand)
Data Table on The Netherlands - Market size and forecast 2025-2030 ($ thousand)
Chart on The Netherlands - Year-over-year growth 2025-2030 (%)
Data Table on The Netherlands - Year-over-year growth 2025-2030 (%)

12.6 Rest of World (ROW) - Market size and forecast 2025-2030

Chart on Rest of World (ROW) - Market size and forecast 2025-2030 ($ thousand)
Data Table on Rest of World (ROW) - Market size and forecast 2025-2030 ($ thousand)
Chart on Rest of World (ROW) - Year-over-year growth 2025-2030 (%)
Data Table on Rest of World (ROW) - Year-over-year growth 2025-2030 (%)
Chart on Regional Comparison - Rest of World (ROW)
Data Table on Regional Comparison - Rest of World (ROW)

12.6.1 Brazil - Market size and forecast 2025-2030

Chart on Brazil - Market size and forecast 2025-2030 ($ thousand)
Data Table on Brazil - Market size and forecast 2025-2030 ($ thousand)
Chart on Brazil - Year-over-year growth 2025-2030 (%)
Data Table on Brazil - Year-over-year growth 2025-2030 (%)

12.6.2 South Africa - Market size and forecast 2025-2030

Chart on South Africa - Market size and forecast 2025-2030 ($ thousand)
Data Table on South Africa - Market size and forecast 2025-2030 ($ thousand)
Chart on South Africa - Year-over-year growth 2025-2030 (%)
Data Table on South Africa - Year-over-year growth 2025-2030 (%)

12.6.3 Australia - Market size and forecast 2025-2030

Chart on Australia - Market size and forecast 2025-2030 ($ thousand)
Data Table on Australia - Market size and forecast 2025-2030 ($ thousand)
Chart on Australia - Year-over-year growth 2025-2030 (%)
Data Table on Australia - Year-over-year growth 2025-2030 (%)

12.6.4 Saudi Arabia - Market size and forecast 2025-2030

Chart on Saudi Arabia - Market size and forecast 2025-2030 ($ thousand)
Data Table on Saudi Arabia - Market size and forecast 2025-2030 ($ thousand)
Chart on Saudi Arabia - Year-over-year growth 2025-2030 (%)
Data Table on Saudi Arabia - Year-over-year growth 2025-2030 (%)

12.6.5 UAE - Market size and forecast 2025-2030

Chart on UAE - Market size and forecast 2025-2030 ($ thousand)
Data Table on UAE - Market size and forecast 2025-2030 ($ thousand)
Chart on UAE - Year-over-year growth 2025-2030 (%)
Data Table on UAE - Year-over-year growth 2025-2030 (%)

12.6.6 Turkey - Market size and forecast 2025-2030

Chart on Turkey - Market size and forecast 2025-2030 ($ thousand)
Data Table on Turkey - Market size and forecast 2025-2030 ($ thousand)
Chart on Turkey - Year-over-year growth 2025-2030 (%)
Data Table on Turkey - Year-over-year growth 2025-2030 (%)

12.7 Market opportunity by geography

Market opportunity by geography ($ thousand)
Data Tables on Market opportunity by geography ($ thousand)

13. Drivers, Challenges, and Opportunity

13.1 Market drivers

Rising cholesterol levels and cardiovascular health awareness.
Growing demand for natural, clean-label nutraceuticals.
Advancing fermentation and quality standardization technologies.

13.2 Market challenges

Regulatory restrictions and active substance classification ambiguities
Safety vulnerabilities, secondary mycotoxins, and consumer trust fragility
Competition from alternatives and low-cost drugs

13.3 Impact of drivers and challenges

Impact of drivers and challenges in 2025 and 2030

13.4 Market opportunities

Strategic co-formulation and synergistic combination products
Strengthening regulatory compliance and global toxicological safety governance
Commercial expansion into natural pigment and functional food applications

14. Competitive Landscape

14.1 Overview

14.2

Overview on criticality of inputs and factors of differentiation

14.3 Landscape disruption

Overview on factors of disruption

14.4 Industry risks

Impact of key risks on business

15. Competitive Analysis

15.1 Companies profiled

Companies covered

15.2 Company ranking index

15.3 Market positioning of companies

Matrix on companies position and classification

15.4 Bioway Organic Ingredients Co.

Bioway Organic Ingredients Co. - Overview
Bioway Organic Ingredients Co. - Product / Service
Bioway Organic Ingredients Co. - Key offerings
SWOT

15.5 Botanic Healthcare Group

Botanic Healthcare Group - Overview
Botanic Healthcare Group - Product / Service
Botanic Healthcare Group - Key offerings
SWOT

15.6 Chemcopia Ingredients Pvt. Ltd.

Chemcopia Ingredients Pvt. Ltd. - Overview
Chemcopia Ingredients Pvt. Ltd. - Product / Service
Chemcopia Ingredients Pvt. Ltd. - Key offerings
SWOT

15.7 Chen Lang Bio Tech Co. Ltd

Chen Lang Bio Tech Co. Ltd - Overview
Chen Lang Bio Tech Co. Ltd - Product / Service
Chen Lang Bio Tech Co. Ltd - Key offerings
SWOT

15.8 Huisong Pharmaceuticals

Huisong Pharmaceuticals - Overview
Huisong Pharmaceuticals - Product / Service
Huisong Pharmaceuticals - Key offerings
SWOT

15.9 Kshipra Biotech Pvt Ltd

Kshipra Biotech Pvt Ltd - Overview
Kshipra Biotech Pvt Ltd - Product / Service
Kshipra Biotech Pvt Ltd - Key offerings
SWOT

15.10 Natures Bounty

Natures Bounty - Overview
Natures Bounty - Product / Service
Natures Bounty - Key offerings
SWOT

15.11 NOW Health Group Inc.

NOW Health Group Inc. - Overview
NOW Health Group Inc. - Product / Service
NOW Health Group Inc. - Key offerings
SWOT

15.12 Nutragreenlife Biotechnology Co. Ltd.

Nutragreenlife Biotechnology Co. Ltd. - Overview
Nutragreenlife Biotechnology Co. Ltd. - Product / Service
Nutragreenlife Biotechnology Co. Ltd. - Key offerings
SWOT

15.13 Shaanxi Guanjie Biotech Co.Ltd

Shaanxi Guanjie Biotech Co.Ltd - Overview
Shaanxi Guanjie Biotech Co.Ltd - Product / Service
Shaanxi Guanjie Biotech Co.Ltd - Key offerings
SWOT

15.14 SunWay Biotech

SunWay Biotech - Overview
SunWay Biotech - Product / Service
SunWay Biotech - Key offerings
SWOT

15.15 Sylvan Bio

Sylvan Bio - Overview
Sylvan Bio - Product / Service
Sylvan Bio - Key offerings
SWOT

15.16 Xian Miracle Biotechnology Co. Ltd

Xian Miracle Biotechnology Co. Ltd - Overview
Xian Miracle Biotechnology Co. Ltd - Product / Service
Xian Miracle Biotechnology Co. Ltd - Key offerings
SWOT

15.17 Xian Sost Biotech Co.Ltd

Xian Sost Biotech Co.Ltd - Overview
Xian Sost Biotech Co.Ltd - Product / Service
Xian Sost Biotech Co.Ltd - Key offerings
SWOT

15.18 Zhejiang Sanhe Bioengineering Co. Ltd.

Zhejiang Sanhe Bioengineering Co. Ltd. - Overview
Zhejiang Sanhe Bioengineering Co. Ltd. - Product / Service
Zhejiang Sanhe Bioengineering Co. Ltd. - Key offerings
SWOT

16. Appendix

16.1 Scope of the report

Market definition
Objectives
Notes and caveats

16.2 Inclusions and exclusions checklist

Inclusions checklist
Exclusions checklist

16.3 Currency conversion rates for US$

16.4 Research methodology

16.5 Data procurement

Information sources

16.6 Data validation

16.7 Validation techniques employed for market sizing

16.8 Data synthesis

16.9 360 degree market analysis

16.10 List of abbreviations

Research Methodology

Technavio presents a detailed picture of the market by way of study, synthesis, and summation of data from multiple sources. The analysts have presented the various facets of the market with a particular focus on identifying the key industry influencers. The data thus presented is comprehensive, reliable, and the result of extensive research, both primary and secondary.

INFORMATION SOURCES

Primary sources

  • Manufacturers and suppliers
  • Channel partners
  • Industry experts
  • Strategic decision makers

Secondary sources

  • Industry journals and periodicals
  • Government data
  • Financial reports of key industry players
  • Historical data
  • Press releases

DATA ANALYSIS

Data Synthesis

  • Collation of data
  • Estimation of key figures
  • Analysis of derived insights

Data Validation

  • Triangulation with data models
  • Reference against proprietary databases
  • Corroboration with industry experts

REPORT WRITING

Qualitative

  • Market drivers
  • Market challenges
  • Market trends
  • Five forces analysis

Quantitative

  • Market size and forecast
  • Market segmentation
  • Geographical insights
  • Competitive landscape

Interested in this report?

Get your sample now to see our research methodology and insights!

Download Now

Frequently Asked Questions

Red Yeast Rice market growth will increase by USD 194271.1 thousand thousand during 2026-2030.

The Red Yeast Rice market is expected to grow at a CAGR of 6% during 2026-2030.

Red Yeast Rice market is segmented by Product type (Capsules, Powder, Tablets, Liquid, Granules) Application (Dietary supplements, Food and beverages, Pharmaceuticals, Cosmetics and personal care, Others) Distribution channel (Offline, Online)

Arkopharma Laboratories, Bioway Organic Ingredients Co., Botanic Healthcare Group, Chemcopia Ingredients Pvt. Ltd., Chen Lang Bio Tech Co. Ltd, Huisong Pharmaceuticals, Jarrow Formulas Inc., Kshipra Biotech Pvt Ltd, Natures Bounty, NOW Health Group Inc., Nutragreenlife Biotechnology Co. Ltd., Plamed Green Science Group, Shaanxi Guanjie Biotech Co.Ltd, Solgar Inc., SunWay Biotech, Sylvan Bio, Thorne HealthTech Inc., Xian Miracle Biotechnology Co. Ltd, Xian Sost Biotech Co.Ltd, Zhejiang Sanhe Bioengineering Co. Ltd. are a few of the key vendors in the Red Yeast Rice market.

Asia will register the highest growth rate of 49.1% among the other regions. Therefore, the Red Yeast Rice market in Asia is expected to garner significant business opportunities for the vendors during the forecast period.

China, Japan, India, South Korea, Indonesia, Thailand, Singapore, US, Canada, Mexico, Germany, Italy, UK, France, Spain, Russia, The Netherlands, Brazil, South Africa, Australia, Saudi Arabia, UAE, Turkey

  • Rising cholesterol levels and cardiovascular health awareness. is the driving factor this market.

The Red Yeast Rice market vendors should focus on grabbing business opportunities from the Product type segment as it accounted for the largest market share in the base year.
RIA - Research AI Assistant
Ask RIA