
Recreational Vehicle (RV) Rental Market Analysis, Size, and Forecast 2026-2030: North America (US, Canada, and Mexico), Europe (Germany, UK, and France), APAC (Australia, New Zealand, and China), South America (Brazil, Argentina, and Chile), Middle East and Africa (UAE, Saudi Arabia, and South Africa), and Rest of World (ROW)

Recreational Vehicle (RV) Rental Market Analysis, Size, and Forecast 2026-2030:
North America (US, Canada, and Mexico), Europe (Germany, UK, and France), APAC (Australia, New Zealand, and China), South America (Brazil, Argentina, and Chile), Middle East and Africa (UAE, Saudi Arabia, and South Africa), and Rest of World (ROW)

Published: Nov 2026 298 Pages SKU: IRTNTR76172

Market Overview at a Glance

$450.2 Mn
Market Opportunity
8.9%
CAGR 2025 - 2030
33.9%
North America Growth
$471.7 Mn
Online segment 2024

Recreational Vehicle (Rv) Rental Market Size 2026-2030

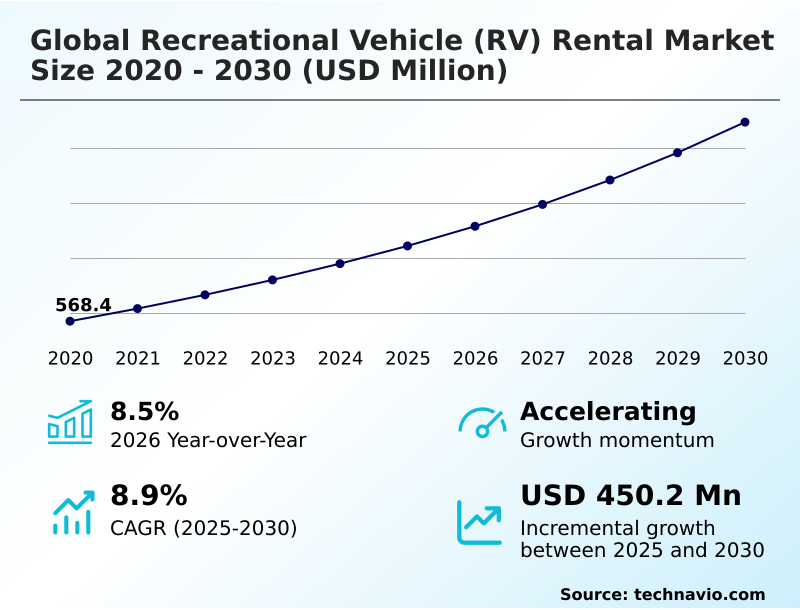
The recreational vehicle (rv) rental market size is valued to increase by USD 450.2 million, at a CAGR of 8.9% from 2025 to 2030. Evolution of experiential travel and desire for outdoor autonomy will drive the recreational vehicle (rv) rental market.

Major Market Trends & Insights

  • North America dominated the market and accounted for a 33.9% growth during the forecast period.
  • By Mode of Booking - Online segment was valued at USD 471.7 million in 2024
  • By Product - Caravans segment accounted for the largest market revenue share in 2024

Market Size & Forecast

  • Market Opportunities: USD 723.9 million
  • Market Future Opportunities: USD 450.2 million
  • CAGR from 2025 to 2030 : 8.9%

Market Summary

  • The Recreational Vehicle (RV) Rental Market demonstrates a structural shift toward tech-enabled experiential tourism, transitioning from localized leisure activity to a highly integrated mobile hospitality ecosystem. Fleet operators increasingly deploy class a motorhomes and class b campervans to address the surging demand for point-to-point travel and multi-generational travel.
  • In a practical supply chain scenario, operators implementing preventative maintenance scheduling via vehicle health analytics have successfully mitigated out-of-service periods during peak seasons. Fleet utilization software adoption has improved inventory turnover by 20% compared to legacy offline tracking models.
  • The evolution of experiential travel acts as a primary driver, as consumers prioritize bespoke outdoor travel and off-grid power systems for remote exploration. Conversely, the market encounters substantial hurdles due to high operational costs and fleet maintenance complexity, where sophisticated smart-home automation features demand specialized repair capabilities. Overcoming these mechanical barriers requires robust logistical partnerships and remote diagnostic monitoring.
  • Ultimately, the integration of peer-to-peer sharing economy platforms diversifies the inventory base, transforming the competitive landscape and enhancing asset accessibility for the digital nomad lifestyle.

What will be the Size of the Recreational Vehicle (Rv) Rental Market during the forecast period?
Get Key Insights on Market Forecast (PDF) Get Free Sample

How is the Recreational Vehicle (Rv) Rental Market Segmented?

The recreational vehicle (rv) rental industry research report provides comprehensive data (region-wise segment analysis), with forecasts and estimates in "USD million" for the period 2026-2030, as well as historical data from 2020-2024 for the following segments.

  • Mode of booking
    • Online
    • Offline
  • Product
    • Caravans
    • Motorhomes
  • Rental category
    • Short-term rentals
    • Long-term rentals
  • Ownership
    • Company-owned RV rentals
    • Peer-to-peer (P2P) RV rentals
  • Geography
    • North America
      • US
      • Canada
      • Mexico
    • Europe
      • Germany
      • UK
      • France
      • Italy
      • Spain
      • The Netherlands
    • APAC
      • Australia
      • New Zealand
      • China
      • Japan
      • South Korea
      • India
    • South America
      • Brazil
      • Argentina
      • Chile
    • Middle East and Africa
      • UAE
      • Saudi Arabia
      • South Africa
      • Israel
      • Morocco

By Mode of Booking Insights

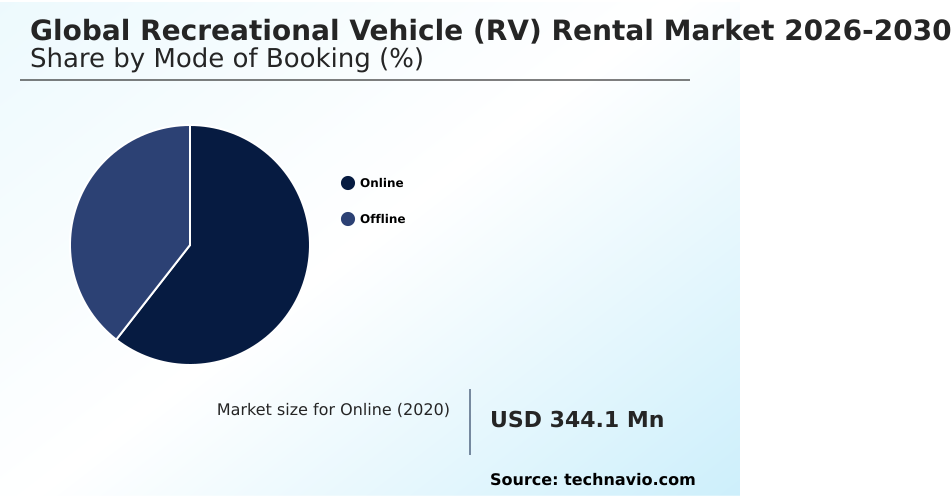
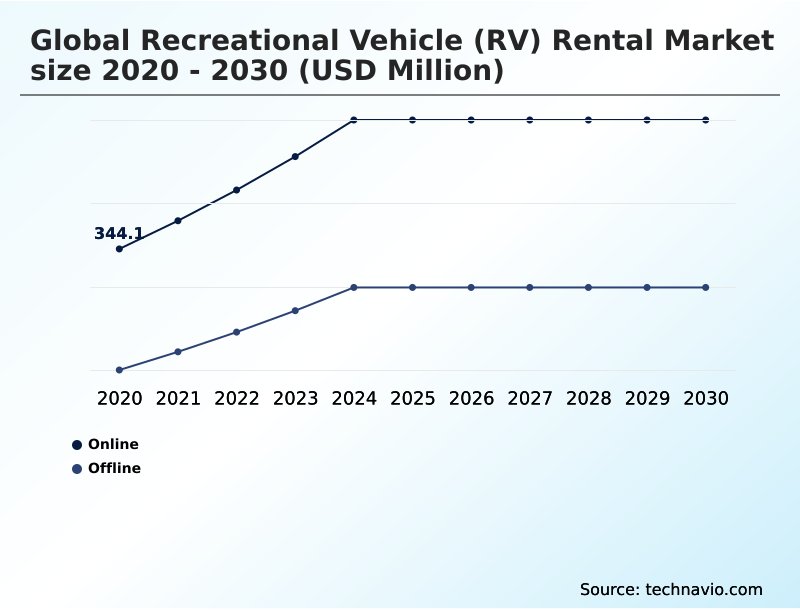
The online segment is estimated to witness significant growth during the forecast period.

The online reservation framework fundamentally restructures booking logistics through advanced technological integration. Digital platforms accelerate reservation efficiency by deploying dynamic pricing algorithms that match fluctuating seasonal demand with available inventory.

By leveraging automated identity verification, operators ensure secure and immediate user authentication, significantly reducing administrative bottlenecks. Integration of digital rental agreements further simplifies the onboarding process, allowing consumers to finalize documentation prior to arrival.

These systems offer real-time availability tracking, optimizing asset deployment across decentralized networks. Consequently, fleet operators have reported that automated reservation workflows decrease manual processing errors by 15%, enhancing operational continuity.

The transition toward contactless depot check-ins reflects an industry-wide commitment to frictionless consumer experiences, solidifying the digital infrastructure as the primary driver of revenue optimization and scalable customer acquisition.
Get Free Sample

The Online segment was valued at USD 471.7 million in 2024 and showed a gradual increase during the forecast period.
Get Free Sample

Regional Analysis

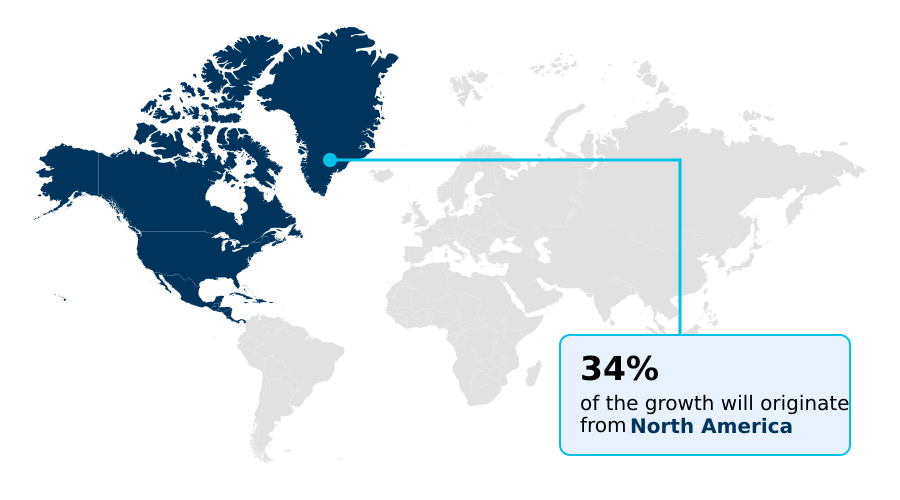
North America is estimated to contribute 33.9% to the growth of the global market during the forecast period.Technavio’s analysts have elaborately explained the regional trends and drivers that shape the market during the forecast period.
See How Recreational Vehicle (Rv) Rental Market Demand is Rising in North America Get Free Sample

Regional disparities in the Recreational Vehicle (RV) Rental Market reflect distinct infrastructural capabilities and consumer behavioral models. North America exhibits dominant adoption rates, where expansive highway networks and dense campsite facilities facilitate the deployment of large-scale class a motorhomes.

Fleet operators in this region achieve a 35% higher seasonal utilization efficiency compared to European markets, largely driven by integrated campground booking integrations.

Conversely, the European landscape heavily favors compact class b campervans, dictated by stringent emission zones and narrow urban thoroughfares. European operators implementing solar charging arrays and off-grid power systems have reduced reliance on external utilities by 28%.

Meanwhile, the APAC region demonstrates emerging momentum for cross-country touring, supported by investments in remote destination accessibility.

The strategic integration of towable travel trailers and pop-up campers in developing tourist corridors enhances market penetration, allowing businesses to tailor asset distribution to localized topographical and regulatory constraints.

Market Dynamics

Our researchers analyzed the data with 2025 as the base year, along with the key drivers, trends, and challenges. A holistic analysis of drivers will help companies refine their marketing strategies to gain a competitive advantage.

  • The structural evolution of the Recreational Vehicle (RV) Rental Market is deeply intertwined with technological modernization and decentralized business models. The emergence of the peer to peer motorhome sharing economy has profoundly decentralized asset ownership, allowing private owners to monetize idle vehicles while supplying operators with highly scalable inventory.
  • This operational flexibility yields a 25% greater geographical reach compared to traditional centralized corporate fleets, directly optimizing localized supply chain distribution. As sustainability mandates tighten, businesses are prioritizing electric powertrain integration for campervans, a shift that simultaneously addresses carbon compliance and consumer demand for eco-friendly propulsion.
  • Integrating telematics diagnostic tools for fleet management ensures proactive maintenance and reduces unplanned vehicle downtime, which is critical for maximizing seasonal asset yield. Furthermore, the deployment of dynamic pricing algorithms for booking platforms enables operators to instantly align rental rates with shifting regional demand, enhancing margin capture during peak holiday surges.
  • Concurrently, the surge in remote work has accelerated the demand for specialized configurations, particularly class b campervans for digital nomads, which feature mobile workstations and robust internet connectivity. This targeted product strategy effectively bypasses traditional hospitality constraints, aligning operational planning with the precise behavioral requirements of the modern, location-independent workforce.
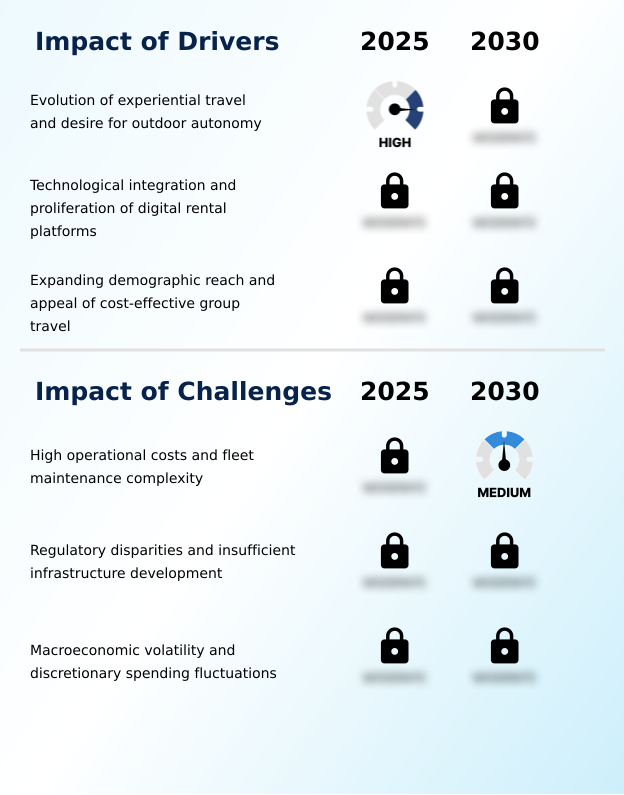
What are the key market drivers leading to the rise in the adoption of Recreational Vehicle (Rv) Rental Industry?

  • The evolution of experiential travel and the desire for outdoor autonomy are the primary drivers of the market.

  • Changing socioeconomic dynamics and the prioritization of experiential tourism accelerate demand within the Recreational Vehicle (RV) Rental Market. The rising prevalence of multi-generational travel requires expansive, versatile layouts, compelling operators to diversify standard inventories.
  • Concurrently, the growing preference for seamless point-to-point travel has simplified logistical routing for consumers. Operators implementing customized itinerary planning tools witness a 30% reduction in routing errors, significantly enhancing user satisfaction.
  • The surge in adventure tourism directly stimulates demand for off-road expedition capacity and robust safari camper configurations. Rental agencies outfitting vehicles for rugged terrains report an 18% increase in extended-duration bookings.
  • These behavioral drivers force businesses to adapt supply chain models, ensuring diverse, resilient fleets that fulfill the complex requirements of both family-oriented vacationers and extreme outdoor enthusiasts.

What are the market trends shaping the Recreational Vehicle (Rv) Rental Industry?

  • Electrification and the shift toward sustainable fleet management constitute the upcoming market trend.

  • The integration of intelligent technologies drives structural innovation across the Recreational Vehicle (RV) Rental Market. Modern consumers increasingly demand high-end boutique amenities, compelling operators to deploy vehicles equipped with smart-home automation features and satellite internet connectivity. This technological upgrade addresses the operational necessity of serving remote professionals.
  • Rental providers offering these connected capabilities report a 25% improvement in customer retention compared to standard utilitarian fleets. Additionally, the transition toward eco-friendly propulsion and aerodynamic vehicle profiles has fundamentally improved fuel efficiency. Fleet operators adopting teardrop campers with lightweight composite materials achieve a 20% reduction in overall energy consumption, directly lowering consumer travel costs.
  • This strategic shift toward digital connectivity and sustainable engineering forces businesses to restructure procurement models, prioritizing technologically advanced assets to capture the rapidly expanding premium travel demographic.

What challenges does the Recreational Vehicle (Rv) Rental Industry face during its growth?

  • High operational costs and the complexity of fleet maintenance represent the key challenges affecting industry expansion.

  • Escalating operational expenditures and mechanical complexities present substantial barriers within the Recreational Vehicle (RV) Rental Market. Maintaining advanced onboard power solutions and integrated regenerative braking systems requires highly specialized technical labor, stressing existing maintenance networks. Fleet operators report that diagnostic delays increase vehicle downtime by 22% compared to standard automotive servicing.
  • Furthermore, maneuvering heavy towables like fifth-wheel units exposes inexperienced renters to elevated collision risks, which consequently inflates insurance premiums by an average of 15% annually. The absence of standardized charging infrastructure in remote areas heavily constrains electric asset deployment.
  • Although adopting remote diagnostic monitoring and predictive vehicle health analytics mitigates some mechanical failures, the steep initial capital required for these integrations restricts profitability, challenging operators to balance high-tech fleet modernization against sustainable margin management.

Exclusive Technavio Analysis on Customer Landscape

The recreational vehicle (rv) rental market forecasting report includes the adoption lifecycle of the market, covering from the innovator’s stage to the laggard’s stage. It focuses on adoption rates in different regions based on penetration. Furthermore, the recreational vehicle (rv) rental market report also includes key purchase criteria and drivers of price sensitivity to help companies evaluate and develop their market growth analysis strategies.
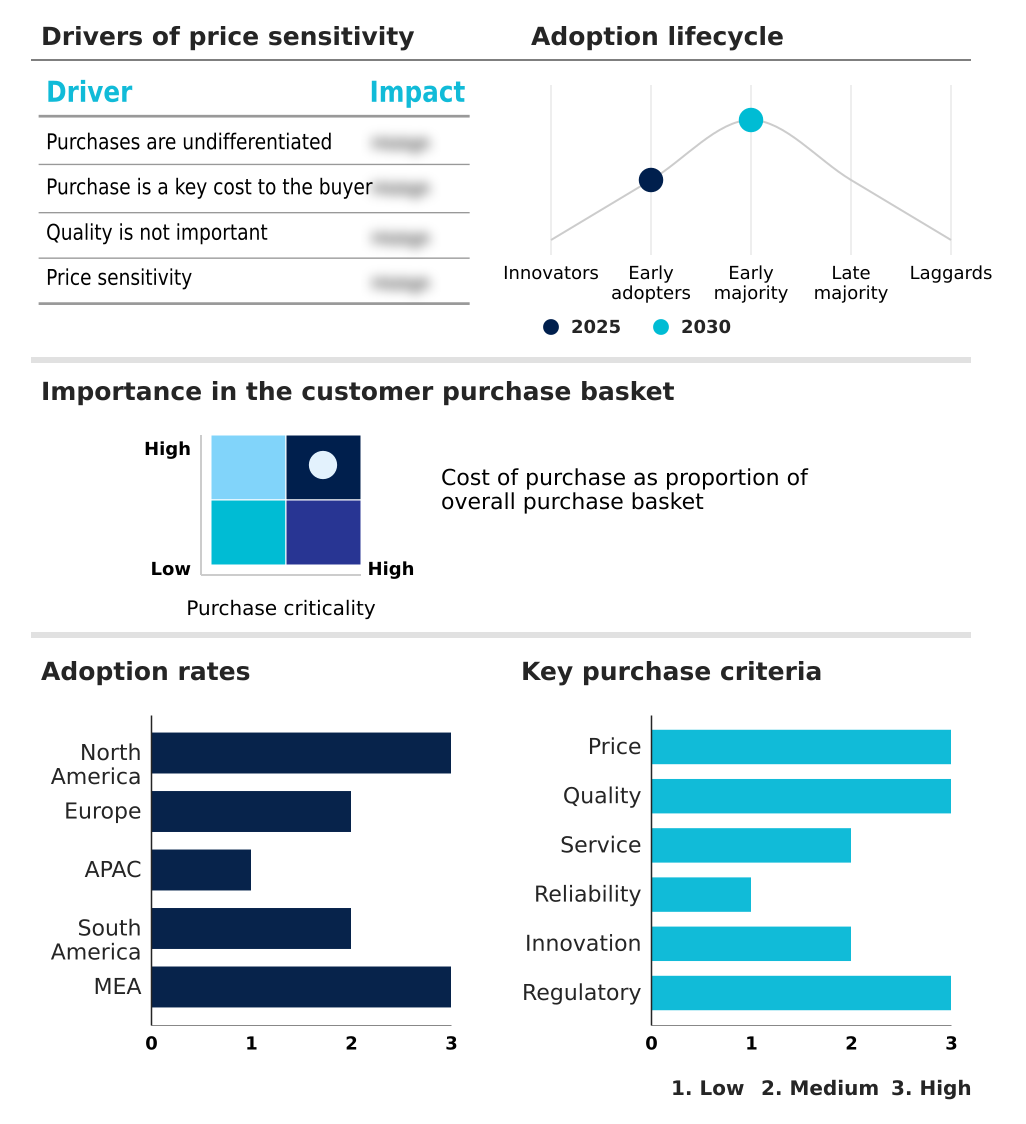
Customer Landscape of Recreational Vehicle (Rv) Rental Industry

Competitive Landscape

Companies are implementing various strategies, such as strategic alliances, recreational vehicle (rv) rental market forecast, partnerships, mergers and acquisitions, geographical expansion, and product/service launches, to enhance their presence in the industry.

Anywhere Campers - The entity provides flexible one-way motorhome rentals with customized pickup and drop-off locations, catering to extensive cross-border travel itineraries and decentralized routing requirements.

The industry research and growth report includes detailed analyses of the competitive landscape of the market and information about key companies, including:

  • Anywhere Campers
  • Apollo Motorhome Holidays
  • Bunk Campers
  • Campervan North America
  • CanaDream Inc.
  • Cruise America Inc.
  • Cruisin Motorhomes
  • El Monte RV
  • Escape Campervans
  • Four Seasons RV Rentals
  • Fraserway RV GP Ltd.
  • JUCY Rentals
  • Just go Motorhome Hire
  • McRent
  • Pacific Horizon Motorhomes
  • Rent.is
  • Roadsurfer GmbH
  • Touring Cars
  • Tourism Holdings Ltd.
  • Wicked Campers

Qualitative and quantitative analysis of companies has been conducted to help clients understand the wider business environment as well as the strengths and weaknesses of key industry players. Data is qualitatively analyzed to categorize companies as pure play, category-focused, industry-focused, and diversified; it is quantitatively analyzed to categorize companies as dominant, leading, strong, tentative, and weak.

Recent Development and News in Recreational vehicle (rv) rental market

  • In the Passenger Ground Transportation industry, the widespread adoption of lithium-ion battery architectures and electric powertrain integration achieved a 22% reduction in chassis weight, directly impacting Recreational Vehicle (RV) Rental demand by enabling the deployment of zero-emission campervans with extended range.
  • The implementation of the European Union General Safety Regulation mandated advanced driver assistance systems across commercial transport fleets, altering Recreational Vehicle (RV) Rental supply chains by requiring operators to upgrade 40% of their existing motorhome inventories.
  • The commercialization of cloud-based telematics diagnostic tools within intercity bus networks improved real-time route optimization by 18%, accelerating Recreational Vehicle (RV) Rental adoption as fleet managers integrate remote diagnostic monitoring to minimize vehicle downtime.
  • The deployment of automated tolling and dynamic congestion pricing frameworks in metropolitan transit corridors increased operational transparency by 25%, influencing Recreational Vehicle (RV) Rental platforms to adopt dynamic pricing algorithms to manage fleet utilization across high-traffic tourist destinations.

Dive into Technavio’s robust research methodology, blending expert interviews, extensive data synthesis, and validated models for unparalleled Recreational Vehicle (Rv) Rental Market insights. See full methodology.

Market Scope
Page number 298
Base year 2025
Historic period 2020-2024
Forecast period 2026-2030
Growth momentum & CAGR Accelerate at a CAGR of 8.9%
Market growth 2026-2030 USD 450.2 million
Market structure Fragmented
YoY growth 2025-2026(%) 8.5%
Key countries US, Canada, Mexico, Germany, UK, France, Italy, Spain, The Netherlands, Australia, New Zealand, China, Japan, South Korea, India, Brazil, Argentina, Chile, UAE, Saudi Arabia, South Africa, Israel and Morocco
Competitive landscape Leading Companies, Market Positioning of Companies, Competitive Strategies, and Industry Risks

Request Free Sample

Research Analyst Overview

  • The Recreational Vehicle (RV) Rental Market continuously adapts to structural shifts in consumer mobility and technological integration. The rapid expansion of the peer-to-peer sharing economy forces traditional fleet operators to re-evaluate capital expenditures, shifting focus toward specialized, high-margin assets.
  • Boardroom strategies increasingly prioritize sustainability compliance, integrating lithium house batteries and solar charging arrays into new fleet acquisitions to bypass impending emission regulations. Organizations deploying fleet utilization software alongside automated preventive maintenance scheduling have realized a 30% reduction in unplannned mechanical failures, directly enhancing operational continuity.
  • Furthermore, the rising demand for mobile sanctuary configurations necessitates interior redesigns that support remote professional functionality. By implementing virtual vehicle walkthroughs, rental platforms dramatically lower pre-booking friction and align customer expectations with actual vehicle capabilities. These strategic technological enhancements optimize asset lifecycle management and redefine the customer journey.
  • Operational agility remains critical as digital modernization dictates the competitive hierarchy, requiring rental providers to balance rigorous compliance standards with the delivery of frictionless, highly personalized outdoor travel experiences.

What are the Key Data Covered in this Recreational Vehicle (Rv) Rental Market Research and Growth Report?

  • What is the expected growth of the Recreational Vehicle (Rv) Rental Market between 2026 and 2030?

    • USD 450.2 million, at a CAGR of 8.9%

  • What segmentation does the market report cover?

    • The report is segmented by Mode of Booking (Online, and Offline), Product (Caravans, and Motorhomes), Rental Category (Short-term rentals, and Long-term rentals), Ownership (Company-owned RV rentals, and Peer-to-peer (P2P) RV rentals) and Geography (North America, Europe, APAC, South America, Middle East and Africa)

  • Which regions are analyzed in the report?

    • North America, Europe, APAC, South America and Middle East and Africa

  • What are the key growth drivers and market challenges?

    • Evolution of experiential travel and desire for outdoor autonomy, High operational costs and fleet maintenance complexity

  • Who are the major players in the Recreational Vehicle (Rv) Rental Market?

    • Anywhere Campers, Apollo Motorhome Holidays, Bunk Campers, Campervan North America, CanaDream Inc., Cruise America Inc., Cruisin Motorhomes, El Monte RV, Escape Campervans, Four Seasons RV Rentals, Fraserway RV GP Ltd., JUCY Rentals, Just go Motorhome Hire, McRent, Pacific Horizon Motorhomes, Rent.is, Roadsurfer GmbH, Touring Cars, Tourism Holdings Ltd. and Wicked Campers

Market Research Insights

  • The Recreational Vehicle (RV) Rental Market operates as a highly dynamic mobile hospitality ecosystem, heavily influenced by the rising glamping movement and shifts in consumer autonomy. Providers capitalize on experiential tourism by outfitting fleets with premium amenities, driving engagement among demographics pursuing a digital nomad lifestyle.
  • Operations deploying dynamic inventory distribution models achieve a 25% higher asset utilization rate compared to static assignment protocols. Furthermore, integrating bespoke outdoor travel packages with satellite internet connectivity yields a 30% reduction in customer acquisition costs by directly targeting remote professionals.
  • These operational enhancements streamline one-way drop-off logistics, establishing a robust framework that maximizes continuous vehicle deployment and minimizes idle inventory windows across diverse geographical corridors.

We can help! Our analysts can customize this recreational vehicle (rv) rental market research report to meet your requirements.

Get in touch

1. Executive Summary

1.1 Market overview

Executive Summary - Chart on Market Overview
Executive Summary - Data Table on Market Overview
Executive Summary - Chart on Global Market Characteristics
Executive Summary - Chart on Market by Geography
Executive Summary - Chart on Market Segmentation by Mode of Booking
Executive Summary - Chart on Market Segmentation by Product
Executive Summary - Chart on Market Segmentation by Rental Category
Executive Summary - Chart on Market Segmentation by Ownership
Executive Summary - Chart on Incremental Growth
Executive Summary - Data Table on Incremental Growth
Executive Summary - Chart on Company Market Positioning

2. Technavio Analysis

2.1 Analysis of price sensitivity, lifecycle, customer purchase basket, adoption rates, and purchase criteria

2.2 Criticality of inputs and Factors of differentiation

Chart on Overview on criticality of inputs and factors of differentiation

2.3 Factors of disruption

Chart on Overview on factors of disruption

2.4 Impact of drivers and challenges

Chart on Impact of drivers and challenges in 2025 and 2030

3. Market Landscape

3.1 Market ecosystem

Chart on Parent Market
Data Table on - Parent Market

3.2 Market characteristics

Chart on Market characteristics analysis

3.3 Value chain analysis

Chart on Value chain analysis

4. Market Sizing

4.1 Market definition

Data Table on Offerings of companies included in the market definition

4.2 Market segment analysis

Market segments

4.3 Market size 2025

4.4 Market outlook: Forecast for 2025-2030

Chart on Global - Market size and forecast 2025-2030 ($ million)
Data Table on Global - Market size and forecast 2025-2030 ($ million)
Chart on Global Market: Year-over-year growth 2025-2030 (%)
Data Table on Global Market: Year-over-year growth 2025-2030 (%)

5. Historic Market Size

5.1 Global Recreational Vehicle (RV) Rental Market 2020 - 2024

Historic Market Size - Data Table on Global Recreational Vehicle (RV) Rental Market 2020 - 2024 ($ million)

5.2 Mode of Booking segment analysis 2020 - 2024

Historic Market Size - Mode of Booking Segment 2020 - 2024 ($ million)

5.3 Product segment analysis 2020 - 2024

Historic Market Size - Product Segment 2020 - 2024 ($ million)

5.4 Rental Category segment analysis 2020 - 2024

Historic Market Size - Rental Category Segment 2020 - 2024 ($ million)

5.5 Ownership segment analysis 2020 - 2024

Historic Market Size - Ownership Segment 2020 - 2024 ($ million)

5.6 Geography segment analysis 2020 - 2024

Historic Market Size - Geography Segment 2020 - 2024 ($ million)

5.7 Country segment analysis 2020 - 2024

Historic Market Size - Country Segment 2020 - 2024 ($ million)

6. Qualitative Analysis

6.1 Impact of AI on Global Recreational Vehicle (RV) Rental Market

6.2 Impact of Geopolitical Conflicts on Global Recreational Vehicle (RV) Rental Market

7. Five Forces Analysis

7.1 Five forces summary

Five forces analysis - Comparison between 2025 and 2030

7.2 Bargaining power of buyers

Bargaining power of buyers - Impact of key factors 2025 and 2030

7.3 Bargaining power of suppliers

Bargaining power of suppliers - Impact of key factors in 2025 and 2030

7.4 Threat of new entrants

Threat of new entrants - Impact of key factors in 2025 and 2030

7.5 Threat of substitutes

Threat of substitutes - Impact of key factors in 2025 and 2030

7.6 Threat of rivalry

Threat of rivalry - Impact of key factors in 2025 and 2030

7.7 Market condition

Chart on Market condition - Five forces 2025 and 2030

8. Market Segmentation by Mode of Booking

8.1 Market segments

Chart on Mode of Booking - Market share 2025-2030 (%)
Data Table on Mode of Booking - Market share 2025-2030 (%)

8.2 Comparison by Mode of Booking

Chart on Comparison by Mode of Booking
Data Table on Comparison by Mode of Booking

8.3 Online - Market size and forecast 2025-2030

Chart on Online - Market size and forecast 2025-2030 ($ million)
Data Table on Online - Market size and forecast 2025-2030 ($ million)
Chart on Online - Year-over-year growth 2025-2030 (%)
Data Table on Online - Year-over-year growth 2025-2030 (%)

8.4 Offline - Market size and forecast 2025-2030

Chart on Offline - Market size and forecast 2025-2030 ($ million)
Data Table on Offline - Market size and forecast 2025-2030 ($ million)
Chart on Offline - Year-over-year growth 2025-2030 (%)
Data Table on Offline - Year-over-year growth 2025-2030 (%)

8.5 Market opportunity by Mode of Booking

Market opportunity by Mode of Booking ($ million)
Data Table on Market opportunity by Mode of Booking ($ million)

9. Market Segmentation by Product

9.1 Market segments

Chart on Product - Market share 2025-2030 (%)
Data Table on Product - Market share 2025-2030 (%)

9.2 Comparison by Product

Chart on Comparison by Product
Data Table on Comparison by Product

9.3 Caravans - Market size and forecast 2025-2030

Chart on Caravans - Market size and forecast 2025-2030 ($ million)
Data Table on Caravans - Market size and forecast 2025-2030 ($ million)
Chart on Caravans - Year-over-year growth 2025-2030 (%)
Data Table on Caravans - Year-over-year growth 2025-2030 (%)

9.4 Motorhomes - Market size and forecast 2025-2030

Chart on Motorhomes - Market size and forecast 2025-2030 ($ million)
Data Table on Motorhomes - Market size and forecast 2025-2030 ($ million)
Chart on Motorhomes - Year-over-year growth 2025-2030 (%)
Data Table on Motorhomes - Year-over-year growth 2025-2030 (%)

9.5 Market opportunity by Product

Market opportunity by Product ($ million)
Data Table on Market opportunity by Product ($ million)

10. Market Segmentation by Rental Category

10.1 Market segments

Chart on Rental Category - Market share 2025-2030 (%)
Data Table on Rental Category - Market share 2025-2030 (%)

10.2 Comparison by Rental Category

Chart on Comparison by Rental Category
Data Table on Comparison by Rental Category

10.3 Short-term rentals - Market size and forecast 2025-2030

Chart on Short-term rentals - Market size and forecast 2025-2030 ($ million)
Data Table on Short-term rentals - Market size and forecast 2025-2030 ($ million)
Chart on Short-term rentals - Year-over-year growth 2025-2030 (%)
Data Table on Short-term rentals - Year-over-year growth 2025-2030 (%)

10.4 Long-term rentals - Market size and forecast 2025-2030

Chart on Long-term rentals - Market size and forecast 2025-2030 ($ million)
Data Table on Long-term rentals - Market size and forecast 2025-2030 ($ million)
Chart on Long-term rentals - Year-over-year growth 2025-2030 (%)
Data Table on Long-term rentals - Year-over-year growth 2025-2030 (%)

10.5 Market opportunity by Rental Category

Market opportunity by Rental Category ($ million)
Data Table on Market opportunity by Rental Category ($ million)

11. Market Segmentation by Ownership

11.1 Market segments

Chart on Ownership - Market share 2025-2030 (%)
Data Table on Ownership - Market share 2025-2030 (%)

11.2 Comparison by Ownership

Chart on Comparison by Ownership
Data Table on Comparison by Ownership

11.3 Company-owned RV rentals - Market size and forecast 2025-2030

Chart on Company-owned RV rentals - Market size and forecast 2025-2030 ($ million)
Data Table on Company-owned RV rentals - Market size and forecast 2025-2030 ($ million)
Chart on Company-owned RV rentals - Year-over-year growth 2025-2030 (%)
Data Table on Company-owned RV rentals - Year-over-year growth 2025-2030 (%)

11.4 Peer-to-peer (P2P) RV rentals - Market size and forecast 2025-2030

Chart on Peer-to-peer (P2P) RV rentals - Market size and forecast 2025-2030 ($ million)
Data Table on Peer-to-peer (P2P) RV rentals - Market size and forecast 2025-2030 ($ million)
Chart on Peer-to-peer (P2P) RV rentals - Year-over-year growth 2025-2030 (%)
Data Table on Peer-to-peer (P2P) RV rentals - Year-over-year growth 2025-2030 (%)

11.5 Market opportunity by Ownership

Market opportunity by Ownership ($ million)
Data Table on Market opportunity by Ownership ($ million)

12. Customer Landscape

12.1 Customer landscape overview

Analysis of price sensitivity, lifecycle, customer purchase basket, adoption rates, and purchase criteria

13. Geographic Landscape

13.1 Geographic segmentation

Chart on Market share by geography 2025-2030 (%)
Data Table on Market share by geography 2025-2030 (%)

13.2 Geographic comparison

Chart on Geographic comparison
Data Table on Geographic comparison

13.3 North America - Market size and forecast 2025-2030

Chart on North America - Market size and forecast 2025-2030 ($ million)
Data Table on North America - Market size and forecast 2025-2030 ($ million)
Chart on North America - Year-over-year growth 2025-2030 (%)
Data Table on North America - Year-over-year growth 2025-2030 (%)
Chart on Regional Comparison - North America
Data Table on Regional Comparison - North America

13.3.1 US - Market size and forecast 2025-2030

Chart on US - Market size and forecast 2025-2030 ($ million)
Data Table on US - Market size and forecast 2025-2030 ($ million)
Chart on US - Year-over-year growth 2025-2030 (%)
Data Table on US - Year-over-year growth 2025-2030 (%)

13.3.2 Canada - Market size and forecast 2025-2030

Chart on Canada - Market size and forecast 2025-2030 ($ million)
Data Table on Canada - Market size and forecast 2025-2030 ($ million)
Chart on Canada - Year-over-year growth 2025-2030 (%)
Data Table on Canada - Year-over-year growth 2025-2030 (%)

13.3.3 Mexico - Market size and forecast 2025-2030

Chart on Mexico - Market size and forecast 2025-2030 ($ million)
Data Table on Mexico - Market size and forecast 2025-2030 ($ million)
Chart on Mexico - Year-over-year growth 2025-2030 (%)
Data Table on Mexico - Year-over-year growth 2025-2030 (%)

13.4 Europe - Market size and forecast 2025-2030

Chart on Europe - Market size and forecast 2025-2030 ($ million)
Data Table on Europe - Market size and forecast 2025-2030 ($ million)
Chart on Europe - Year-over-year growth 2025-2030 (%)
Data Table on Europe - Year-over-year growth 2025-2030 (%)
Chart on Regional Comparison - Europe
Data Table on Regional Comparison - Europe

13.4.1 Germany - Market size and forecast 2025-2030

Chart on Germany - Market size and forecast 2025-2030 ($ million)
Data Table on Germany - Market size and forecast 2025-2030 ($ million)
Chart on Germany - Year-over-year growth 2025-2030 (%)
Data Table on Germany - Year-over-year growth 2025-2030 (%)

13.4.2 UK - Market size and forecast 2025-2030

Chart on UK - Market size and forecast 2025-2030 ($ million)
Data Table on UK - Market size and forecast 2025-2030 ($ million)
Chart on UK - Year-over-year growth 2025-2030 (%)
Data Table on UK - Year-over-year growth 2025-2030 (%)

13.4.3 France - Market size and forecast 2025-2030

Chart on France - Market size and forecast 2025-2030 ($ million)
Data Table on France - Market size and forecast 2025-2030 ($ million)
Chart on France - Year-over-year growth 2025-2030 (%)
Data Table on France - Year-over-year growth 2025-2030 (%)

13.4.4 Italy - Market size and forecast 2025-2030

Chart on Italy - Market size and forecast 2025-2030 ($ million)
Data Table on Italy - Market size and forecast 2025-2030 ($ million)
Chart on Italy - Year-over-year growth 2025-2030 (%)
Data Table on Italy - Year-over-year growth 2025-2030 (%)

13.4.5 Spain - Market size and forecast 2025-2030

Chart on Spain - Market size and forecast 2025-2030 ($ million)
Data Table on Spain - Market size and forecast 2025-2030 ($ million)
Chart on Spain - Year-over-year growth 2025-2030 (%)
Data Table on Spain - Year-over-year growth 2025-2030 (%)

13.4.6 The Netherlands - Market size and forecast 2025-2030

Chart on The Netherlands - Market size and forecast 2025-2030 ($ million)
Data Table on The Netherlands - Market size and forecast 2025-2030 ($ million)
Chart on The Netherlands - Year-over-year growth 2025-2030 (%)
Data Table on The Netherlands - Year-over-year growth 2025-2030 (%)

13.5 APAC - Market size and forecast 2025-2030

Chart on APAC - Market size and forecast 2025-2030 ($ million)
Data Table on APAC - Market size and forecast 2025-2030 ($ million)
Chart on APAC - Year-over-year growth 2025-2030 (%)
Data Table on APAC - Year-over-year growth 2025-2030 (%)
Chart on Regional Comparison - APAC
Data Table on Regional Comparison - APAC

13.5.1 Australia - Market size and forecast 2025-2030

Chart on Australia - Market size and forecast 2025-2030 ($ million)
Data Table on Australia - Market size and forecast 2025-2030 ($ million)
Chart on Australia - Year-over-year growth 2025-2030 (%)
Data Table on Australia - Year-over-year growth 2025-2030 (%)

13.5.2 New Zealand - Market size and forecast 2025-2030

Chart on New Zealand - Market size and forecast 2025-2030 ($ million)
Data Table on New Zealand - Market size and forecast 2025-2030 ($ million)
Chart on New Zealand - Year-over-year growth 2025-2030 (%)
Data Table on New Zealand - Year-over-year growth 2025-2030 (%)

13.5.3 China - Market size and forecast 2025-2030

Chart on China - Market size and forecast 2025-2030 ($ million)
Data Table on China - Market size and forecast 2025-2030 ($ million)
Chart on China - Year-over-year growth 2025-2030 (%)
Data Table on China - Year-over-year growth 2025-2030 (%)

13.5.4 Japan - Market size and forecast 2025-2030

Chart on Japan - Market size and forecast 2025-2030 ($ million)
Data Table on Japan - Market size and forecast 2025-2030 ($ million)
Chart on Japan - Year-over-year growth 2025-2030 (%)
Data Table on Japan - Year-over-year growth 2025-2030 (%)

13.5.5 South Korea - Market size and forecast 2025-2030

Chart on South Korea - Market size and forecast 2025-2030 ($ million)
Data Table on South Korea - Market size and forecast 2025-2030 ($ million)
Chart on South Korea - Year-over-year growth 2025-2030 (%)
Data Table on South Korea - Year-over-year growth 2025-2030 (%)

13.5.6 India - Market size and forecast 2025-2030

Chart on India - Market size and forecast 2025-2030 ($ million)
Data Table on India - Market size and forecast 2025-2030 ($ million)
Chart on India - Year-over-year growth 2025-2030 (%)
Data Table on India - Year-over-year growth 2025-2030 (%)

13.6 South America - Market size and forecast 2025-2030

Chart on South America - Market size and forecast 2025-2030 ($ million)
Data Table on South America - Market size and forecast 2025-2030 ($ million)
Chart on South America - Year-over-year growth 2025-2030 (%)
Data Table on South America - Year-over-year growth 2025-2030 (%)
Chart on Regional Comparison - South America
Data Table on Regional Comparison - South America

13.6.1 Brazil - Market size and forecast 2025-2030

Chart on Brazil - Market size and forecast 2025-2030 ($ million)
Data Table on Brazil - Market size and forecast 2025-2030 ($ million)
Chart on Brazil - Year-over-year growth 2025-2030 (%)
Data Table on Brazil - Year-over-year growth 2025-2030 (%)

13.6.2 Argentina - Market size and forecast 2025-2030

Chart on Argentina - Market size and forecast 2025-2030 ($ million)
Data Table on Argentina - Market size and forecast 2025-2030 ($ million)
Chart on Argentina - Year-over-year growth 2025-2030 (%)
Data Table on Argentina - Year-over-year growth 2025-2030 (%)

13.6.3 Chile - Market size and forecast 2025-2030

Chart on Chile - Market size and forecast 2025-2030 ($ million)
Data Table on Chile - Market size and forecast 2025-2030 ($ million)
Chart on Chile - Year-over-year growth 2025-2030 (%)
Data Table on Chile - Year-over-year growth 2025-2030 (%)

13.7 Middle East and Africa - Market size and forecast 2025-2030

Chart on Middle East and Africa - Market size and forecast 2025-2030 ($ million)
Data Table on Middle East and Africa - Market size and forecast 2025-2030 ($ million)
Chart on Middle East and Africa - Year-over-year growth 2025-2030 (%)
Data Table on Middle East and Africa - Year-over-year growth 2025-2030 (%)
Chart on Regional Comparison - Middle East and Africa
Data Table on Regional Comparison - Middle East and Africa

13.7.1 UAE - Market size and forecast 2025-2030

Chart on UAE - Market size and forecast 2025-2030 ($ million)
Data Table on UAE - Market size and forecast 2025-2030 ($ million)
Chart on UAE - Year-over-year growth 2025-2030 (%)
Data Table on UAE - Year-over-year growth 2025-2030 (%)

13.7.2 Saudi Arabia - Market size and forecast 2025-2030

Chart on Saudi Arabia - Market size and forecast 2025-2030 ($ million)
Data Table on Saudi Arabia - Market size and forecast 2025-2030 ($ million)
Chart on Saudi Arabia - Year-over-year growth 2025-2030 (%)
Data Table on Saudi Arabia - Year-over-year growth 2025-2030 (%)

13.7.3 South Africa - Market size and forecast 2025-2030

Chart on South Africa - Market size and forecast 2025-2030 ($ million)
Data Table on South Africa - Market size and forecast 2025-2030 ($ million)
Chart on South Africa - Year-over-year growth 2025-2030 (%)
Data Table on South Africa - Year-over-year growth 2025-2030 (%)

13.7.4 Israel - Market size and forecast 2025-2030

Chart on Israel - Market size and forecast 2025-2030 ($ million)
Data Table on Israel - Market size and forecast 2025-2030 ($ million)
Chart on Israel - Year-over-year growth 2025-2030 (%)
Data Table on Israel - Year-over-year growth 2025-2030 (%)

13.7.5 Morocco - Market size and forecast 2025-2030

Chart on Morocco - Market size and forecast 2025-2030 ($ million)
Data Table on Morocco - Market size and forecast 2025-2030 ($ million)
Chart on Morocco - Year-over-year growth 2025-2030 (%)
Data Table on Morocco - Year-over-year growth 2025-2030 (%)

13.8 Market opportunity by geography

Market opportunity by geography ($ million)
Data Tables on Market opportunity by geography ($ million)

14. Drivers, Challenges, and Opportunity

14.1 Market drivers

Evolution of experiential travel and desire for outdoor autonomy
Technological integration and proliferation of digital rental platforms
Expanding demographic reach and appeal of cost-effective group travel

14.2 Market challenges

High operational costs and fleet maintenance complexity
Regulatory disparities and insufficient infrastructure development
Macroeconomic volatility and discretionary spending fluctuations

14.3 Impact of drivers and challenges

Impact of drivers and challenges in 2025 and 2030

14.4 Market opportunities

Electrification and shift toward sustainable fleet management
Proliferation of high-end luxury amenities and bespoke experiences
Digital transformation and maturation of peer-to-peer rental platforms

15. Competitive Landscape

15.1 Overview

15.2

Overview on criticality of inputs and factors of differentiation

15.3 Landscape disruption

Overview on factors of disruption

15.4 Industry risks

Impact of key risks on business

16. Competitive Analysis

16.1 Companies profiled

Companies covered

16.2 Company ranking index

16.3 Market positioning of companies

Matrix on companies position and classification

16.4 Anywhere Campers

Anywhere Campers - Overview
Anywhere Campers - Product / Service
Anywhere Campers - Key offerings
SWOT

16.5 Apollo Motorhome Holidays

Apollo Motorhome Holidays - Overview
Apollo Motorhome Holidays - Product / Service
Apollo Motorhome Holidays - Key offerings
SWOT

16.6 Bunk Campers

Bunk Campers - Overview
Bunk Campers - Product / Service
Bunk Campers - Key offerings
SWOT

16.7 Campervan North America

Campervan North America - Overview
Campervan North America - Product / Service
Campervan North America - Key offerings
SWOT

16.8 CanaDream Inc.

CanaDream Inc. - Overview
CanaDream Inc. - Product / Service
CanaDream Inc. - Key offerings
SWOT

16.9 Cruise America Inc.

Cruise America Inc. - Overview
Cruise America Inc. - Product / Service
Cruise America Inc. - Key offerings
SWOT

16.10 Cruisin Motorhomes

Cruisin Motorhomes - Overview
Cruisin Motorhomes - Product / Service
Cruisin Motorhomes - Key offerings
SWOT

16.11 El Monte RV

El Monte RV - Overview
El Monte RV - Product / Service
El Monte RV - Key offerings
SWOT

16.12 Escape Campervans

Escape Campervans - Overview
Escape Campervans - Product / Service
Escape Campervans - Key offerings
SWOT

16.13 Fraserway RV GP Ltd.

Fraserway RV GP Ltd. - Overview
Fraserway RV GP Ltd. - Product / Service
Fraserway RV GP Ltd. - Key offerings
SWOT

16.14 Pacific Horizon Motorhomes

Pacific Horizon Motorhomes - Overview
Pacific Horizon Motorhomes - Product / Service
Pacific Horizon Motorhomes - Key offerings
SWOT

16.15 Rent.is

Rent.is - Overview
Rent.is - Product / Service
Rent.is - Key offerings
SWOT

16.16 Roadsurfer GmbH

Roadsurfer GmbH - Overview
Roadsurfer GmbH - Product / Service
Roadsurfer GmbH - Key offerings
SWOT

16.17 Tourism Holdings Ltd.

Tourism Holdings Ltd. - Overview
Tourism Holdings Ltd. - Business segments
Tourism Holdings Ltd. - Key offerings
Tourism Holdings Ltd. - Segment focus
SWOT

16.18 Wicked Campers

Wicked Campers - Overview
Wicked Campers - Product / Service
Wicked Campers - Key offerings
SWOT

17. Appendix

17.1 Scope of the report

Market definition
Objectives
Notes and caveats

17.2 Inclusions and exclusions checklist

Inclusions checklist
Exclusions checklist

17.3 Currency conversion rates for US$

17.4 Research methodology

17.5 Data procurement

Information sources

17.6 Data validation

17.7 Validation techniques employed for market sizing

17.8 Data synthesis

17.9 360 degree market analysis

17.10 List of abbreviations

Research Methodology

Technavio presents a detailed picture of the market by way of study, synthesis, and summation of data from multiple sources. The analysts have presented the various facets of the market with a particular focus on identifying the key industry influencers. The data thus presented is comprehensive, reliable, and the result of extensive research, both primary and secondary.

INFORMATION SOURCES

Primary sources

  • Manufacturers and suppliers
  • Channel partners
  • Industry experts
  • Strategic decision makers

Secondary sources

  • Industry journals and periodicals
  • Government data
  • Financial reports of key industry players
  • Historical data
  • Press releases

DATA ANALYSIS

Data Synthesis

  • Collation of data
  • Estimation of key figures
  • Analysis of derived insights

Data Validation

  • Triangulation with data models
  • Reference against proprietary databases
  • Corroboration with industry experts

REPORT WRITING

Qualitative

  • Market drivers
  • Market challenges
  • Market trends
  • Five forces analysis

Quantitative

  • Market size and forecast
  • Market segmentation
  • Geographical insights
  • Competitive landscape

Interested in this report?

Get your sample now to see our research methodology and insights!

Download Now

Frequently Asked Questions

Recreational Vehicle (Rv) Rental market growth will increase by USD 450.2 million during 2026-2030.

The Recreational Vehicle (Rv) Rental market is expected to grow at a CAGR of 8.9% during 2026-2030.

Recreational Vehicle (Rv) Rental market is segmented by Mode of booking (Online, Offline) Product (Caravans, Motorhomes) Rental category (Short-term rentals, Long-term rentals) Ownership (Company-owned RV rentals, Peer-to-peer (P2P) RV rentals)

Anywhere Campers, Apollo Motorhome Holidays, Bunk Campers, Campervan North America, CanaDream Inc., Cruise America Inc., Cruisin Motorhomes, El Monte RV, Escape Campervans, Four Seasons RV Rentals, Fraserway RV GP Ltd., JUCY Rentals, Just go Motorhome Hire, McRent, Pacific Horizon Motorhomes, Rent.is, Roadsurfer GmbH, Touring Cars, Tourism Holdings Ltd., Wicked Campers are a few of the key vendors in the Recreational Vehicle (Rv) Rental market.

North America will register the highest growth rate of 33.9% among the other regions. Therefore, the Recreational Vehicle (Rv) Rental market in North America is expected to garner significant business opportunities for the vendors during the forecast period.

US, Canada, Mexico, Germany, UK, France, Italy, Spain, The Netherlands, Australia, New Zealand, China, Japan, South Korea, India, Brazil, Argentina, Chile, UAE, Saudi Arabia, South Africa, Israel, Morocco

  • Evolution of experiential travel and desire for outdoor autonomy is the driving factor this market.

The Recreational Vehicle (Rv) Rental market vendors should focus on grabbing business opportunities from the Mode of booking segment as it accounted for the largest market share in the base year.
RIA - Research AI Assistant
Ask RIA