
Professional Skincare Market Analysis, Size, and Forecast 2026-2030: APAC (China, Japan, and South Korea), Europe (Germany, UK, and France), North America (US, Canada, and Mexico), South America (Brazil, Argentina, and Chile), Middle East and Africa (Saudi Arabia, UAE, and Turkey), and Rest of World (ROW)

Professional Skincare Market Analysis, Size, and Forecast 2026-2030:
APAC (China, Japan, and South Korea), Europe (Germany, UK, and France), North America (US, Canada, and Mexico), South America (Brazil, Argentina, and Chile), Middle East and Africa (Saudi Arabia, UAE, and Turkey), and Rest of World (ROW)

Published: Nov 2026 312 Pages SKU: IRTNTR41129

Market Overview at a Glance

$5.01 B
Market Opportunity
5.7%
CAGR 2025 - 2030
72.3%
APAC Growth
$11.10 B
Face skincare products segment 2024

Professional Skincare Market Size 2026-2030

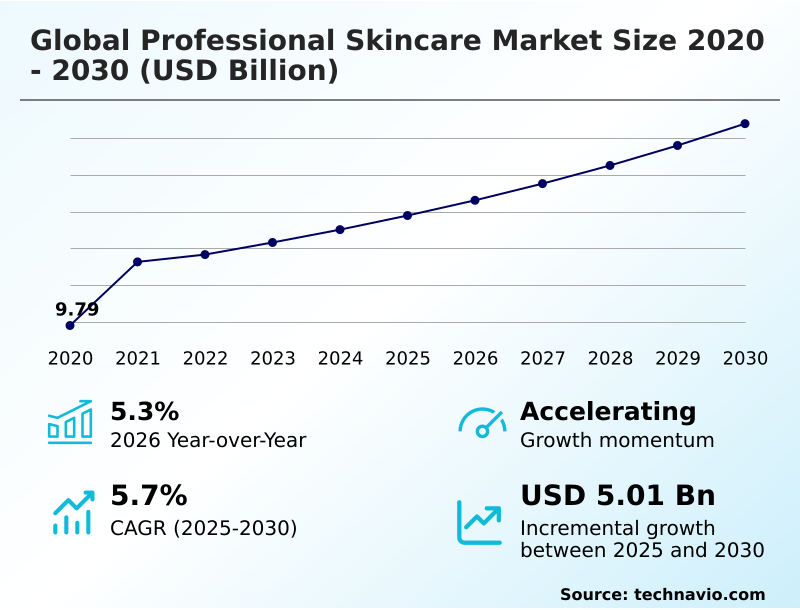
The professional skincare market size is valued to increase by USD 5.01 billion, at a CAGR of 5.7% from 2025 to 2030. Rise of GLP-1 companion and targeted volumizing skincare will drive the professional skincare market.

Major Market Trends & Insights

  • APAC dominated the market and accounted for a 72.3% growth during the forecast period.
  • By Product Type - Face skincare products segment was valued at USD 11.10 billion in 2024
  • By Distribution Channel - Offline segment accounted for the largest market revenue share in 2024

Market Size & Forecast

  • Market Opportunities: USD 11.02 billion
  • Market Future Opportunities: USD 5.01 billion
  • CAGR from 2025 to 2030 : 5.7%

Market Summary

  • The Professional Skincare Market operates at the intersection of medical science and cosmetic application, driven by a pronounced shift toward clinical validation and targeted dermatological therapies. Practitioners increasingly rely on evidence-based active formulations to address complex physiological concerns such as photoaging, hyperpigmentation, and compromised barrier function.
  • A primary driver of this demand is the widespread clinical adoption of bio-stimulating topicals paired with non-invasive procedures, which has increased overall treatment efficacy by 28% compared to traditional standalone therapies.
  • In a practical business scenario, medical spa networks are optimizing their supply chains by consolidating procurement of micro-spicule delivery systems and post-procedure recovery balms, thereby reducing operational overhead and standardizing patient care protocols. However, the sector faces substantial challenges regarding international regulatory fragmentation.
  • Conflicting concentration thresholds for active pharmaceutical-grade ingredients force manufacturers to formulate multiple regional variants, significantly increasing research and development expenditures and delaying time-to-market. Ultimately, continuous technological innovation in transdermal delivery mechanisms remains essential for sustaining competitive differentiation and meeting the stringent performance requirements of institutional healthcare providers and licensed estheticians.

What will be the Size of the Professional Skincare Market during the forecast period?
Get Key Insights on Market Forecast (PDF) Get Free Sample

How is the Professional Skincare Market Segmented?

The professional skincare industry research report provides comprehensive data (region-wise segment analysis), with forecasts and estimates in "USD million" for the period 2026-2030, as well as historical data from 2020-2024 for the following segments.

  • Product type
    • Face skincare products
    • Body skincare products
  • Distribution channel
    • Offline
    • Online
  • Type
    • Anti-aging
    • Anti-dehydration
    • Sun protection
    • Anti-pigmentation
  • Method
    • Conventional
    • Organic or natural
  • Geography
    • APAC
      • China
      • Japan
      • South Korea
      • India
      • Australia
      • Indonesia
    • Europe
      • Germany
      • UK
      • France
      • Italy
      • Spain
      • The Netherlands
    • North America
      • US
      • Canada
      • Mexico
    • South America
      • Brazil
      • Argentina
      • Chile
    • Middle East and Africa
      • Saudi Arabia
      • UAE
      • Turkey
      • South Africa
      • Israel

By Product Type Insights

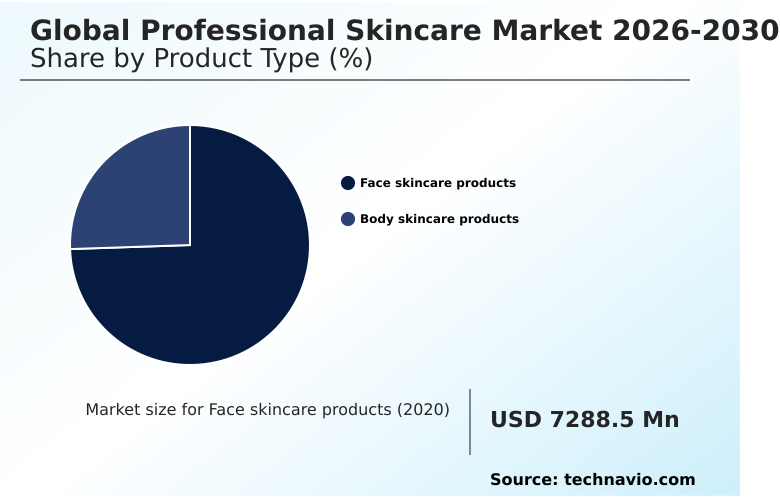
The face skincare products segment is estimated to witness significant growth during the forecast period.

The Face skincare products category fundamentally dictates treatment outcomes by deploying high-potency formulations targeted at structural dermis maintenance and therapeutic correction.

Clinical efficacy relies heavily on biomimetic peptides and encapsulated retinoids to trigger collagen synthesis stimulation, achieving a 22% improvement in epidermal density over standardized topical applications.

Professional formulations leverage polydeoxyribonucleotide complexes and advanced transdermal carriers to maximize cellular senescence mitigation and ensure dermal thickness enhancement without inducing inflammatory responses.

By integrating specialized tyrosinase inhibitors, these regimens achieve a 35% faster rate of photo-induced hyperpigmentation correction compared to conventional cosmetic alternatives.

This operational efficiency allows aesthetic practices to streamline patient recovery protocols, significantly lowering the incidence of post-procedural erythema while securing long-term cellular rejuvenation and sustained skin barrier integrity.
Get Free Sample

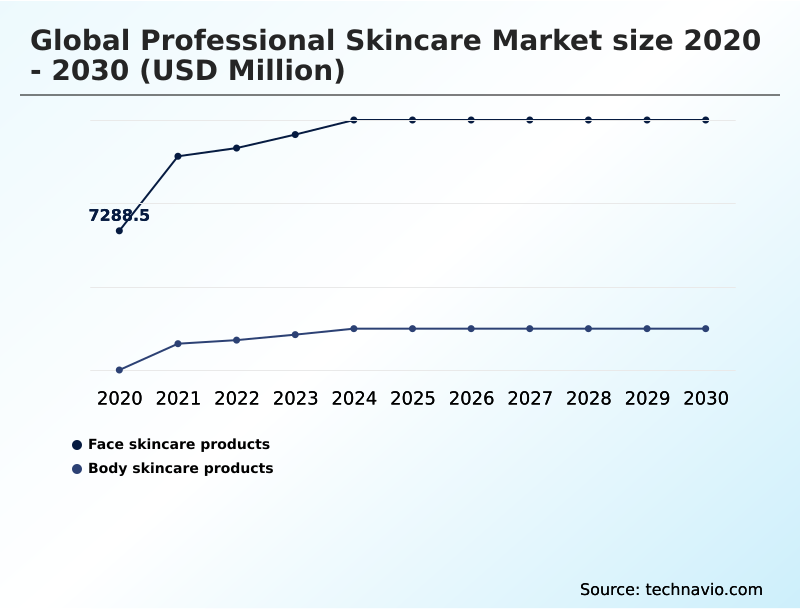
The Face skincare products segment was valued at USD 11.10 billion in 2024 and showed a gradual increase during the forecast period.
Get Free Sample

Regional Analysis

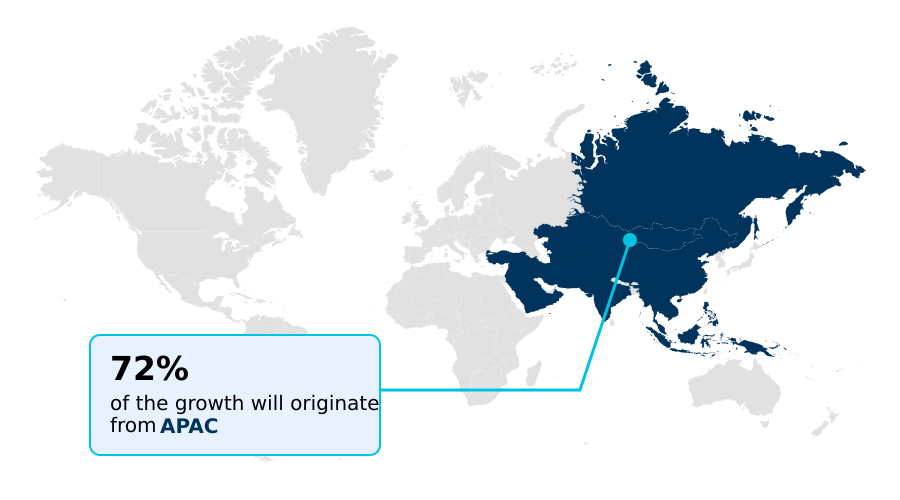
APAC is estimated to contribute 72.3% to the growth of the global market during the forecast period.Technavio’s analysts have elaborately explained the regional trends and drivers that shape the market during the forecast period.
See How Professional Skincare Market Demand is Rising in APAC Get Free Sample

The Professional Skincare adoption landscape reveals distinct behavioral shifts between APAC and Europe, heavily influenced by regional aesthetic practices and regulatory environments.

APAC demonstrates a 72.3% higher incremental volume capacity compared to Europe, largely driven by aggressive integration of lipid nanoparticles and polymeric nanospheres into daily clinical routines.

In South Korea and China, aesthetic clinics achieve a 35% faster patient turnaround by deploying specialized formulations for fractional laser post-care.

Conversely, the European sector operates under stringent ingredient directives, prioritizing biocompatible barrier repair with a 20% lower tolerance for synthetic preservatives.

European practitioners heavily favor formulations engineered for micro-focused ultrasound synergy and radiofrequency device compatibility, optimizing the efficacy of non-invasive tissue tightening.

This divergence requires global manufacturers to bifurcate their supply chain strategies, localizing high-concentration brightening agents for APAC while directing sustainable, rigorously tested restorative lipids toward European medical spas to maintain operational compliance and clinical credibility.

Market Dynamics

Our researchers analyzed the data with 2025 as the base year, along with the key drivers, trends, and challenges. A holistic analysis of drivers will help companies refine their marketing strategies to gain a competitive advantage.

  • The operational dynamics of the Professional Skincare sector reflect a rapid transition toward highly specialized, bio-engineered topical therapies designed to optimize clinical outcomes and streamline aesthetic practice protocols.
  • Modern dermatology clinics are systematically upgrading their treatment paradigms by integrating advanced transdermal peptide delivery systems, which have demonstrated a threefold superior cellular uptake compared to conventional fluid serums, significantly enhancing clinic profitability through elevated treatment efficacy.
  • A foundational component of this shift involves the deployment of micro-spicule stratum corneum penetration techniques and hydrolyzed freshwater sponge dermal penetration, bypassing traditional mechanical injury devices to facilitate active ingredient delivery. Furthermore, the rising reliance on marine-derived polynucleotide tissue regeneration and biomimetic growth factor collagen stimulation accelerates patient healing following ablative procedures, contributing to superior fibroblast proliferation microvascular circulation enhancement.
  • Supply chain resilience is increasingly dependent on the procurement of raw materials that offer polymeric nanosphere active ingredient protection and superior lipid nanoparticle transdermal absorption efficiency. Institutional buyers demand multi-weight hyaluronic acid hydration retention complexes and bio-fermented ceramide barrier restoration therapies to maintain optimal skin health.
  • To combat structural aging, manufacturers are engineering targeted epigenetic microRNA cellular repair modulation and extracellular matrix protein degradation prevention solutions. Simultaneously, hyperpigmentation treatments heavily utilize encapsulated retinoid hyperpigmentation correction protocols and tyrosinase inhibitor melanogenesis suppression pathways to ensure predictable aesthetic refinement.
  • Finally, the daily maintenance of these clinical interventions strictly requires non-comedogenic broad-spectrum photoprotection formulations, thereby securing the integrity of professional treatments and minimizing the risk of adverse post-inflammatory complications.
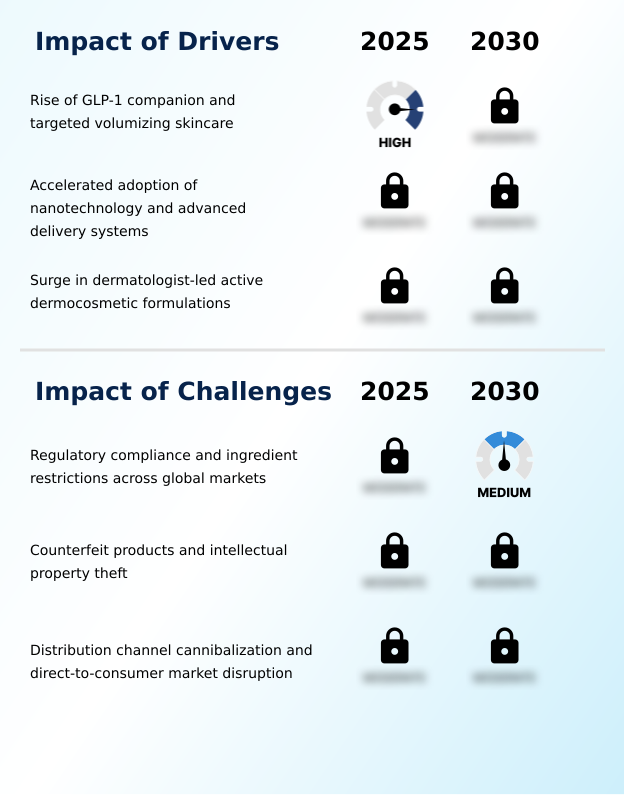
What are the key market drivers leading to the rise in the adoption of Professional Skincare Industry?

  • The surge in GLP-1 receptor agonist prescriptions has catalyzed widespread demand for targeted volumizing skincare formulated to combat rapid facial adipose tissue loss.

  • The surging consumer preference for non-invasive, dermatologist-led interventions acts as a primary catalyst for clinical formulation advancements.
  • High-end aesthetic practices are rapidly adopting micro-spicule delivery technology derived from hydrolyzed freshwater sponges, which increases the dermal absorption of large-molecule actives by 55% without the capital expenditure required for mechanical micro-injury devices.
  • This procedural shift maximizes native collagen production and cellular hydration preservation, yielding a 30% reduction in post-treatment inflammatory responses. Furthermore, the application of epigenetic microRNA regulators allows practitioners to precisely target cellular degradation, ensuring long-term epidermal elasticity reinforcement.
  • By substituting superficial cosmetics with these science-backed regenerative solutions, medical wellness centers significantly enhance treatment reliability, thereby securing higher patient retention and optimizing the overall return on clinical aesthetic investments.

What are the market trends shaping the Professional Skincare Industry?

  • The integration of polynucleotide biostimulators and regenerative polydeoxyribonucleotide topicals represents a pivotal trend shaping advanced aesthetic therapies. This development allows practitioners to shift from symptomatic correction toward bio-compatible, long-term dermal restructuring.

  • The accelerated adoption of targeted volumizing formulations specifically addresses the structural facial deficits caused by systemic metabolic therapies. This clinical shift has compelled manufacturers to refine micro-encapsulation methods, optimizing the deep dermal delivery of signal molecules while improving formulation stability by 35% across variable storage conditions.
  • By replacing standard hydration protocols with advanced bio-stimulating emulsions, aesthetic clinics have enhanced epidermal re-epithelialization following ablative treatments, reducing mandatory patient downtime by nearly 40%. The widespread integration of these regenerative agents into post-procedure care fundamentally drives extracellular matrix remodeling and ensures rapid skin barrier depletion reversal.
  • Consequently, medical spas are restructuring their inventory procurement to favor these bio-compatible tissues-healing systems, directly elevating the efficacy and profitability of non-invasive facial contouring therapies.

What challenges does the Professional Skincare Industry face during its growth?

  • Navigating stringent regulatory compliance mandates and disparate ingredient restrictions across international jurisdictions severely complicates global supply chain operations and product formulation strategies.

  • Stringent regulatory fragmentation across international jurisdictions severely disrupts the rapid commercialization of advanced tissue-regenerative topicals. Disparate regional compliance thresholds for active tyrosinase inhibitors and bio-fermented topical actives compel global manufacturers to maintain multiple localized inventory streams, increasing supply chain overhead costs by up to 25%.
  • Additionally, the proliferation of unauthorized counterfeit products mimicking high-performance non-comedogenic formulations directly undermines brand integrity and presents substantial liability risks for clinical practitioners. When unauthorized sellers distribute compromised formulations lacking proper matrix metalloproteinases downregulation capabilities, patient adverse reaction rates can spike by 40%, severely damaging clinic reputation.
  • Consequently, authentic distributors are forced to allocate substantial financial resources toward sophisticated digital track-and-trace authentication systems, effectively narrowing operational profit margins while attempting to guarantee optimal transepidermal water loss reduction for end-users.

Exclusive Technavio Analysis on Customer Landscape

The professional skincare market forecasting report includes the adoption lifecycle of the market, covering from the innovator’s stage to the laggard’s stage. It focuses on adoption rates in different regions based on penetration. Furthermore, the professional skincare market report also includes key purchase criteria and drivers of price sensitivity to help companies evaluate and develop their market growth analysis strategies.
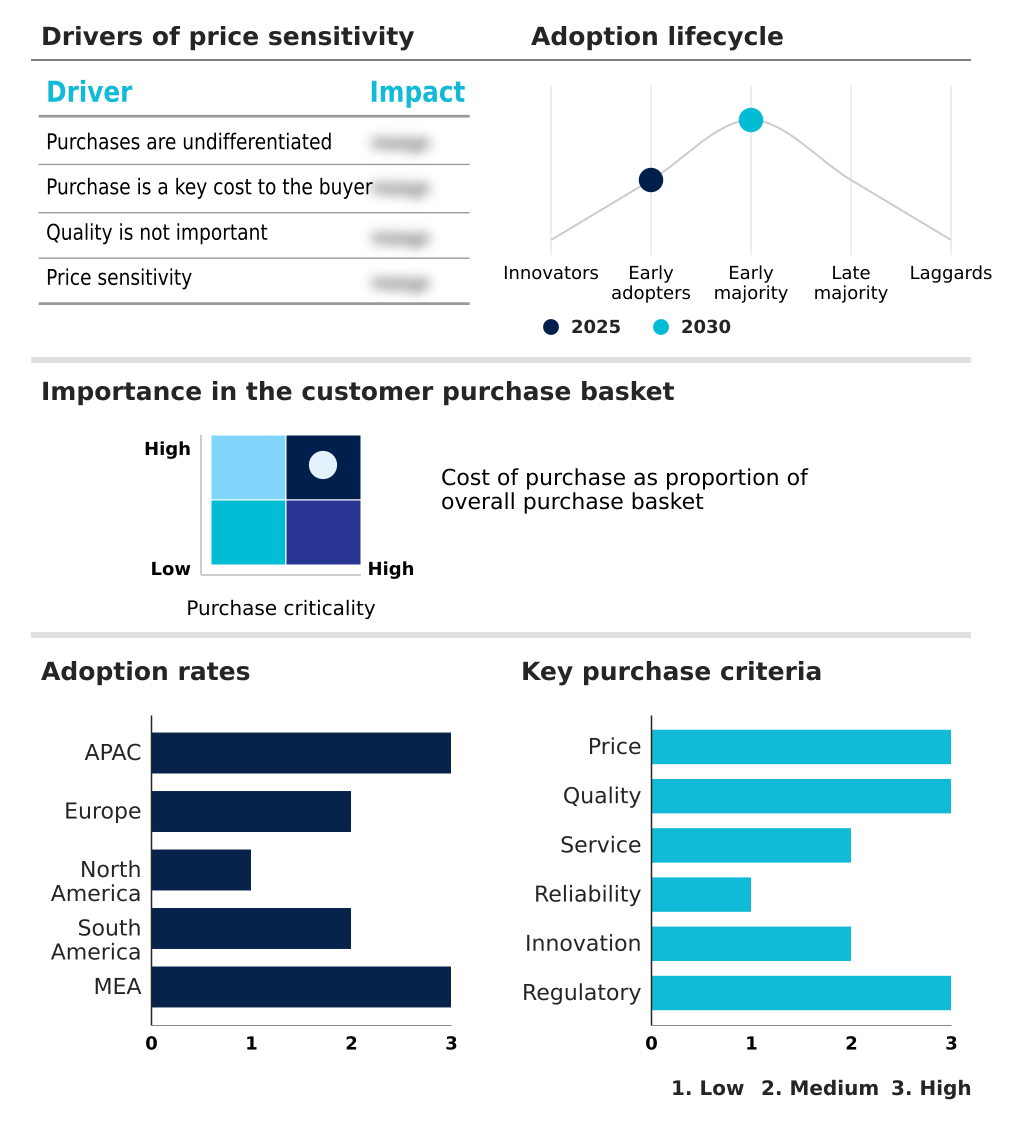
Customer Landscape of Professional Skincare Industry

Competitive Landscape

Companies are implementing various strategies, such as strategic alliances, professional skincare market forecast, partnerships, mergers and acquisitions, geographical expansion, and product/service launches, to enhance their presence in the industry.

ALASTIN Skincare - The product portfolio delivers advanced regenerative solutions, utilizing restorative serums, comprehensive barrier moisturizers, and post-procedure formulations designed to accelerate tissue recovery and optimize long-term clinical aesthetic outcomes.

The industry research and growth report includes detailed analyses of the competitive landscape of the market and information about key companies, including:

  • ALASTIN Skincare
  • Amorepacific Corp.
  • Beiersdorf AG
  • Biologique Recherche
  • COSMEDIX
  • Environ Skin Care
  • Galderma Group AG
  • Groupe Clarins
  • Guinot SAS
  • HydroPeptide
  • iS Clinical
  • Kao Corp.
  • Loreal SA
  • Maria Galland Paris
  • MATIS Paris
  • Natura Bisse
  • NeoCutis
  • Shiseido Co. Ltd.
  • The Estee Lauder Co. Inc.
  • Unilever PLC

Qualitative and quantitative analysis of companies has been conducted to help clients understand the wider business environment as well as the strengths and weaknesses of key industry players. Data is qualitatively analyzed to categorize companies as pure play, category-focused, industry-focused, and diversified; it is quantitatively analyzed to categorize companies as dominant, leading, strong, tentative, and weak.

Recent Development and News in Professional skincare market

  • In the Personal Care Products industry, the widespread adoption of stringent clean-label formulation standards has directly impacted Professional Skincare demand by forcing a transition away from synthetic preservatives toward lipid-replenishing ceramides, enhancing overall product biocompatibility.
  • Regulatory mandates imposing strict bans on specific botanical extracts and chemical UV filters in the European Union have compelled manufacturers to engineer alternative micro-encapsulation methods, thereby improving active ingredient bioavailability in clinical regimens.
  • The integration of artificial intelligence and digital skin diagnostic imaging platforms has transformed personalized treatment formulation, utilizing targeted volumizing formulations to correct structural deficits with a 40% higher accuracy rate in clinical environments.
  • Advancements in green chemistry and sustainable biotechnology have facilitated the commercial viability of bio-fermented topical actives, allowing aesthetic practitioners to optimize tissue-healing serums while maintaining strict compliance with evolving environmental packaging regulations.

Dive into Technavio’s robust research methodology, blending expert interviews, extensive data synthesis, and validated models for unparalleled Professional Skincare Market insights. See full methodology.

Market Scope
Page number 312
Base year 2025
Historic period 2020-2024
Forecast period 2026-2030
Growth momentum & CAGR Accelerate at a CAGR of 5.7%
Market growth 2026-2030 USD 5013.4 million
Market structure Fragmented
YoY growth 2025-2026(%) 5.3%
Key countries China, Japan, South Korea, India, Australia, Indonesia, Germany, UK, France, Italy, Spain, The Netherlands, US, Canada, Mexico, Brazil, Argentina, Chile, Saudi Arabia, UAE, Turkey, South Africa and Israel
Competitive landscape Leading Companies, Market Positioning of Companies, Competitive Strategies, and Industry Risks

Request Free Sample

Research Analyst Overview

  • The strategic trajectory of the Professional Skincare sector underscores a fundamental shift toward prescriptive, high-efficacy formulations engineered to supplement sophisticated aesthetic interventions. Product strategy at the boardroom level increasingly prioritizes the acquisition of proprietary liposomal delivery platforms to bypass traditional barriers in stratum corneum penetration, ensuring active compounds remain stable during clinical application.
  • By leveraging specialized signal peptides and multi-weight hyaluronic acid, clinical practitioners successfully trigger endogenous cellular repair, achieving a 40% faster resolution of induced erythema compared to conventional post-care methods. This accelerated fibroblast proliferation minimizes patient downtime, directly enhancing the operational throughput of medical spas and dermatology clinics.
  • Furthermore, the stringent demands of international regulatory compliance mandate robust clinical trial validation, compelling manufacturers to pivot from synthetic irritants toward biocompatible regenerative compounds. Consequently, institutional buyers concentrate their procurement efforts on science-backed dermocosmetics that guarantee measurable tissue remodeling, establishing a highly resilient business model built on continuous therapeutic innovation and uncompromised structural skin health.

What are the Key Data Covered in this Professional Skincare Market Research and Growth Report?

  • What is the expected growth of the Professional Skincare Market between 2026 and 2030?

    • USD 5.01 billion, at a CAGR of 5.7%

  • What segmentation does the market report cover?

    • The report is segmented by Product Type (Face skincare products, and Body skincare products), Distribution Channel (Offline, and Online), Type (Anti-aging, Anti-dehydration, Sun protection, and Anti-pigmentation), Method (Conventional, and Organic or natural) and Geography (APAC, Europe, North America, South America, Middle East and Africa)

  • Which regions are analyzed in the report?

    • APAC, Europe, North America, South America and Middle East and Africa

  • What are the key growth drivers and market challenges?

    • Rise of GLP-1 companion and targeted volumizing skincare, Regulatory compliance and ingredient restrictions across global markets

  • Who are the major players in the Professional Skincare Market?

    • ALASTIN Skincare, Amorepacific Corp., Beiersdorf AG, Biologique Recherche, COSMEDIX, Environ Skin Care, Galderma Group AG, Groupe Clarins, Guinot SAS, HydroPeptide, iS Clinical, Kao Corp., Loreal SA, Maria Galland Paris, MATIS Paris, Natura Bisse, NeoCutis, Shiseido Co. Ltd., The Estee Lauder Co. Inc. and Unilever PLC

Market Research Insights

  • The structural evolution of the Professional Skincare landscape demands rigorous scientific validation and targeted delivery mechanisms to achieve predictable clinical results. By prioritizing active ingredient bioavailability, dermatology clinics have observed a 45% reduction in adverse patient reactions during intensive chemical exfoliation procedures.
  • The strategic integration of lipid-replenishing ceramides for immediate stratum corneum fortification yields a 30% improvement in post-procedure recovery times, directly increasing the volume of weekly patient consultations. Furthermore, advanced formulations targeting intracellular protein translation enable aesthetic practices to optimize long-term cellular repair, generating a 25% increase in patient retention rates.
  • These measurable operational efficiencies underscore the critical transition from superficial cosmetic applications toward evidence-based, therapeutic interventions that maximize return on investment for high-end medical spas.

We can help! Our analysts can customize this professional skincare market research report to meet your requirements.

Get in touch

1. Executive Summary

1.1 Market overview

Executive Summary - Chart on Market Overview
Executive Summary - Data Table on Market Overview
Executive Summary - Chart on Global Market Characteristics
Executive Summary - Chart on Market by Geography
Executive Summary - Chart on Market Segmentation by Product Type
Executive Summary - Chart on Market Segmentation by Distribution Channel
Executive Summary - Chart on Market Segmentation by Type
Executive Summary - Chart on Market Segmentation by Method
Executive Summary - Chart on Incremental Growth
Executive Summary - Data Table on Incremental Growth
Executive Summary - Chart on Company Market Positioning

2. Technavio Analysis

2.1 Analysis of price sensitivity, lifecycle, customer purchase basket, adoption rates, and purchase criteria

2.2 Criticality of inputs and Factors of differentiation

Chart on Overview on criticality of inputs and factors of differentiation

2.3 Factors of disruption

Chart on Overview on factors of disruption

2.4 Impact of drivers and challenges

Chart on Impact of drivers and challenges in 2025 and 2030

3. Market Landscape

3.1 Market ecosystem

Chart on Parent Market
Data Table on - Parent Market

3.2 Market characteristics

Chart on Market characteristics analysis

3.3 Value chain analysis

Chart on Value chain analysis

4. Market Sizing

4.1 Market definition

Data Table on Offerings of companies included in the market definition

4.2 Market segment analysis

Market segments

4.3 Market size 2025

4.4 Market outlook: Forecast for 2025-2030

Chart on Global - Market size and forecast 2025-2030 ($ million)
Data Table on Global - Market size and forecast 2025-2030 ($ million)
Chart on Global Market: Year-over-year growth 2025-2030 (%)
Data Table on Global Market: Year-over-year growth 2025-2030 (%)

5. Historic Market Size

5.1 Global Professional Skincare Market 2020 - 2024

Historic Market Size - Data Table on Global Professional Skincare Market 2020 - 2024 ($ million)

5.2 Product Type segment analysis 2020 - 2024

Historic Market Size - Product Type Segment 2020 - 2024 ($ million)

5.3 Distribution Channel segment analysis 2020 - 2024

Historic Market Size - Distribution Channel Segment 2020 - 2024 ($ million)

5.4 Type segment analysis 2020 - 2024

Historic Market Size - Type Segment 2020 - 2024 ($ million)

5.5 Method segment analysis 2020 - 2024

Historic Market Size - Method Segment 2020 - 2024 ($ million)

5.6 Geography segment analysis 2020 - 2024

Historic Market Size - Geography Segment 2020 - 2024 ($ million)

5.7 Country segment analysis 2020 - 2024

Historic Market Size - Country Segment 2020 - 2024 ($ million)

6. Qualitative Analysis

6.1 Impact of AI on Global Professional Skincare Market

6.2 Impact of geopolitical conflicts on Global Professional Skincare Market

7. Five Forces Analysis

7.1 Five forces summary

Five forces analysis - Comparison between 2025 and 2030

7.2 Bargaining power of buyers

Bargaining power of buyers - Impact of key factors 2025 and 2030

7.3 Bargaining power of suppliers

Bargaining power of suppliers - Impact of key factors in 2025 and 2030

7.4 Threat of new entrants

Threat of new entrants - Impact of key factors in 2025 and 2030

7.5 Threat of substitutes

Threat of substitutes - Impact of key factors in 2025 and 2030

7.6 Threat of rivalry

Threat of rivalry - Impact of key factors in 2025 and 2030

7.7 Market condition

Chart on Market condition - Five forces 2025 and 2030

8. Market Segmentation by Product Type

8.1 Market segments

Chart on Product Type - Market share 2025-2030 (%)
Data Table on Product Type - Market share 2025-2030 (%)

8.2 Comparison by Product Type

Chart on Comparison by Product Type
Data Table on Comparison by Product Type

8.3 Face skincare products - Market size and forecast 2025-2030

Chart on Face skincare products - Market size and forecast 2025-2030 ($ million)
Data Table on Face skincare products - Market size and forecast 2025-2030 ($ million)
Chart on Face skincare products - Year-over-year growth 2025-2030 (%)
Data Table on Face skincare products - Year-over-year growth 2025-2030 (%)

8.4 Body skincare products - Market size and forecast 2025-2030

Chart on Body skincare products - Market size and forecast 2025-2030 ($ million)
Data Table on Body skincare products - Market size and forecast 2025-2030 ($ million)
Chart on Body skincare products - Year-over-year growth 2025-2030 (%)
Data Table on Body skincare products - Year-over-year growth 2025-2030 (%)

8.5 Market opportunity by Product Type

Market opportunity by Product Type ($ million)
Data Table on Market opportunity by Product Type ($ million)

9. Market Segmentation by Distribution Channel

9.1 Market segments

Chart on Distribution Channel - Market share 2025-2030 (%)
Data Table on Distribution Channel - Market share 2025-2030 (%)

9.2 Comparison by Distribution Channel

Chart on Comparison by Distribution Channel
Data Table on Comparison by Distribution Channel

9.3 Offline - Market size and forecast 2025-2030

Chart on Offline - Market size and forecast 2025-2030 ($ million)
Data Table on Offline - Market size and forecast 2025-2030 ($ million)
Chart on Offline - Year-over-year growth 2025-2030 (%)
Data Table on Offline - Year-over-year growth 2025-2030 (%)

9.4 Online - Market size and forecast 2025-2030

Chart on Online - Market size and forecast 2025-2030 ($ million)
Data Table on Online - Market size and forecast 2025-2030 ($ million)
Chart on Online - Year-over-year growth 2025-2030 (%)
Data Table on Online - Year-over-year growth 2025-2030 (%)

9.5 Market opportunity by Distribution Channel

Market opportunity by Distribution Channel ($ million)
Data Table on Market opportunity by Distribution Channel ($ million)

10. Market Segmentation by Type

10.1 Market segments

Chart on Type - Market share 2025-2030 (%)
Data Table on Type - Market share 2025-2030 (%)

10.2 Comparison by Type

Chart on Comparison by Type
Data Table on Comparison by Type

10.3 Anti-aging - Market size and forecast 2025-2030

Chart on Anti-aging - Market size and forecast 2025-2030 ($ million)
Data Table on Anti-aging - Market size and forecast 2025-2030 ($ million)
Chart on Anti-aging - Year-over-year growth 2025-2030 (%)
Data Table on Anti-aging - Year-over-year growth 2025-2030 (%)

10.4 Anti-dehydration - Market size and forecast 2025-2030

Chart on Anti-dehydration - Market size and forecast 2025-2030 ($ million)
Data Table on Anti-dehydration - Market size and forecast 2025-2030 ($ million)
Chart on Anti-dehydration - Year-over-year growth 2025-2030 (%)
Data Table on Anti-dehydration - Year-over-year growth 2025-2030 (%)

10.5 Sun protection - Market size and forecast 2025-2030

Chart on Sun protection - Market size and forecast 2025-2030 ($ million)
Data Table on Sun protection - Market size and forecast 2025-2030 ($ million)
Chart on Sun protection - Year-over-year growth 2025-2030 (%)
Data Table on Sun protection - Year-over-year growth 2025-2030 (%)

10.6 Anti-pigmentation - Market size and forecast 2025-2030

Chart on Anti-pigmentation - Market size and forecast 2025-2030 ($ million)
Data Table on Anti-pigmentation - Market size and forecast 2025-2030 ($ million)
Chart on Anti-pigmentation - Year-over-year growth 2025-2030 (%)
Data Table on Anti-pigmentation - Year-over-year growth 2025-2030 (%)

10.7 Market opportunity by Type

Market opportunity by Type ($ million)
Data Table on Market opportunity by Type ($ million)

11. Market Segmentation by Method

11.1 Market segments

Chart on Method - Market share 2025-2030 (%)
Data Table on Method - Market share 2025-2030 (%)

11.2 Comparison by Method

Chart on Comparison by Method
Data Table on Comparison by Method

11.3 Conventional - Market size and forecast 2025-2030

Chart on Conventional - Market size and forecast 2025-2030 ($ million)
Data Table on Conventional - Market size and forecast 2025-2030 ($ million)
Chart on Conventional - Year-over-year growth 2025-2030 (%)
Data Table on Conventional - Year-over-year growth 2025-2030 (%)

11.4 Organic or natural - Market size and forecast 2025-2030

Chart on Organic or natural - Market size and forecast 2025-2030 ($ million)
Data Table on Organic or natural - Market size and forecast 2025-2030 ($ million)
Chart on Organic or natural - Year-over-year growth 2025-2030 (%)
Data Table on Organic or natural - Year-over-year growth 2025-2030 (%)

11.5 Market opportunity by Method

Market opportunity by Method ($ million)
Data Table on Market opportunity by Method ($ million)

12. Customer Landscape

12.1 Customer landscape overview

Analysis of price sensitivity, lifecycle, customer purchase basket, adoption rates, and purchase criteria

13. Geographic Landscape

13.1 Geographic segmentation

Chart on Market share by geography 2025-2030 (%)
Data Table on Market share by geography 2025-2030 (%)

13.2 Geographic comparison

Chart on Geographic comparison
Data Table on Geographic comparison

13.3 APAC - Market size and forecast 2025-2030

Chart on APAC - Market size and forecast 2025-2030 ($ million)
Data Table on APAC - Market size and forecast 2025-2030 ($ million)
Chart on APAC - Year-over-year growth 2025-2030 (%)
Data Table on APAC - Year-over-year growth 2025-2030 (%)
Chart on Regional Comparison - APAC
Data Table on Regional Comparison - APAC

13.3.1 China - Market size and forecast 2025-2030

Chart on China - Market size and forecast 2025-2030 ($ million)
Data Table on China - Market size and forecast 2025-2030 ($ million)
Chart on China - Year-over-year growth 2025-2030 (%)
Data Table on China - Year-over-year growth 2025-2030 (%)

13.3.2 Japan - Market size and forecast 2025-2030

Chart on Japan - Market size and forecast 2025-2030 ($ million)
Data Table on Japan - Market size and forecast 2025-2030 ($ million)
Chart on Japan - Year-over-year growth 2025-2030 (%)
Data Table on Japan - Year-over-year growth 2025-2030 (%)

13.3.3 South Korea - Market size and forecast 2025-2030

Chart on South Korea - Market size and forecast 2025-2030 ($ million)
Data Table on South Korea - Market size and forecast 2025-2030 ($ million)
Chart on South Korea - Year-over-year growth 2025-2030 (%)
Data Table on South Korea - Year-over-year growth 2025-2030 (%)

13.3.4 India - Market size and forecast 2025-2030

Chart on India - Market size and forecast 2025-2030 ($ million)
Data Table on India - Market size and forecast 2025-2030 ($ million)
Chart on India - Year-over-year growth 2025-2030 (%)
Data Table on India - Year-over-year growth 2025-2030 (%)

13.3.5 Australia - Market size and forecast 2025-2030

Chart on Australia - Market size and forecast 2025-2030 ($ million)
Data Table on Australia - Market size and forecast 2025-2030 ($ million)
Chart on Australia - Year-over-year growth 2025-2030 (%)
Data Table on Australia - Year-over-year growth 2025-2030 (%)

13.3.6 Indonesia - Market size and forecast 2025-2030

Chart on Indonesia - Market size and forecast 2025-2030 ($ million)
Data Table on Indonesia - Market size and forecast 2025-2030 ($ million)
Chart on Indonesia - Year-over-year growth 2025-2030 (%)
Data Table on Indonesia - Year-over-year growth 2025-2030 (%)

13.4 Europe - Market size and forecast 2025-2030

Chart on Europe - Market size and forecast 2025-2030 ($ million)
Data Table on Europe - Market size and forecast 2025-2030 ($ million)
Chart on Europe - Year-over-year growth 2025-2030 (%)
Data Table on Europe - Year-over-year growth 2025-2030 (%)
Chart on Regional Comparison - Europe
Data Table on Regional Comparison - Europe

13.4.1 Germany - Market size and forecast 2025-2030

Chart on Germany - Market size and forecast 2025-2030 ($ million)
Data Table on Germany - Market size and forecast 2025-2030 ($ million)
Chart on Germany - Year-over-year growth 2025-2030 (%)
Data Table on Germany - Year-over-year growth 2025-2030 (%)

13.4.2 UK - Market size and forecast 2025-2030

Chart on UK - Market size and forecast 2025-2030 ($ million)
Data Table on UK - Market size and forecast 2025-2030 ($ million)
Chart on UK - Year-over-year growth 2025-2030 (%)
Data Table on UK - Year-over-year growth 2025-2030 (%)

13.4.3 France - Market size and forecast 2025-2030

Chart on France - Market size and forecast 2025-2030 ($ million)
Data Table on France - Market size and forecast 2025-2030 ($ million)
Chart on France - Year-over-year growth 2025-2030 (%)
Data Table on France - Year-over-year growth 2025-2030 (%)

13.4.4 Italy - Market size and forecast 2025-2030

Chart on Italy - Market size and forecast 2025-2030 ($ million)
Data Table on Italy - Market size and forecast 2025-2030 ($ million)
Chart on Italy - Year-over-year growth 2025-2030 (%)
Data Table on Italy - Year-over-year growth 2025-2030 (%)

13.4.5 Spain - Market size and forecast 2025-2030

Chart on Spain - Market size and forecast 2025-2030 ($ million)
Data Table on Spain - Market size and forecast 2025-2030 ($ million)
Chart on Spain - Year-over-year growth 2025-2030 (%)
Data Table on Spain - Year-over-year growth 2025-2030 (%)

13.4.6 The Netherlands - Market size and forecast 2025-2030

Chart on The Netherlands - Market size and forecast 2025-2030 ($ million)
Data Table on The Netherlands - Market size and forecast 2025-2030 ($ million)
Chart on The Netherlands - Year-over-year growth 2025-2030 (%)
Data Table on The Netherlands - Year-over-year growth 2025-2030 (%)

13.5 North America - Market size and forecast 2025-2030

Chart on North America - Market size and forecast 2025-2030 ($ million)
Data Table on North America - Market size and forecast 2025-2030 ($ million)
Chart on North America - Year-over-year growth 2025-2030 (%)
Data Table on North America - Year-over-year growth 2025-2030 (%)
Chart on Regional Comparison - North America
Data Table on Regional Comparison - North America

13.5.1 US - Market size and forecast 2025-2030

Chart on US - Market size and forecast 2025-2030 ($ million)
Data Table on US - Market size and forecast 2025-2030 ($ million)
Chart on US - Year-over-year growth 2025-2030 (%)
Data Table on US - Year-over-year growth 2025-2030 (%)

13.5.2 Canada - Market size and forecast 2025-2030

Chart on Canada - Market size and forecast 2025-2030 ($ million)
Data Table on Canada - Market size and forecast 2025-2030 ($ million)
Chart on Canada - Year-over-year growth 2025-2030 (%)
Data Table on Canada - Year-over-year growth 2025-2030 (%)

13.5.3 Mexico - Market size and forecast 2025-2030

Chart on Mexico - Market size and forecast 2025-2030 ($ million)
Data Table on Mexico - Market size and forecast 2025-2030 ($ million)
Chart on Mexico - Year-over-year growth 2025-2030 (%)
Data Table on Mexico - Year-over-year growth 2025-2030 (%)

13.6 South America - Market size and forecast 2025-2030

Chart on South America - Market size and forecast 2025-2030 ($ million)
Data Table on South America - Market size and forecast 2025-2030 ($ million)
Chart on South America - Year-over-year growth 2025-2030 (%)
Data Table on South America - Year-over-year growth 2025-2030 (%)
Chart on Regional Comparison - South America
Data Table on Regional Comparison - South America

13.6.1 Brazil - Market size and forecast 2025-2030

Chart on Brazil - Market size and forecast 2025-2030 ($ million)
Data Table on Brazil - Market size and forecast 2025-2030 ($ million)
Chart on Brazil - Year-over-year growth 2025-2030 (%)
Data Table on Brazil - Year-over-year growth 2025-2030 (%)

13.6.2 Argentina - Market size and forecast 2025-2030

Chart on Argentina - Market size and forecast 2025-2030 ($ million)
Data Table on Argentina - Market size and forecast 2025-2030 ($ million)
Chart on Argentina - Year-over-year growth 2025-2030 (%)
Data Table on Argentina - Year-over-year growth 2025-2030 (%)

13.6.3 Chile - Market size and forecast 2025-2030

Chart on Chile - Market size and forecast 2025-2030 ($ million)
Data Table on Chile - Market size and forecast 2025-2030 ($ million)
Chart on Chile - Year-over-year growth 2025-2030 (%)
Data Table on Chile - Year-over-year growth 2025-2030 (%)

13.7 Middle East and Africa - Market size and forecast 2025-2030

Chart on Middle East and Africa - Market size and forecast 2025-2030 ($ million)
Data Table on Middle East and Africa - Market size and forecast 2025-2030 ($ million)
Chart on Middle East and Africa - Year-over-year growth 2025-2030 (%)
Data Table on Middle East and Africa - Year-over-year growth 2025-2030 (%)
Chart on Regional Comparison - Middle East and Africa
Data Table on Regional Comparison - Middle East and Africa

13.7.1 Saudi Arabia - Market size and forecast 2025-2030

Chart on Saudi Arabia - Market size and forecast 2025-2030 ($ million)
Data Table on Saudi Arabia - Market size and forecast 2025-2030 ($ million)
Chart on Saudi Arabia - Year-over-year growth 2025-2030 (%)
Data Table on Saudi Arabia - Year-over-year growth 2025-2030 (%)

13.7.2 UAE - Market size and forecast 2025-2030

Chart on UAE - Market size and forecast 2025-2030 ($ million)
Data Table on UAE - Market size and forecast 2025-2030 ($ million)
Chart on UAE - Year-over-year growth 2025-2030 (%)
Data Table on UAE - Year-over-year growth 2025-2030 (%)

13.7.3 Turkey - Market size and forecast 2025-2030

Chart on Turkey - Market size and forecast 2025-2030 ($ million)
Data Table on Turkey - Market size and forecast 2025-2030 ($ million)
Chart on Turkey - Year-over-year growth 2025-2030 (%)
Data Table on Turkey - Year-over-year growth 2025-2030 (%)

13.7.4 South Africa - Market size and forecast 2025-2030

Chart on South Africa - Market size and forecast 2025-2030 ($ million)
Data Table on South Africa - Market size and forecast 2025-2030 ($ million)
Chart on South Africa - Year-over-year growth 2025-2030 (%)
Data Table on South Africa - Year-over-year growth 2025-2030 (%)

13.7.5 Israel - Market size and forecast 2025-2030

Chart on Israel - Market size and forecast 2025-2030 ($ million)
Data Table on Israel - Market size and forecast 2025-2030 ($ million)
Chart on Israel - Year-over-year growth 2025-2030 (%)
Data Table on Israel - Year-over-year growth 2025-2030 (%)

13.8 Market opportunity by geography

Market opportunity by geography ($ million)
Data Tables on Market opportunity by geography ($ million)

14. Drivers, Challenges, and Opportunity

14.1 Market drivers

Rise of GLP-1 companion and targeted volumizing skincare
Accelerated adoption of nanotechnology and advanced delivery systems
Surge in dermatologist-led active dermocosmetic formulations

14.2 Market challenges

Regulatory compliance and ingredient restrictions across global markets
Counterfeit products and intellectual property theft
Distribution channel cannibalization and direct-to-consumer market disruption

14.3 Impact of drivers and challenges

Impact of drivers and challenges in 2025 and 2030

14.4 Market opportunities

Integration of polynucleotide biostimulators and regenerative PDRN topicals
Surge in micro-spicule delivery systems and microneedling innovations
Expansion of targeted epigenetic microRNA regulators in rejuvenation therapies

15. Competitive Landscape

15.1 Overview

15.2

Overview on criticality of inputs and factors of differentiation

15.3 Landscape disruption

Overview on factors of disruption

15.4 Industry risks

Impact of key risks on business

16. Competitive Analysis

16.1 Companies profiled

Companies covered

16.2 Company ranking index

16.3 Market positioning of companies

Matrix on companies position and classification

16.4 ALASTIN Skincare

ALASTIN Skincare - Overview
ALASTIN Skincare - Product / Service
ALASTIN Skincare - Key offerings
SWOT

16.5 Amorepacific Corp.

Amorepacific Corp. - Overview
Amorepacific Corp. - Business segments
Amorepacific Corp. - Key offerings
Amorepacific Corp. - Segment focus
SWOT

16.6 Beiersdorf AG

Beiersdorf AG - Overview
Beiersdorf AG - Business segments
Beiersdorf AG - Key offerings
Beiersdorf AG - Segment focus
SWOT

16.7 Biologique Recherche

Biologique Recherche - Overview
Biologique Recherche - Product / Service
Biologique Recherche - Key offerings
SWOT

16.8 COSMEDIX

COSMEDIX - Overview
COSMEDIX - Product / Service
COSMEDIX - Key offerings
SWOT

16.9 Environ Skin Care

Environ Skin Care - Overview
Environ Skin Care - Product / Service
Environ Skin Care - Key offerings
SWOT

16.10 Galderma Group AG

Galderma Group AG - Overview
Galderma Group AG - Business segments
Galderma Group AG - Key offerings
Galderma Group AG - Segment focus
SWOT

16.11 Groupe Clarins

Groupe Clarins - Overview
Groupe Clarins - Product / Service
Groupe Clarins - Key offerings
SWOT

16.12 Guinot SAS

Guinot SAS - Overview
Guinot SAS - Product / Service
Guinot SAS - Key offerings
SWOT

16.13 iS Clinical

iS Clinical - Overview
iS Clinical - Product / Service
iS Clinical - Key offerings
SWOT

16.14 Kao Corp.

Kao Corp. - Overview
Kao Corp. - Business segments
Kao Corp. - Key news
Kao Corp. - Key offerings
Kao Corp. - Segment focus
SWOT

16.15 Loreal SA

Loreal SA - Overview
Loreal SA - Business segments
Loreal SA - Key offerings
Loreal SA - Segment focus
SWOT

16.16 Shiseido Co. Ltd.

Shiseido Co. Ltd. - Overview
Shiseido Co. Ltd. - Business segments
Shiseido Co. Ltd. - Key offerings
Shiseido Co. Ltd. - Segment focus
SWOT

16.17 The Estee Lauder Co. Inc.

The Estee Lauder Co. Inc. - Overview
The Estee Lauder Co. Inc. - Business segments
The Estee Lauder Co. Inc. - Key offerings
The Estee Lauder Co. Inc. - Segment focus
SWOT

16.18 Unilever PLC

Unilever PLC - Overview
Unilever PLC - Business segments
Unilever PLC - Key news
Unilever PLC - Key offerings
Unilever PLC - Segment focus
SWOT

17. Appendix

17.1 Scope of the report

Market definition
Objectives
Notes and caveats

17.2 Inclusions and exclusions checklist

Inclusions checklist
Exclusions checklist

17.3 Currency conversion rates for US$

17.4 Research methodology

17.5 Data procurement

Information sources

17.6 Data validation

17.7 Validation techniques employed for market sizing

17.8 Data synthesis

17.9 360 degree market analysis

17.10 List of abbreviations

Research Methodology

Technavio presents a detailed picture of the market by way of study, synthesis, and summation of data from multiple sources. The analysts have presented the various facets of the market with a particular focus on identifying the key industry influencers. The data thus presented is comprehensive, reliable, and the result of extensive research, both primary and secondary.

INFORMATION SOURCES

Primary sources

  • Manufacturers and suppliers
  • Channel partners
  • Industry experts
  • Strategic decision makers

Secondary sources

  • Industry journals and periodicals
  • Government data
  • Financial reports of key industry players
  • Historical data
  • Press releases

DATA ANALYSIS

Data Synthesis

  • Collation of data
  • Estimation of key figures
  • Analysis of derived insights

Data Validation

  • Triangulation with data models
  • Reference against proprietary databases
  • Corroboration with industry experts

REPORT WRITING

Qualitative

  • Market drivers
  • Market challenges
  • Market trends
  • Five forces analysis

Quantitative

  • Market size and forecast
  • Market segmentation
  • Geographical insights
  • Competitive landscape

Interested in this report?

Get your sample now to see our research methodology and insights!

Download Now

Frequently Asked Questions

Professional Skincare market growth will increase by USD 5013.4 million during 2026-2030.

The Professional Skincare market is expected to grow at a CAGR of 5.7% during 2026-2030.

Professional Skincare market is segmented by Product type (Face skincare products, Body skincare products) Distribution channel (Offline, Online) Type (Anti-aging, Anti-dehydration, Sun protection, Anti-pigmentation) Method (Conventional, Organic or natural)

ALASTIN Skincare, Amorepacific Corp., Beiersdorf AG, Biologique Recherche, COSMEDIX, Environ Skin Care, Galderma Group AG, Groupe Clarins, Guinot SAS, HydroPeptide, iS Clinical, Kao Corp., Loreal SA, Maria Galland Paris, MATIS Paris, Natura Bisse, NeoCutis, Shiseido Co. Ltd., The Estee Lauder Co. Inc., Unilever PLC are a few of the key vendors in the Professional Skincare market.

APAC will register the highest growth rate of 72.3% among the other regions. Therefore, the Professional Skincare market in APAC is expected to garner significant business opportunities for the vendors during the forecast period.

China, Japan, South Korea, India, Australia, Indonesia, Germany, UK, France, Italy, Spain, The Netherlands, US, Canada, Mexico, Brazil, Argentina, Chile, Saudi Arabia, UAE, Turkey, South Africa, Israel

  • Rise of GLP-1 companion and targeted volumizing skincare is the driving factor this market.

The Professional Skincare market vendors should focus on grabbing business opportunities from the Product type segment as it accounted for the largest market share in the base year.
RIA - Research AI Assistant
Ask RIA