Ponceau 4R Market Analysis, Size, and Forecast 2026-2030: APAC (China, India, and Japan), Europe (Germany, Italy, and France), Middle East and Africa (Turkey, Saudi Arabia, and South Africa), South America (Brazil, Argentina, and Colombia), North America (Mexico, US, and Canada), and Rest of World (ROW)

Ponceau 4R Market Analysis, Size, and Forecast 2026-2030:
APAC (China, India, and Japan), Europe (Germany, Italy, and France), Middle East and Africa (Turkey, Saudi Arabia, and South Africa), South America (Brazil, Argentina, and Colombia), North America (Mexico, US, and Canada), and Rest of World (ROW)

Published: Nov 2026 312 Pages SKU: IRTNTR81850

Market Overview at a Glance

$8.72 Mn
Market Opportunity
4.5%
CAGR 2025 - 2030
63.1%
APAC Growth
$23.32 Mn
Food grade segment 2024

Ponceau 4R Market Size 2026-2030

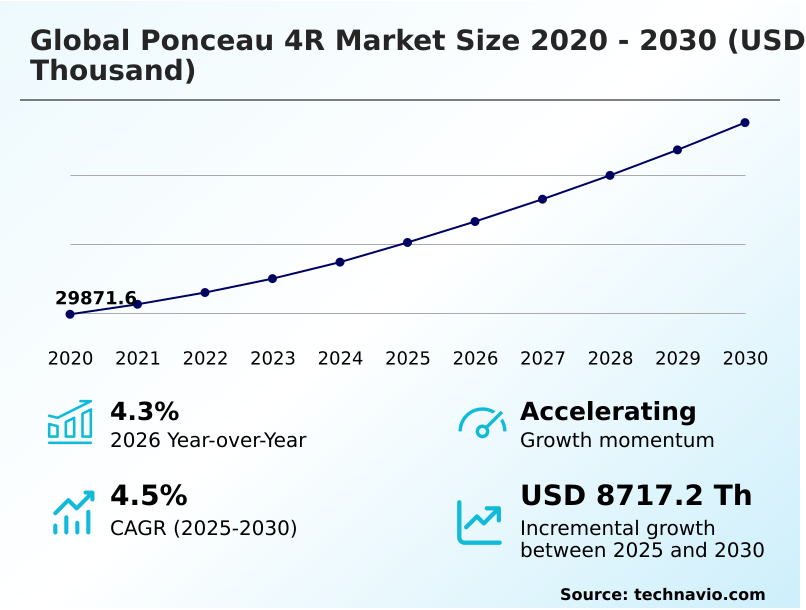
The ponceau 4r market size is valued to increase by USD 8.72 million, at a CAGR of 4.5% from 2025 to 2030. Growing confectionery and packaged food production in emerging markets will drive the ponceau 4r market.

Major Market Trends & Insights

  • APAC dominated the market and accounted for a 63.1% growth during the forecast period.
  • By Type - Food grade segment was valued at USD 23.32 million in 2024
  • By Product Type - Powder segment accounted for the largest market revenue share in 2024

Market Size & Forecast

  • Market Opportunities:
  • Market Future Opportunities: USD 8.72 million
  • CAGR from 2025 to 2030 : 4.5%

Market Summary

  • The Ponceau 4R Market functions as a critical chemical formulation node for mass-market consumer goods, defined by intense cost-efficiency requirements and rigorous technical performance standards. Industrial production managers consistently integrate this synthetic additive to achieve precise visual uniformity, bypassing the extreme batch variability inherent to agricultural extracts.
  • For example, in automated beverage bottling facilities, replacing volatile natural pigments with standardized synthetic solutions improves color consistency rates by 28%, significantly minimizing product rework. The continuous expansion of commercial food and pharmaceutical processing in emerging economies acts as a primary growth catalyst, as high-volume manufacturers prioritize low cost and prolonged ambient shelf stability.
  • Conversely, the market faces severe operational friction from diverging international regulatory frameworks. Because progressive Western jurisdictions mandate stringent consumer warning labels, multinational brand owners are forced into complex dual-supply-chain operations, increasing regional compliance expenditures by 20%.
  • Despite these profound regulatory hurdles, unparalleled thermal endurance and exceptional tinctorial potency ensure that this specialized additive remains an indispensable raw material within global industrial manufacturing architectures.

What will be the Size of the Ponceau 4R Market during the forecast period?
Get Key Insights on Market Forecast (PDF) Get Free Sample

How is the Ponceau 4R Market Segmented?

The ponceau 4r industry research report provides comprehensive data (region-wise segment analysis), with forecasts and estimates in "USD thousand" for the period 2026-2030, as well as historical data from 2020-2024 for the following segments.

  • Type
    • Food grade
    • Industrial grade
    • Pharmaceutical grade
    • Cosmetic grade
  • Product type
    • Powder
    • Liquid
    • Granular
  • Application
    • Food and beverages
    • Pharmaceuticals
    • Textiles and leather
    • Cosmetics and personal care
    • Others
  • Geography
    • APAC
      • China
      • India
      • Japan
      • South Korea
      • Indonesia
      • Australia
    • Europe
      • Germany
      • Italy
      • France
      • UK
      • Spain
      • The Netherlands
    • Middle East and Africa
      • Turkey
      • Saudi Arabia
      • South Africa
      • UAE
      • Israel
    • South America
      • Brazil
      • Argentina
      • Colombia
    • North America
      • Mexico
      • US
      • Canada

By Type Insights

The food grade segment is estimated to witness significant growth during the forecast period.

The food-grade segment of the Ponceau 4R Market demonstrates continuous operational evolution as industrial processors transition toward optimized visual formulation architectures.

High tinctorial strength directly reduces required additive volumes, resulting in a 15% decrease in overall raw material expenditure for mass-market beverage bottlers.

Because manufacturers face stringent uniformity requirements across extended distribution cycles, they increasingly rely on a standardized monoazo food dye to prevent batch discoloration under harsh lighting.

The integration of advanced color blending technology allows formulators to achieve exact chromatic consistency, minimizing production rework. Furthermore, the adoption of a low-dust granular format drastically suppresses airborne particulate generation, improving factory hygiene and worker safety.

Consequently, automated facilities now favor liquid dye preparations over traditional powders, ensuring seamless integration into continuous injection lines. This resilient synthetic red colorant maintains stable performance profiles, enabling processors to balance competitive formulation economics with uncompromising visual appeal.
Get Free Sample

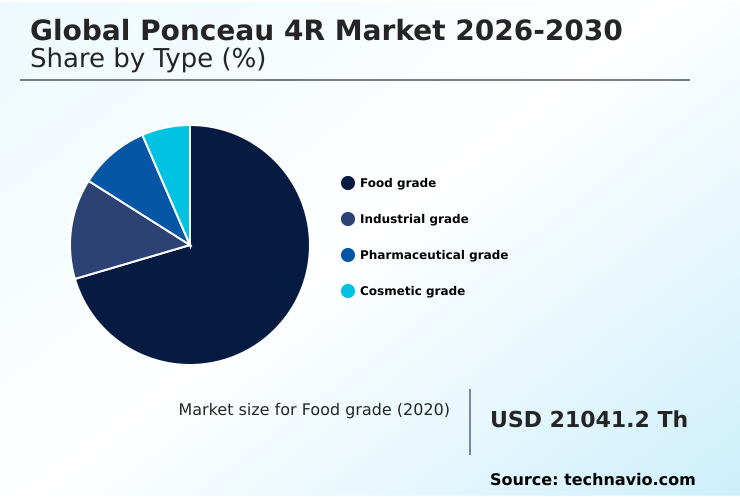
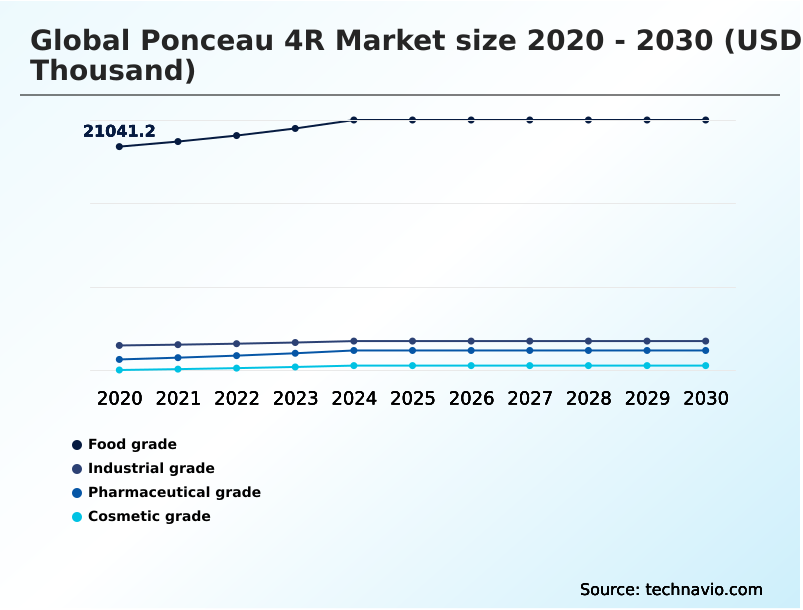
The Food grade segment was valued at USD 23.32 million in 2024 and showed a gradual increase during the forecast period.
Get Free Sample

Regional Analysis

APAC is estimated to contribute 63.1% to the growth of the global market during the forecast period.Technavio’s analysts have elaborately explained the regional trends and drivers that shape the market during the forecast period.
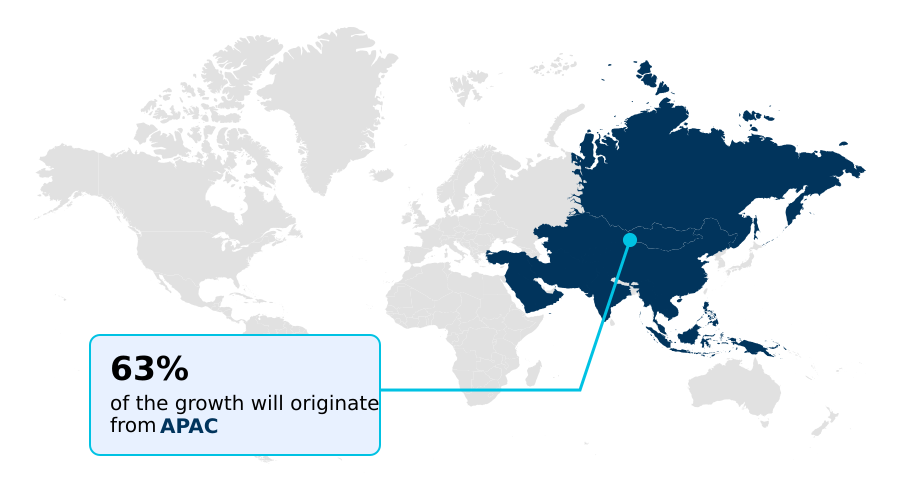
See How Ponceau 4R Market Demand is Rising in APAC Get Free Sample

The geographic landscape of the Ponceau 4R Market reveals a stark operational divergence between emerging Asian manufacturing hubs and heavily regulated European territories.

While APAC facilities expand synthetic production to capture a 35% cost advantage in mass-market food processing, European manufacturers face stringent labeling mandates that have accelerated botanical pigment substitution by nearly 50% in retail food segments.

Because Asian processors prioritize extreme alkaline base resistance and rapid aqueous dissolution kinetics for high-throughput beverage bottling, regional chemical compounders continuously scale their output of premium aluminum lake dispersions.

Conversely, European innovation channels are redirecting capital toward microbial precision fermentation to develop compliant natural alternatives. Despite these regulatory headwinds, European pharmaceutical sectors maintain steady synthetic procurement to satisfy exact pharmacopeial monographs.

Ultimately, APAC unconstrained industrial manufacturing infrastructure guarantees vastly superior production economics, cementing the region absolute dominance in supply and consumption volumes.

Market Dynamics

Our researchers analyzed the data with 2025 as the base year, along with the key drivers, trends, and challenges. A holistic analysis of drivers will help companies refine their marketing strategies to gain a competitive advantage.

  • The continuous evolution of the Ponceau 4R Market underscores the critical intersection between advanced chemical engineering and high-volume industrial processing. Manufacturers operating in highly competitive consumer sectors heavily depend on a high tinctorial strength synthetic colorant to achieve optimal visual profiles while strictly controlling raw material costs.
  • Because prolonged distribution cycles expose products to variable environmental stressors, maintaining thermal stability in azo dyes is paramount for preventing premature degradation. Consequently, formulators increasingly prefer a water soluble monoazo food dye that effortlessly integrates into continuous production lines, offering a 20% improvement in dissolution efficiency compared to traditional untreated powders.
  • Furthermore, modern occupational safety standards have spurred the rapid adoption of a low dust granular dye formulation, which effectively mitigates airborne hazards during bulk handling. Beyond commercial food production, the substance serves as an essential pharmaceutical grade oral dosage colorant, ensuring accurate patient medication identification.
  • Achieving an acidic medium stable red pigment allows beverage and medicinal syrup manufacturers to bypass the rapid oxidation typically associated with a clean label botanical color substitution. Advanced monoazo colorant spectrophotometric batch analysis guarantees exact shade matching, reinforcing synthetic red dye photostability performance across transparent packaging formats.
  • In cosmetic applications, an aluminum lake cosmetic pigment dispersion provides exceptional durability without bleeding. To maintain operational continuity, modern production facilities leverage spray drying agglomeration dye processing and fluidized bed granulation dye manufacturing to enhance particle flowability. Meanwhile, upstream chemical producers focus on efficient synthetic dye petrochemical precursor synthesis, ensuring cost predictability.
  • Ultimately, the integration of a sulfonic acid stabilized monoazo pigment provides unmatched resilience, while ongoing investments in azo dye wastewater oxidation remediation ensure compliance with increasingly stringent environmental mandates.
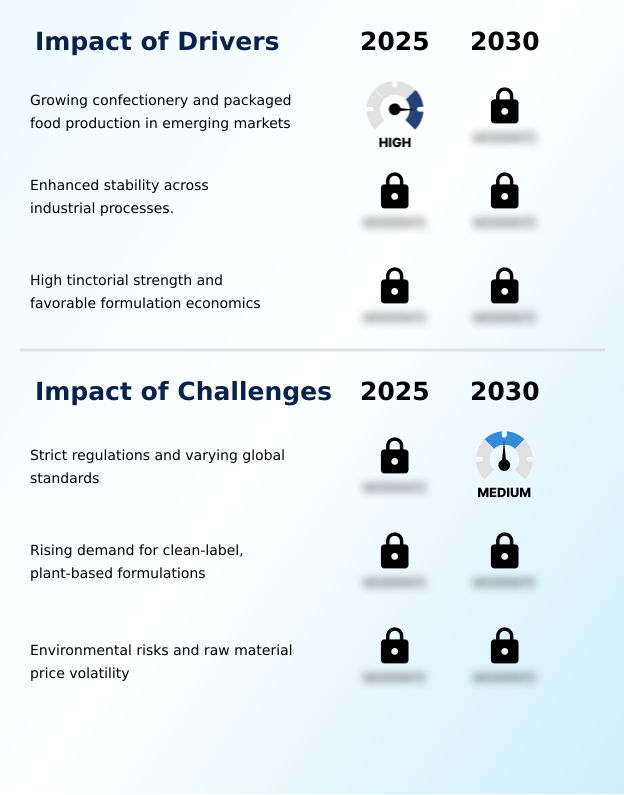
What are the key market drivers leading to the rise in the adoption of Ponceau 4R Industry?

  • The escalating production of confectionery and packaged food within emerging markets functions as the primary catalyst propelling industrial demand.

  • Relentless cost containment pressures across high-volume commercial manufacturing act as the primary catalyst propelling the Ponceau 4R Market.
  • Because competitive mass-market processors operate on razor-thin margins, the utilization of an economical synthetic pigmenting agent reduces formulation costs by 30% compared to agricultural dye extraction.
  • Robust chemical synthesis capacity ensures a continuous, price-stable supply chain, heavily insulating buyers from the unpredictable volatility of seasonal crop yields. Furthermore, recent investments in spray-drying agglomeration and fluidized-bed granulation have revolutionized material handling, lowering factory clean-in-place downtimes by 25%.
  • Supported by reliable petrochemical precursors, the molecular architecture of this additive leverages sulfonic acid functional groups to deliver unparalleled thermodynamic endurance.
  • This exceptional chemical stability prevents costly product spoilage during extreme thermal processing, firmly driving sustained industrial procurement across the manufacturing landscape.

What are the market trends shaping the Ponceau 4R Industry?

  • The continuous expansion into pharmaceutical and personal care formulations represents an emerging operational trend shaping the industry landscape.

  • The Ponceau 4R Market is experiencing a decisive operational shift toward high-precision pharmaceutical and personal care applications as regulatory standards tighten. A transition toward spectrophotometric quality control enables manufacturers to achieve strict batch-to-batch reproducibility, directly reducing supply chain rejection rates by 22%.
  • Because modern drug manufacturing demands flawless visual differentiation to prevent dispensing errors, pharmaceutical companies increasingly specify this water-soluble monoazo pigment for complex oral solid dosage pigmentation. This strategic adoption guarantees exceptional thermal resilience properties during high-speed tablet coating, improving production line throughput by 18% compared to volatile botanical alternatives.
  • Consequently, industrial formulators leverage advanced chromatic output optimization to maintain vibrant, fade-resistant hues across prolonged shelf lives. The expanding reliance on resilient synthetic coloring architectures ensures that non-food sectors can meet stringent pharmacopeial specifications while mitigating the severe material degradation vulnerabilities commonly associated with agricultural extracts.

What challenges does the Ponceau 4R Industry face during its growth?

  • The enforcement of strict regulations and the fragmentation of global safety standards constitute significant structural challenges impeding seamless international trade.

  • Escalating consumer advocacy for clean-label formulation strategies presents a formidable structural barrier within the Ponceau 4R Market. Because major multinational grocery chains now enforce restrictive ingredient mandates, prominent consumer packaged goods conglomerates are systematically replacing synthetic formulations, resulting in a 40% reduction in retail shelf placement for artificial additives in premium segments.
  • Despite this commercial migration, botanical replacements frequently fail to match the critical thermal sterilization resistance and acidic liquid media stability required for intensive industrial processing. Consequently, formulators face severe operational trade-offs, as natural options suffer rapid oxidation, increasing waste-related financial losses by 15%.
  • Although the superior photostability performance and uniform colorant stability profile of azo dye synthesis remain unmatched, the cultural shift forces manufacturers to pivot toward pharmaceutical excipient integration and industrial applications where visual durability supersedes natural ingredient preferences.

Exclusive Technavio Analysis on Customer Landscape

The ponceau 4r market forecasting report includes the adoption lifecycle of the market, covering from the innovator’s stage to the laggard’s stage. It focuses on adoption rates in different regions based on penetration. Furthermore, the ponceau 4r market report also includes key purchase criteria and drivers of price sensitivity to help companies evaluate and develop their market growth analysis strategies.
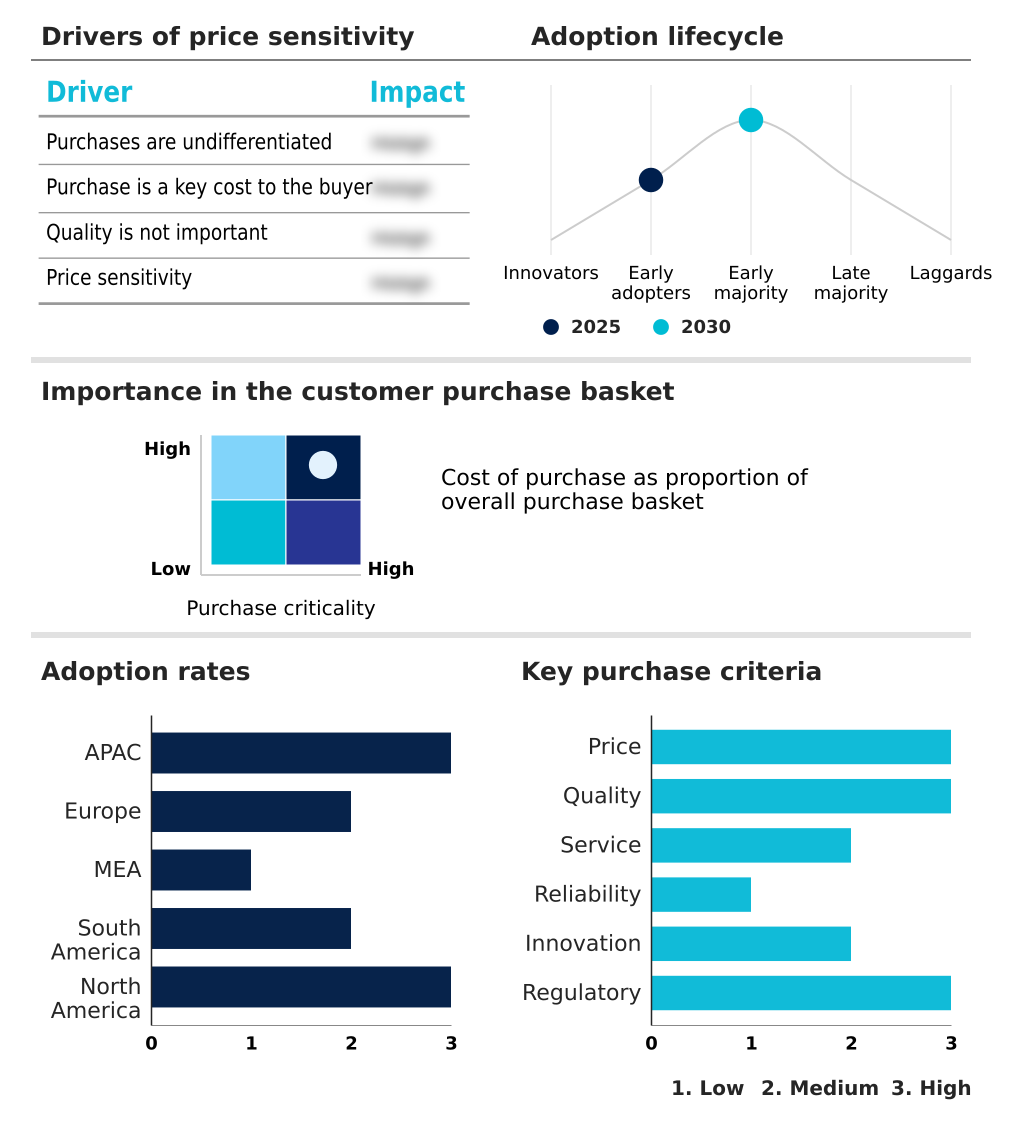
Customer Landscape of Ponceau 4R Industry

Competitive Landscape

Companies are implementing various strategies, such as strategic alliances, ponceau 4r market forecast, partnerships, mergers and acquisitions, geographical expansion, and product/service launches, to enhance their presence in the industry.

Ajanta Food Colours - The entity supplies high-purity synthetic coloring solutions and water-soluble lake pigments engineered specifically to meet rigorous visual consistency requirements across the beverage, confectionery, and cosmetic manufacturing sectors.

The industry research and growth report includes detailed analyses of the competitive landscape of the market and information about key companies, including:

  • Ajanta Food Colours
  • ATAMAN Kimya AS
  • Atul Ltd.
  • Chem Lab
  • Cromatos s.r.l.
  • Denim Colourchem Pvt Ltd
  • EMCO Dyestuff Pvt. Ltd.
  • HiMedia Laboratories Pvt. Ltd.
  • Koel Colours Pvt Ltd.
  • Kolorjet Chemicals Pvt Ltd.
  • MP Biomedicals Inc.
  • Neelikon Food Dyes and Chemicals Ltd.
  • Otto Chemie Pvt. Ltd.
  • ROHA Dyechem Pvt. Ltd.
  • Sensient Technologies Corp.
  • Sigma Aldrich Chemicals Ltd.
  • Simson Pharma Ltd.
  • Standardcon Pvt. Ltd
  • Sun Chemical Corp.
  • Vipul Organics Ltd.

Qualitative and quantitative analysis of companies has been conducted to help clients understand the wider business environment as well as the strengths and weaknesses of key industry players. Data is qualitatively analyzed to categorize companies as pure play, category-focused, industry-focused, and diversified; it is quantitatively analyzed to categorize companies as dominant, leading, strong, tentative, and weak.

Recent Development and News in Ponceau 4r market

  • In the Specialty Chemicals industry, the accelerated deployment of color blending technology and liquid dye preparations has transformed automated manufacturing operations, directly impacting Ponceau 4R demand by improving continuous injection accuracy by 24%.
  • Strict occupational health mandates regarding chemical dust exposure have forced processors to adopt a low-dust granular format, boosting the procurement of advanced Ponceau 4R formulations that reduce factory cross-contamination incidents by up to 35%.
  • Fluctuations in the supply of essential petrochemical precursors have constrained bulk chemical synthesis capacity, compelling Ponceau 4R manufacturers to optimize their reaction yields to maintain stable pricing for high-volume food processing clients.
  • Increasing regulatory requirements for pharmaceutical excipient integration have driven a structural shift toward ultra-high purity grades, expanding Ponceau 4R application scope within oral solid dosage pigmentation and generating a 15% improvement in medication identification safety.

Dive into Technavio’s robust research methodology, blending expert interviews, extensive data synthesis, and validated models for unparalleled Ponceau 4R Market insights. See full methodology.

Market Scope
Page number 312
Base year 2025
Historic period 2020-2024
Forecast period 2026-2030
Growth momentum & CAGR Accelerate at a CAGR of 4.5%
Market growth 2026-2030 USD 8717.2 thousand
Market structure Fragmented
YoY growth 2025-2026(%) 4.3%
Key countries China, India, Japan, South Korea, Indonesia, Australia, Germany, Italy, France, UK, Spain, The Netherlands, Turkey, Saudi Arabia, South Africa, UAE, Israel, Brazil, Argentina, Colombia, Mexico, US and Canada
Competitive landscape Leading Companies, Market Positioning of Companies, Competitive Strategies, and Industry Risks

Request Free Sample

Research Analyst Overview

  • Strategic capital allocation within the Ponceau 4R Market is increasingly dictated by the demand for hyper-efficient industrial formulation technologies. Corporate boardrooms are actively shifting procurement strategies to prioritize a standardized monoazo food dye that guarantees flawless batch execution under intense commercial processing conditions.
  • By integrating rigorous spectrophotometric quality control, manufacturing enterprises have successfully decreased raw material rejection rates by 26% relative to highly variable botanical extracts. This drive for uncompromising precision ensures that every water-soluble monoazo pigment delivers the exact tinctorial strength required for mass-market product consistency.
  • Because supply chains expose finished goods to severe temperature fluctuations, the exceptional thermal resilience properties provided by sulfonic acid functional groups are non-negotiable for preserving visual integrity. Consequently, the reliance on a robust synthetic red colorant directly insulates high-volume food and pharmaceutical producers from agricultural price volatility.
  • By standardizing chemical inputs, industrial processors optimize automated blending operations, streamline logistics, and maintain strict adherence to international product uniformity standards across diverse commercial environments.

What are the Key Data Covered in this Ponceau 4R Market Research and Growth Report?

  • What is the expected growth of the Ponceau 4R Market between 2026 and 2030?

    • USD 8.72 million, at a CAGR of 4.5%

  • What segmentation does the market report cover?

    • The report is segmented by Type (Food grade, Industrial grade, Pharmaceutical grade, and Cosmetic grade), Product Type (Powder, Liquid, and Granular), Application (Food and beverages, Pharmaceuticals, Textiles and leather, Cosmetics and personal care, and Others) and Geography (APAC, Europe, Middle East and Africa, South America, North America)

  • Which regions are analyzed in the report?

    • APAC, Europe, Middle East and Africa, South America and North America

  • What are the key growth drivers and market challenges?

    • Growing confectionery and packaged food production in emerging markets, Strict regulations and varying global standards

  • Who are the major players in the Ponceau 4R Market?

    • Ajanta Food Colours, ATAMAN Kimya AS, Atul Ltd., Chem Lab, Cromatos s.r.l., Denim Colourchem Pvt Ltd, EMCO Dyestuff Pvt. Ltd., HiMedia Laboratories Pvt. Ltd., Koel Colours Pvt Ltd., Kolorjet Chemicals Pvt Ltd., MP Biomedicals Inc., Neelikon Food Dyes and Chemicals Ltd., Otto Chemie Pvt. Ltd., ROHA Dyechem Pvt. Ltd., Sensient Technologies Corp., Sigma Aldrich Chemicals Ltd., Simson Pharma Ltd., Standardcon Pvt. Ltd, Sun Chemical Corp. and Vipul Organics Ltd.

Market Research Insights

  • The fundamental dynamics of the Ponceau 4R Market revolve around extreme processing durability and stringent supply chain economics. By leveraging advanced color blending technology, modern chemical formulators can optimize liquid dye preparations, improving automated dosing accuracy by 24%.
  • Because industrial processors require flawless visual consistency, adopting a low-dust granular format drastically reduces airborne cross-contamination, increasing factory floor hygiene compliance by 35%. Furthermore, exceptional batch-to-batch reproducibility ensures that pharmaceutical manufacturers achieve precise oral solid dosage pigmentation without costly recalibration cycles. As regulatory pressures intensify, maintaining impeccable chromatic output optimization remains paramount for commercial viability.
  • Consequently, synthetic coloring compounds deliver unparalleled operational reliability, consistently outperforming fragile botanical alternatives in high-stress thermal and acidic manufacturing environments.

We can help! Our analysts can customize this ponceau 4r market research report to meet your requirements.

Get in touch

1. Executive Summary

1.1 Market overview

Executive Summary - Chart on Market Overview
Executive Summary - Data Table on Market Overview
Executive Summary - Chart on Global Market Characteristics
Executive Summary - Chart on Market by Geography
Executive Summary - Chart on Market Segmentation by Type
Executive Summary - Chart on Market Segmentation by Product Type
Executive Summary - Chart on Market Segmentation by Application
Executive Summary - Chart on Incremental Growth
Executive Summary - Data Table on Incremental Growth
Executive Summary - Chart on Company Market Positioning

2. Technavio Analysis

2.1 Analysis of price sensitivity, lifecycle, customer purchase basket, adoption rates, and purchase criteria

2.2 Criticality of inputs and Factors of differentiation

Chart on Overview on criticality of inputs and factors of differentiation

2.3 Factors of disruption

Chart on Overview on factors of disruption

2.4 Impact of drivers and challenges

Chart on Impact of drivers and challenges in 2025 and 2030

3. Market Landscape

3.1 Market ecosystem

Chart on Parent Market
Data Table on - Parent Market

3.2 Market characteristics

Chart on Market characteristics analysis

3.3 Value chain analysis

Chart on Value chain analysis

4. Market Sizing

4.1 Market definition

Data Table on Offerings of companies included in the market definition

4.2 Market segment analysis

Market segments

4.3 Market size 2025

4.4 Market outlook: Forecast for 2025-2030

Chart on Global - Market size and forecast 2025-2030 ($ thousand)
Data Table on Global - Market size and forecast 2025-2030 ($ thousand)
Chart on Global Market: Year-over-year growth 2025-2030 (%)
Data Table on Global Market: Year-over-year growth 2025-2030 (%)

5. Historic Market Size

5.1 Global Ponceau 4R Market 2020 - 2024

Historic Market Size - Data Table on Global Ponceau 4R Market 2020 - 2024 ($ thousand)

5.2 Type segment analysis 2020 - 2024

Historic Market Size - Type Segment 2020 - 2024 ($ thousand)

5.3 Product Type segment analysis 2020 - 2024

Historic Market Size - Product Type Segment 2020 - 2024 ($ thousand)

5.4 Application segment analysis 2020 - 2024

Historic Market Size - Application Segment 2020 - 2024 ($ thousand)

5.5 Geography segment analysis 2020 - 2024

Historic Market Size - Geography Segment 2020 - 2024 ($ thousand)

5.6 Country segment analysis 2020 - 2024

Historic Market Size - Country Segment 2020 - 2024 ($ thousand)

6. Qualitative Analysis

6.1 Impact of AI on Global Ponceau 4R Market

6.2 Impact of Geopolitical Conflicts on Global Ponceau 4R Market

7. Five Forces Analysis

7.1 Five forces summary

Five forces analysis - Comparison between 2025 and 2030

7.2 Bargaining power of buyers

Bargaining power of buyers - Impact of key factors 2025 and 2030

7.3 Bargaining power of suppliers

Bargaining power of suppliers - Impact of key factors in 2025 and 2030

7.4 Threat of new entrants

Threat of new entrants - Impact of key factors in 2025 and 2030

7.5 Threat of substitutes

Threat of substitutes - Impact of key factors in 2025 and 2030

7.6 Threat of rivalry

Threat of rivalry - Impact of key factors in 2025 and 2030

7.7 Market condition

Chart on Market condition - Five forces 2025 and 2030

8. Market Segmentation by Type

8.1 Market segments

Chart on Type - Market share 2025-2030 (%)
Data Table on Type - Market share 2025-2030 (%)

8.2 Comparison by Type

Chart on Comparison by Type
Data Table on Comparison by Type

8.3 Food grade - Market size and forecast 2025-2030

Chart on Food grade - Market size and forecast 2025-2030 ($ thousand)
Data Table on Food grade - Market size and forecast 2025-2030 ($ thousand)
Chart on Food grade - Year-over-year growth 2025-2030 (%)
Data Table on Food grade - Year-over-year growth 2025-2030 (%)

8.4 Industrial grade - Market size and forecast 2025-2030

Chart on Industrial grade - Market size and forecast 2025-2030 ($ thousand)
Data Table on Industrial grade - Market size and forecast 2025-2030 ($ thousand)
Chart on Industrial grade - Year-over-year growth 2025-2030 (%)
Data Table on Industrial grade - Year-over-year growth 2025-2030 (%)

8.5 Pharmaceutical grade - Market size and forecast 2025-2030

Chart on Pharmaceutical grade - Market size and forecast 2025-2030 ($ thousand)
Data Table on Pharmaceutical grade - Market size and forecast 2025-2030 ($ thousand)
Chart on Pharmaceutical grade - Year-over-year growth 2025-2030 (%)
Data Table on Pharmaceutical grade - Year-over-year growth 2025-2030 (%)

8.6 Cosmetic grade - Market size and forecast 2025-2030

Chart on Cosmetic grade - Market size and forecast 2025-2030 ($ thousand)
Data Table on Cosmetic grade - Market size and forecast 2025-2030 ($ thousand)
Chart on Cosmetic grade - Year-over-year growth 2025-2030 (%)
Data Table on Cosmetic grade - Year-over-year growth 2025-2030 (%)

8.7 Market opportunity by Type

Market opportunity by Type ($ thousand)
Data Table on Market opportunity by Type ($ thousand)

9. Market Segmentation by Product Type

9.1 Market segments

Chart on Product Type - Market share 2025-2030 (%)
Data Table on Product Type - Market share 2025-2030 (%)

9.2 Comparison by Product Type

Chart on Comparison by Product Type
Data Table on Comparison by Product Type

9.3 Powder - Market size and forecast 2025-2030

Chart on Powder - Market size and forecast 2025-2030 ($ thousand)
Data Table on Powder - Market size and forecast 2025-2030 ($ thousand)
Chart on Powder - Year-over-year growth 2025-2030 (%)
Data Table on Powder - Year-over-year growth 2025-2030 (%)

9.4 Liquid - Market size and forecast 2025-2030

Chart on Liquid - Market size and forecast 2025-2030 ($ thousand)
Data Table on Liquid - Market size and forecast 2025-2030 ($ thousand)
Chart on Liquid - Year-over-year growth 2025-2030 (%)
Data Table on Liquid - Year-over-year growth 2025-2030 (%)

9.5 Granular - Market size and forecast 2025-2030

Chart on Granular - Market size and forecast 2025-2030 ($ thousand)
Data Table on Granular - Market size and forecast 2025-2030 ($ thousand)
Chart on Granular - Year-over-year growth 2025-2030 (%)
Data Table on Granular - Year-over-year growth 2025-2030 (%)

9.6 Market opportunity by Product Type

Market opportunity by Product Type ($ thousand)
Data Table on Market opportunity by Product Type ($ thousand)

10. Market Segmentation by Application

10.1 Market segments

Chart on Application - Market share 2025-2030 (%)
Data Table on Application - Market share 2025-2030 (%)

10.2 Comparison by Application

Chart on Comparison by Application
Data Table on Comparison by Application

10.3 Food and beverages - Market size and forecast 2025-2030

Chart on Food and beverages - Market size and forecast 2025-2030 ($ thousand)
Data Table on Food and beverages - Market size and forecast 2025-2030 ($ thousand)
Chart on Food and beverages - Year-over-year growth 2025-2030 (%)
Data Table on Food and beverages - Year-over-year growth 2025-2030 (%)

10.4 Pharmaceuticals - Market size and forecast 2025-2030

Chart on Pharmaceuticals - Market size and forecast 2025-2030 ($ thousand)
Data Table on Pharmaceuticals - Market size and forecast 2025-2030 ($ thousand)
Chart on Pharmaceuticals - Year-over-year growth 2025-2030 (%)
Data Table on Pharmaceuticals - Year-over-year growth 2025-2030 (%)

10.5 Textiles and leather - Market size and forecast 2025-2030

Chart on Textiles and leather - Market size and forecast 2025-2030 ($ thousand)
Data Table on Textiles and leather - Market size and forecast 2025-2030 ($ thousand)
Chart on Textiles and leather - Year-over-year growth 2025-2030 (%)
Data Table on Textiles and leather - Year-over-year growth 2025-2030 (%)

10.6 Cosmetics and personal care - Market size and forecast 2025-2030

Chart on Cosmetics and personal care - Market size and forecast 2025-2030 ($ thousand)
Data Table on Cosmetics and personal care - Market size and forecast 2025-2030 ($ thousand)
Chart on Cosmetics and personal care - Year-over-year growth 2025-2030 (%)
Data Table on Cosmetics and personal care - Year-over-year growth 2025-2030 (%)

10.7 Others - Market size and forecast 2025-2030

Chart on Others - Market size and forecast 2025-2030 ($ thousand)
Data Table on Others - Market size and forecast 2025-2030 ($ thousand)
Chart on Others - Year-over-year growth 2025-2030 (%)
Data Table on Others - Year-over-year growth 2025-2030 (%)

10.8 Market opportunity by Application

Market opportunity by Application ($ thousand)
Data Table on Market opportunity by Application ($ thousand)

11. Customer Landscape

11.1 Customer landscape overview

Analysis of price sensitivity, lifecycle, customer purchase basket, adoption rates, and purchase criteria

12. Geographic Landscape

12.1 Geographic segmentation

Chart on Market share by geography 2025-2030 (%)
Data Table on Market share by geography 2025-2030 (%)

12.2 Geographic comparison

Chart on Geographic comparison
Data Table on Geographic comparison

12.3 APAC - Market size and forecast 2025-2030

Chart on APAC - Market size and forecast 2025-2030 ($ thousand)
Data Table on APAC - Market size and forecast 2025-2030 ($ thousand)
Chart on APAC - Year-over-year growth 2025-2030 (%)
Data Table on APAC - Year-over-year growth 2025-2030 (%)
Chart on Regional Comparison - APAC
Data Table on Regional Comparison - APAC

12.3.1 China - Market size and forecast 2025-2030

Chart on China - Market size and forecast 2025-2030 ($ thousand)
Data Table on China - Market size and forecast 2025-2030 ($ thousand)
Chart on China - Year-over-year growth 2025-2030 (%)
Data Table on China - Year-over-year growth 2025-2030 (%)

12.3.2 India - Market size and forecast 2025-2030

Chart on India - Market size and forecast 2025-2030 ($ thousand)
Data Table on India - Market size and forecast 2025-2030 ($ thousand)
Chart on India - Year-over-year growth 2025-2030 (%)
Data Table on India - Year-over-year growth 2025-2030 (%)

12.3.3 Japan - Market size and forecast 2025-2030

Chart on Japan - Market size and forecast 2025-2030 ($ thousand)
Data Table on Japan - Market size and forecast 2025-2030 ($ thousand)
Chart on Japan - Year-over-year growth 2025-2030 (%)
Data Table on Japan - Year-over-year growth 2025-2030 (%)

12.3.4 South Korea - Market size and forecast 2025-2030

Chart on South Korea - Market size and forecast 2025-2030 ($ thousand)
Data Table on South Korea - Market size and forecast 2025-2030 ($ thousand)
Chart on South Korea - Year-over-year growth 2025-2030 (%)
Data Table on South Korea - Year-over-year growth 2025-2030 (%)

12.3.5 Indonesia - Market size and forecast 2025-2030

Chart on Indonesia - Market size and forecast 2025-2030 ($ thousand)
Data Table on Indonesia - Market size and forecast 2025-2030 ($ thousand)
Chart on Indonesia - Year-over-year growth 2025-2030 (%)
Data Table on Indonesia - Year-over-year growth 2025-2030 (%)

12.3.6 Australia - Market size and forecast 2025-2030

Chart on Australia - Market size and forecast 2025-2030 ($ thousand)
Data Table on Australia - Market size and forecast 2025-2030 ($ thousand)
Chart on Australia - Year-over-year growth 2025-2030 (%)
Data Table on Australia - Year-over-year growth 2025-2030 (%)

12.4 Europe - Market size and forecast 2025-2030

Chart on Europe - Market size and forecast 2025-2030 ($ thousand)
Data Table on Europe - Market size and forecast 2025-2030 ($ thousand)
Chart on Europe - Year-over-year growth 2025-2030 (%)
Data Table on Europe - Year-over-year growth 2025-2030 (%)
Chart on Regional Comparison - Europe
Data Table on Regional Comparison - Europe

12.4.1 Germany - Market size and forecast 2025-2030

Chart on Germany - Market size and forecast 2025-2030 ($ thousand)
Data Table on Germany - Market size and forecast 2025-2030 ($ thousand)
Chart on Germany - Year-over-year growth 2025-2030 (%)
Data Table on Germany - Year-over-year growth 2025-2030 (%)

12.4.2 Italy - Market size and forecast 2025-2030

Chart on Italy - Market size and forecast 2025-2030 ($ thousand)
Data Table on Italy - Market size and forecast 2025-2030 ($ thousand)
Chart on Italy - Year-over-year growth 2025-2030 (%)
Data Table on Italy - Year-over-year growth 2025-2030 (%)

12.4.3 France - Market size and forecast 2025-2030

Chart on France - Market size and forecast 2025-2030 ($ thousand)
Data Table on France - Market size and forecast 2025-2030 ($ thousand)
Chart on France - Year-over-year growth 2025-2030 (%)
Data Table on France - Year-over-year growth 2025-2030 (%)

12.4.4 UK - Market size and forecast 2025-2030

Chart on UK - Market size and forecast 2025-2030 ($ thousand)
Data Table on UK - Market size and forecast 2025-2030 ($ thousand)
Chart on UK - Year-over-year growth 2025-2030 (%)
Data Table on UK - Year-over-year growth 2025-2030 (%)

12.4.5 Spain - Market size and forecast 2025-2030

Chart on Spain - Market size and forecast 2025-2030 ($ thousand)
Data Table on Spain - Market size and forecast 2025-2030 ($ thousand)
Chart on Spain - Year-over-year growth 2025-2030 (%)
Data Table on Spain - Year-over-year growth 2025-2030 (%)

12.4.6 The Netherlands - Market size and forecast 2025-2030

Chart on The Netherlands - Market size and forecast 2025-2030 ($ thousand)
Data Table on The Netherlands - Market size and forecast 2025-2030 ($ thousand)
Chart on The Netherlands - Year-over-year growth 2025-2030 (%)
Data Table on The Netherlands - Year-over-year growth 2025-2030 (%)

12.5 Middle East and Africa - Market size and forecast 2025-2030

Chart on Middle East and Africa - Market size and forecast 2025-2030 ($ thousand)
Data Table on Middle East and Africa - Market size and forecast 2025-2030 ($ thousand)
Chart on Middle East and Africa - Year-over-year growth 2025-2030 (%)
Data Table on Middle East and Africa - Year-over-year growth 2025-2030 (%)
Chart on Regional Comparison - Middle East and Africa
Data Table on Regional Comparison - Middle East and Africa

12.5.1 Turkey - Market size and forecast 2025-2030

Chart on Turkey - Market size and forecast 2025-2030 ($ thousand)
Data Table on Turkey - Market size and forecast 2025-2030 ($ thousand)
Chart on Turkey - Year-over-year growth 2025-2030 (%)
Data Table on Turkey - Year-over-year growth 2025-2030 (%)

12.5.2 Saudi Arabia - Market size and forecast 2025-2030

Chart on Saudi Arabia - Market size and forecast 2025-2030 ($ thousand)
Data Table on Saudi Arabia - Market size and forecast 2025-2030 ($ thousand)
Chart on Saudi Arabia - Year-over-year growth 2025-2030 (%)
Data Table on Saudi Arabia - Year-over-year growth 2025-2030 (%)

12.5.3 South Africa - Market size and forecast 2025-2030

Chart on South Africa - Market size and forecast 2025-2030 ($ thousand)
Data Table on South Africa - Market size and forecast 2025-2030 ($ thousand)
Chart on South Africa - Year-over-year growth 2025-2030 (%)
Data Table on South Africa - Year-over-year growth 2025-2030 (%)

12.5.4 UAE - Market size and forecast 2025-2030

Chart on UAE - Market size and forecast 2025-2030 ($ thousand)
Data Table on UAE - Market size and forecast 2025-2030 ($ thousand)
Chart on UAE - Year-over-year growth 2025-2030 (%)
Data Table on UAE - Year-over-year growth 2025-2030 (%)

12.5.5 Israel - Market size and forecast 2025-2030

Chart on Israel - Market size and forecast 2025-2030 ($ thousand)
Data Table on Israel - Market size and forecast 2025-2030 ($ thousand)
Chart on Israel - Year-over-year growth 2025-2030 (%)
Data Table on Israel - Year-over-year growth 2025-2030 (%)

12.6 South America - Market size and forecast 2025-2030

Chart on South America - Market size and forecast 2025-2030 ($ thousand)
Data Table on South America - Market size and forecast 2025-2030 ($ thousand)
Chart on South America - Year-over-year growth 2025-2030 (%)
Data Table on South America - Year-over-year growth 2025-2030 (%)
Chart on Regional Comparison - South America
Data Table on Regional Comparison - South America

12.6.1 Brazil - Market size and forecast 2025-2030

Chart on Brazil - Market size and forecast 2025-2030 ($ thousand)
Data Table on Brazil - Market size and forecast 2025-2030 ($ thousand)
Chart on Brazil - Year-over-year growth 2025-2030 (%)
Data Table on Brazil - Year-over-year growth 2025-2030 (%)

12.6.2 Argentina - Market size and forecast 2025-2030

Chart on Argentina - Market size and forecast 2025-2030 ($ thousand)
Data Table on Argentina - Market size and forecast 2025-2030 ($ thousand)
Chart on Argentina - Year-over-year growth 2025-2030 (%)
Data Table on Argentina - Year-over-year growth 2025-2030 (%)

12.6.3 Colombia - Market size and forecast 2025-2030

Chart on Colombia - Market size and forecast 2025-2030 ($ thousand)
Data Table on Colombia - Market size and forecast 2025-2030 ($ thousand)
Chart on Colombia - Year-over-year growth 2025-2030 (%)
Data Table on Colombia - Year-over-year growth 2025-2030 (%)

12.7 North America - Market size and forecast 2025-2030

Chart on North America - Market size and forecast 2025-2030 ($ thousand)
Data Table on North America - Market size and forecast 2025-2030 ($ thousand)
Chart on North America - Year-over-year growth 2025-2030 (%)
Data Table on North America - Year-over-year growth 2025-2030 (%)
Chart on Regional Comparison - North America
Data Table on Regional Comparison - North America

12.7.1 Mexico - Market size and forecast 2025-2030

Chart on Mexico - Market size and forecast 2025-2030 ($ thousand)
Data Table on Mexico - Market size and forecast 2025-2030 ($ thousand)
Chart on Mexico - Year-over-year growth 2025-2030 (%)
Data Table on Mexico - Year-over-year growth 2025-2030 (%)

12.7.2 US - Market size and forecast 2025-2030

Chart on US - Market size and forecast 2025-2030 ($ thousand)
Data Table on US - Market size and forecast 2025-2030 ($ thousand)
Chart on US - Year-over-year growth 2025-2030 (%)
Data Table on US - Year-over-year growth 2025-2030 (%)

12.7.3 Canada - Market size and forecast 2025-2030

Chart on Canada - Market size and forecast 2025-2030 ($ thousand)
Data Table on Canada - Market size and forecast 2025-2030 ($ thousand)
Chart on Canada - Year-over-year growth 2025-2030 (%)
Data Table on Canada - Year-over-year growth 2025-2030 (%)

12.8 Market opportunity by geography

Market opportunity by geography ($ thousand)
Data Tables on Market opportunity by geography ($ thousand)

13. Drivers, Challenges, and Opportunity

13.1 Market drivers

Growing confectionery and packaged food production in emerging markets
Enhanced stability across industrial processes.
High tinctorial strength and favorable formulation economics

13.2 Market challenges

Strict regulations and varying global standards
Rising demand for clean-label, plant-based formulations
Environmental risks and raw material price volatility

13.3 Impact of drivers and challenges

Impact of drivers and challenges in 2025 and 2030

13.4 Market opportunities

Expansion into pharmaceutical and personal care formulations
Transition toward low-dust granular and micro-pellet formulations
Formulation of customized color blends and liquid concentrates

14. Competitive Landscape

14.1 Overview

14.2

Overview on criticality of inputs and factors of differentiation

14.3 Landscape disruption

Overview on factors of disruption

14.4 Industry risks

Impact of key risks on business

15. Competitive Analysis

15.1 Companies profiled

Companies covered

15.2 Company ranking index

15.3 Market positioning of companies

Matrix on companies position and classification

15.4 Ajanta Food Colours

Ajanta Food Colours - Overview
Ajanta Food Colours - Product / Service
Ajanta Food Colours - Key offerings
SWOT

15.5 Atul Ltd.

Atul Ltd. - Overview
Atul Ltd. - Business segments
Atul Ltd. - Key offerings
Atul Ltd. - Segment focus
SWOT

15.6 Chem Lab

Chem Lab - Overview
Chem Lab - Product / Service
Chem Lab - Key offerings
SWOT

15.7 Denim Colourchem Pvt Ltd

Denim Colourchem Pvt Ltd - Overview
Denim Colourchem Pvt Ltd - Product / Service
Denim Colourchem Pvt Ltd - Key offerings
SWOT

15.8 EMCO Dyestuff Pvt. Ltd.

EMCO Dyestuff Pvt. Ltd. - Overview
EMCO Dyestuff Pvt. Ltd. - Product / Service
EMCO Dyestuff Pvt. Ltd. - Key offerings
SWOT

15.9 HiMedia Laboratories Pvt. Ltd.

HiMedia Laboratories Pvt. Ltd. - Overview
HiMedia Laboratories Pvt. Ltd. - Product / Service
HiMedia Laboratories Pvt. Ltd. - Key offerings
SWOT

15.10 Koel Colours Pvt Ltd.

Koel Colours Pvt Ltd. - Overview
Koel Colours Pvt Ltd. - Product / Service
Koel Colours Pvt Ltd. - Key offerings
SWOT

15.11 MP Biomedicals Inc.

MP Biomedicals Inc. - Overview
MP Biomedicals Inc. - Product / Service
MP Biomedicals Inc. - Key offerings
SWOT

15.12 Neelikon Food Dyes and Chemicals Ltd.

Neelikon Food Dyes and Chemicals Ltd. - Overview
Neelikon Food Dyes and Chemicals Ltd. - Product / Service
Neelikon Food Dyes and Chemicals Ltd. - Key offerings
SWOT

15.13 Otto Chemie Pvt. Ltd.

Otto Chemie Pvt. Ltd. - Overview
Otto Chemie Pvt. Ltd. - Product / Service
Otto Chemie Pvt. Ltd. - Key offerings
SWOT

15.14 ROHA Dyechem Pvt. Ltd.

ROHA Dyechem Pvt. Ltd. - Overview
ROHA Dyechem Pvt. Ltd. - Product / Service
ROHA Dyechem Pvt. Ltd. - Key offerings
SWOT

15.15 Sensient Technologies Corp.

Sensient Technologies Corp. - Overview
Sensient Technologies Corp. - Business segments
Sensient Technologies Corp. - Key offerings
Sensient Technologies Corp. - Segment focus
SWOT

15.16 Simson Pharma Ltd.

Simson Pharma Ltd. - Overview
Simson Pharma Ltd. - Product / Service
Simson Pharma Ltd. - Key offerings
SWOT

15.17 Standardcon Pvt. Ltd

Standardcon Pvt. Ltd - Overview
Standardcon Pvt. Ltd - Product / Service
Standardcon Pvt. Ltd - Key offerings
SWOT

15.18 Sun Chemical Corp.

Sun Chemical Corp. - Overview
Sun Chemical Corp. - Product / Service
Sun Chemical Corp. - Key offerings
SWOT

16. Appendix

16.1 Scope of the report

Market definition
Objectives
Notes and caveats

16.2 Inclusions and exclusions checklist

Inclusions checklist
Exclusions checklist

16.3 Currency conversion rates for US$

16.4 Research methodology

16.5 Data procurement

Information sources

16.6 Data validation

16.7 Validation techniques employed for market sizing

16.8 Data synthesis

16.9 360 degree market analysis

16.10 List of abbreviations

Research Methodology

Technavio presents a detailed picture of the market by way of study, synthesis, and summation of data from multiple sources. The analysts have presented the various facets of the market with a particular focus on identifying the key industry influencers. The data thus presented is comprehensive, reliable, and the result of extensive research, both primary and secondary.

INFORMATION SOURCES

Primary sources

  • Manufacturers and suppliers
  • Channel partners
  • Industry experts
  • Strategic decision makers

Secondary sources

  • Industry journals and periodicals
  • Government data
  • Financial reports of key industry players
  • Historical data
  • Press releases

DATA ANALYSIS

Data Synthesis

  • Collation of data
  • Estimation of key figures
  • Analysis of derived insights

Data Validation

  • Triangulation with data models
  • Reference against proprietary databases
  • Corroboration with industry experts

REPORT WRITING

Qualitative

  • Market drivers
  • Market challenges
  • Market trends
  • Five forces analysis

Quantitative

  • Market size and forecast
  • Market segmentation
  • Geographical insights
  • Competitive landscape

Interested in this report?

Get your sample now to see our research methodology and insights!

Download Now

Frequently Asked Questions

Ponceau 4R market growth will increase by USD 8717.2 thousand thousand during 2026-2030.

The Ponceau 4R market is expected to grow at a CAGR of 4.5% during 2026-2030.

Ponceau 4R market is segmented by Type (Food grade, Industrial grade, Pharmaceutical grade, Cosmetic grade) Product type (Powder, Liquid, Granular) Application (Food and beverages, Pharmaceuticals, Textiles and leather, Cosmetics and personal care, Others)

Ajanta Food Colours, ATAMAN Kimya AS, Atul Ltd., Chem Lab, Cromatos s.r.l., Denim Colourchem Pvt Ltd, EMCO Dyestuff Pvt. Ltd., HiMedia Laboratories Pvt. Ltd., Koel Colours Pvt Ltd., Kolorjet Chemicals Pvt Ltd., MP Biomedicals Inc., Neelikon Food Dyes and Chemicals Ltd., Otto Chemie Pvt. Ltd., ROHA Dyechem Pvt. Ltd., Sensient Technologies Corp., Sigma Aldrich Chemicals Ltd., Simson Pharma Ltd., Standardcon Pvt. Ltd, Sun Chemical Corp., Vipul Organics Ltd. are a few of the key vendors in the Ponceau 4R market.

APAC will register the highest growth rate of 63.1% among the other regions. Therefore, the Ponceau 4R market in APAC is expected to garner significant business opportunities for the vendors during the forecast period.

China, India, Japan, South Korea, Indonesia, Australia, Germany, Italy, France, UK, Spain, The Netherlands, Turkey, Saudi Arabia, South Africa, UAE, Israel, Brazil, Argentina, Colombia, Mexico, US, Canada

  • Growing confectionery and packaged food production in emerging markets is the driving factor this market.

The Ponceau 4R market vendors should focus on grabbing business opportunities from the Type segment as it accounted for the largest market share in the base year.
RIA - Research AI Assistant
Ask RIA