Passive Component Market Analysis, Size, and Forecast 2026-2030: APAC (China, Japan, and India), North America (US, Canada, and Mexico), Europe (Germany, UK, and France), South America (Brazil, Argentina, and Chile), Middle East and Africa (Saudi Arabia, UAE, and South Africa), and Rest of World (ROW)

Passive Component Market Analysis, Size, and Forecast 2026-2030:
APAC (China, Japan, and India), North America (US, Canada, and Mexico), Europe (Germany, UK, and France), South America (Brazil, Argentina, and Chile), Middle East and Africa (Saudi Arabia, UAE, and South Africa), and Rest of World (ROW)

Published: Nov 2026 335 Pages SKU: IRTNTR41100

Market Overview at a Glance

$14.82 B
Market Opportunity
6.6%
CAGR 2025 - 2030
47%
APAC Growth
$13.06 B
Capacitors segment 2024

Passive Component Market Size 2026-2030

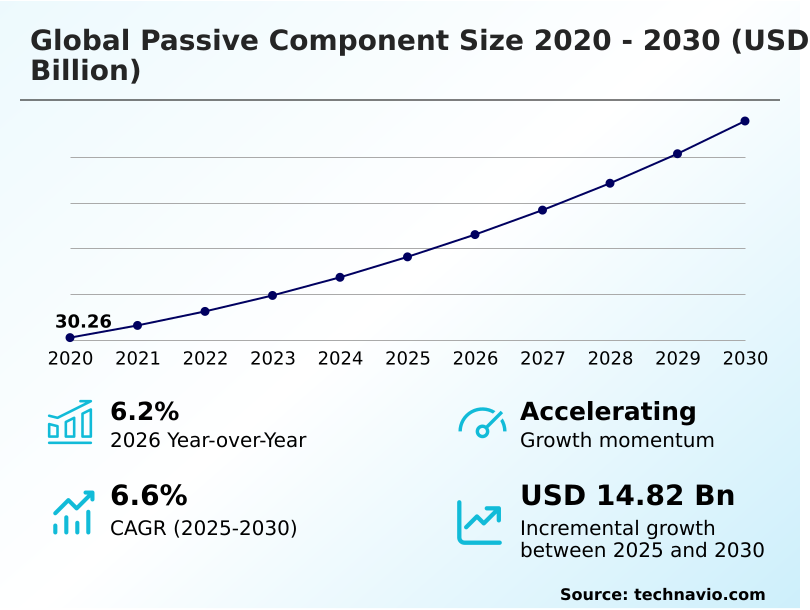
The passive component market size is valued to increase by USD 14.82 billion, at a CAGR of 6.6% from 2025 to 2030. Exponential growth of AI hardware will drive the passive component market.

Major Market Trends & Insights

  • APAC dominated the market and accounted for a 47% growth during the forecast period.
  • By Product - Capacitors segment was valued at USD 13.06 billion in 2024
  • By End-user - Consumer electronics segment accounted for the largest market revenue share in 2024

Market Size & Forecast

  • Market Opportunities: USD 23.63 billion
  • Market Future Opportunities: USD 14.82 billion
  • CAGR from 2025 to 2030 : 6.6%

Market Summary

  • The Passive Component functions as the structural foundation of modern electronic architectures, driven by the aggressive electrification of automotive platforms and the rapid scaling of high-density artificial intelligence infrastructure. Enterprise-grade AI servers require thousands of high-capacity capacitors operating in synchronized harmony to maintain clean energy delivery and prevent system crashes during dynamic load variations.
  • This transition toward AI hardware processing constitutes a massive driver, exponentially increasing component density per motherboard node. For instance, advanced server designs now necessitate a 40% higher concentration of transient voltage suppression devices compared to legacy computing environments. Conversely, volatility in critical raw material sourcing presents a profound challenge.
  • Fluctuations in the availability of precious metals directly erode gross manufacturing margins, forcing suppliers to renegotiate procurement contracts. To mitigate these disruptions, original equipment manufacturers are implementing dual-sourcing supply chain optimizations and diversifying supplier networks.
  • The integration of high-performance passive electronics remains critical for ensuring signal integrity and optimizing energy conversion efficiency across both hyperscale data centers and advanced electric mobility systems.

What will be the Size of the Passive Component Market during the forecast period?
Get Key Insights on Market Forecast (PDF) Get Free Sample

How is the Passive Component Market Segmented?

The passive component industry research report provides comprehensive data (region-wise segment analysis), with forecasts and estimates in "USD million" for the period 2026-2030, as well as historical data from 2020-2024 for the following segments.

  • Product
    • Capacitors
    • Resistors
    • Inductors
    • Diode
    • Transformers
  • End-user
    • Consumer electronics
    • IT and telecom industry
    • Automotive industry
    • Industrial machinery
    • Others
  • Component
    • Passive
    • Interconnecting
  • Material
    • Ceramic
    • Metal
    • Polymer
    • Others
  • Geography
    • APAC
      • China
      • Japan
      • India
      • South Korea
      • Australia
      • Indonesia
    • North America
      • US
      • Canada
      • Mexico
    • Europe
      • Germany
      • UK
      • France
      • Italy
      • Spain
      • The Netherlands
    • South America
      • Brazil
      • Argentina
      • Chile
    • Middle East and Africa
      • Saudi Arabia
      • UAE
      • South Africa
      • Israel
      • Turkey

By Product Insights

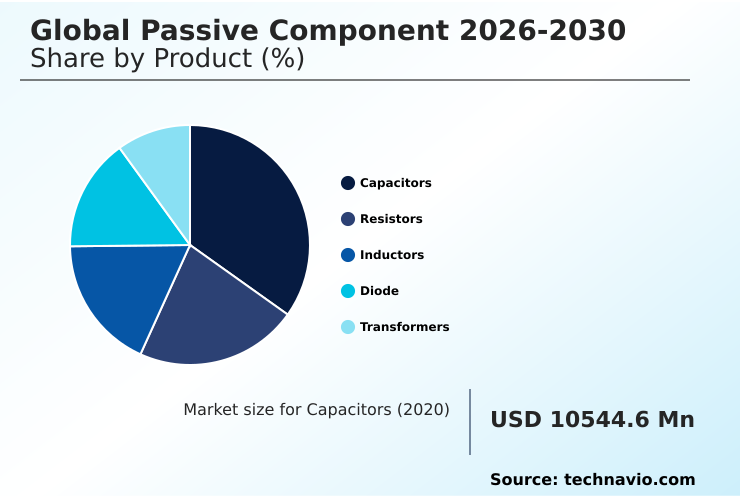
The capacitors segment is estimated to witness significant growth during the forecast period.

The Capacitors segment within the Passive Component commands a premier share, fundamentally driven by the expanding adoption of electric vehicles, hyperscale data centers, and advanced consumer electronics.

Serving essential operational roles in storing electrical charge and smoothing voltage fluctuations, capacitors are structural building blocks across high-reliability electronic architectures.

Multilayer ceramic capacitors represent the highest volume product category due to their superior volumetric efficiency and structural stability across extreme temperature variations.

As electronic hardware designs trend toward structural miniaturization, passive component manufacturers continue to push dielectric ceramic formulations to achieve higher microfarad values within progressively smaller footprint packages.

This miniaturization improves printed circuit board layouts efficiency by approximately 15%, allowing manufacturers to optimize high-power density.

The rising integration of artificial intelligence processing chips in server farms accelerates demand for specialized aluminum electrolytic capacitors mounted directly adjacent to power delivery networks to prevent transient voltage drops during intense computation loads.
Get Free Sample

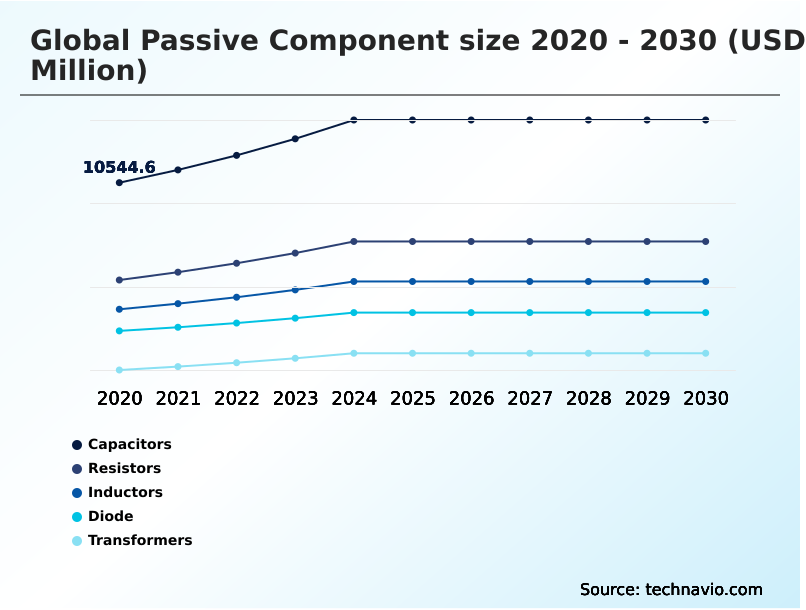
The Capacitors segment was valued at USD 13.06 billion in 2024 and showed a gradual increase during the forecast period.
Get Free Sample

Regional Analysis

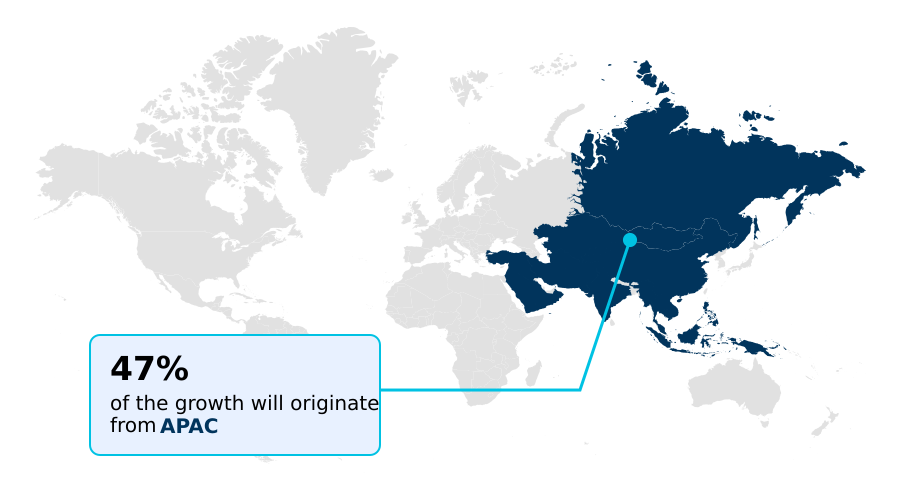
APAC is estimated to contribute 47% to the growth of the global market during the forecast period.Technavio’s analysts have elaborately explained the regional trends and drivers that shape the market during the forecast period.
See How Passive Component Market Demand is Rising in APAC Get Free Sample

The geographic distribution of the Passive Component reveals distinct operational focuses across major global manufacturing hubs. APAC functions as the primary engine for high-volume electronic assembly, holding a dominant market position driven by massive smartphone and electric vehicle production clusters.

In contrast, North America prioritizes the design and deployment of specialized infrastructure, particularly for artificial intelligence data centers and aerospace applications.

Operational efficiency in APAC is bolstered by localized raw material sourcing, which reduces supply chain lead times by 25% compared to European counterparts.

Meanwhile, North American facilities achieve a 20% higher integration rate of advanced thick-film resistors and planar transformers tailored for high-power density applications.

These regional differences highlight how businesses adapt strategies; APAC manufacturers scale production for mass consumer adoption, while North American firms invest in niche, high-reliability components engineered for precision current measurement and electrical isolation.

The increasing adoption of wide-bandgap semiconductors across both regions continues to shape localized power decoupling strategies and component procurement models.

Market Dynamics

Our researchers analyzed the data with 2025 as the base year, along with the key drivers, trends, and challenges. A holistic analysis of drivers will help companies refine their marketing strategies to gain a competitive advantage.

  • The continuous evolution of the Passive Component is deeply intertwined with the increasing complexity of industrial and automotive electronics. As original equipment manufacturers transition toward advanced electric mobility platforms, securing a reliable supply of automotive grade multilayer ceramic capacitors has become a critical supply chain priority.
  • This shift requires rigorous supplier qualification processes, resulting in a 40% reduction in procurement bottlenecks for manufacturers that adopt localized sourcing models compared to those relying entirely on overseas vendors. Additionally, the rapid rollout of next-generation telecommunications infrastructure demands high frequency radio frequency filters capable of maintaining signal integrity across dense urban networks.
  • To manage the immense power requirements of edge computing and artificial intelligence server farms, design engineers are increasingly specifying compact surface mount thin film inductors that optimize board space without sacrificing thermal performance. Furthermore, high-performance computing clusters depend on low equivalent series resistance capacitors to stabilize transient voltage spikes and ensure continuous energy delivery under dynamic loads.
  • To meet stringent aerospace and medical device standards, manufacturers also integrate precision thin film resistor networks that deliver absolute accuracy and minimal drift over extended operational lifespans. By prioritizing these specialized components, global enterprises can effectively mitigate operational risks, streamline compliance with international safety mandates, and significantly enhance the overall reliability of their advanced electronic architectures.
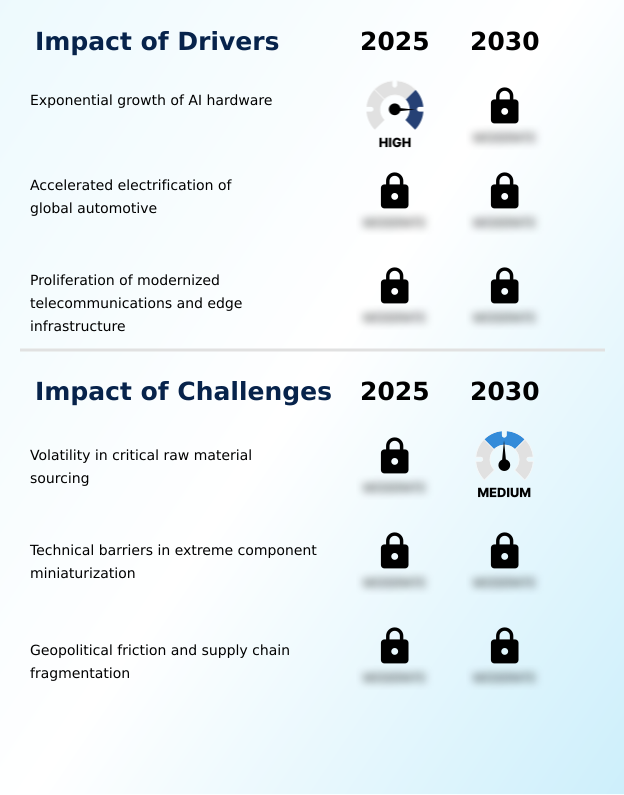
What are the key market drivers leading to the rise in the adoption of Passive Component Industry?

  • The exponential growth of artificial intelligence hardware serves as the primary driver propelling market expansion.

  • The rapid acceleration of artificial intelligence workload deployment represents a transformative catalyst for the Passive Component. High-performance computing clusters require unprecedented power distribution density, driving the adoption of high-permeability magnetic materials and specialized thick-film resistors.
  • This architectural shift ensures clean energy delivery to advanced graphics processing units, resulting in a 35% reduction in transient voltage failures.
  • Simultaneously, the accelerated electrification of global automotive platforms demands robust flexible printed passives and activated carbon aerogels to manage severe electrical loads. By integrating these high-reliability components, automotive manufacturers have improved battery charging efficiency by 20%.
  • This fundamental change in hardware requirements empowers original equipment manufacturers to optimize power conversion and maintain structural integrity across increasingly complex and miniaturized electronic assemblies.

What are the market trends shaping the Passive Component Industry?

  • The rapid expansion of aerospace and defense satellite constellations represents a prominent upcoming trend in the market. This development requires advanced components capable of enduring extreme orbital environments.

  • The Passive Component is undergoing a structural transformation driven by the deployment of Industry 4.0 smart manufacturing practices and condition-based predictive maintenance networks. The integration of wide-bandgap semiconductors in clean energy generation acts as a primary catalyst, demanding advanced snubber circuits and robust radio frequency front-end modules.
  • This technological shift improves industrial energy conversion efficiency, reducing operational energy waste by 18%. Furthermore, the transition toward high-density power supply architectures utilizes advanced planar transformers and low equivalent series resistance components to optimize thermal management. By implementing these surface-mount devices, enterprise data centers have decreased system downtime by 22% during peak computational loads.
  • These adoptions allow businesses to maximize continuous operational uptime in harsh electrical environments while minimizing physical footprint requirements across high-power automation systems.

What challenges does the Passive Component Industry face during its growth?

  • Volatility in critical raw material sourcing remains a significant challenge affecting overall industry growth.

  • Extreme cost and supply volatility across critical raw material inputs creates a profound structural limitation for the Passive Component. The extraction of specialized precursor materials for tantalum capacitors and dielectric ceramic formulations is geographically concentrated, exposing the supply chain to severe disruptions.
  • This material sourcing volatility directly erodes gross manufacturing margins, increasing component procurement costs by up to 15% for original equipment manufacturers. Additionally, technical barriers in extreme component miniaturization strain automated surface-mount assembly equipment. Controlling dielectric layer uniformity at sub-micron scales introduces non-linear defect rates, which can lower production yields by 12% during high-temperature sintering processes.
  • These operational constraints force companies to allocate substantial capital toward secondary sourcing arrangements and alternative material research to mitigate supply concentration risks and stabilize production throughput.

Exclusive Technavio Analysis on Customer Landscape

The passive component market forecasting report includes the adoption lifecycle of the market, covering from the innovator’s stage to the laggard’s stage. It focuses on adoption rates in different regions based on penetration. Furthermore, the passive component market report also includes key purchase criteria and drivers of price sensitivity to help companies evaluate and develop their market growth analysis strategies.
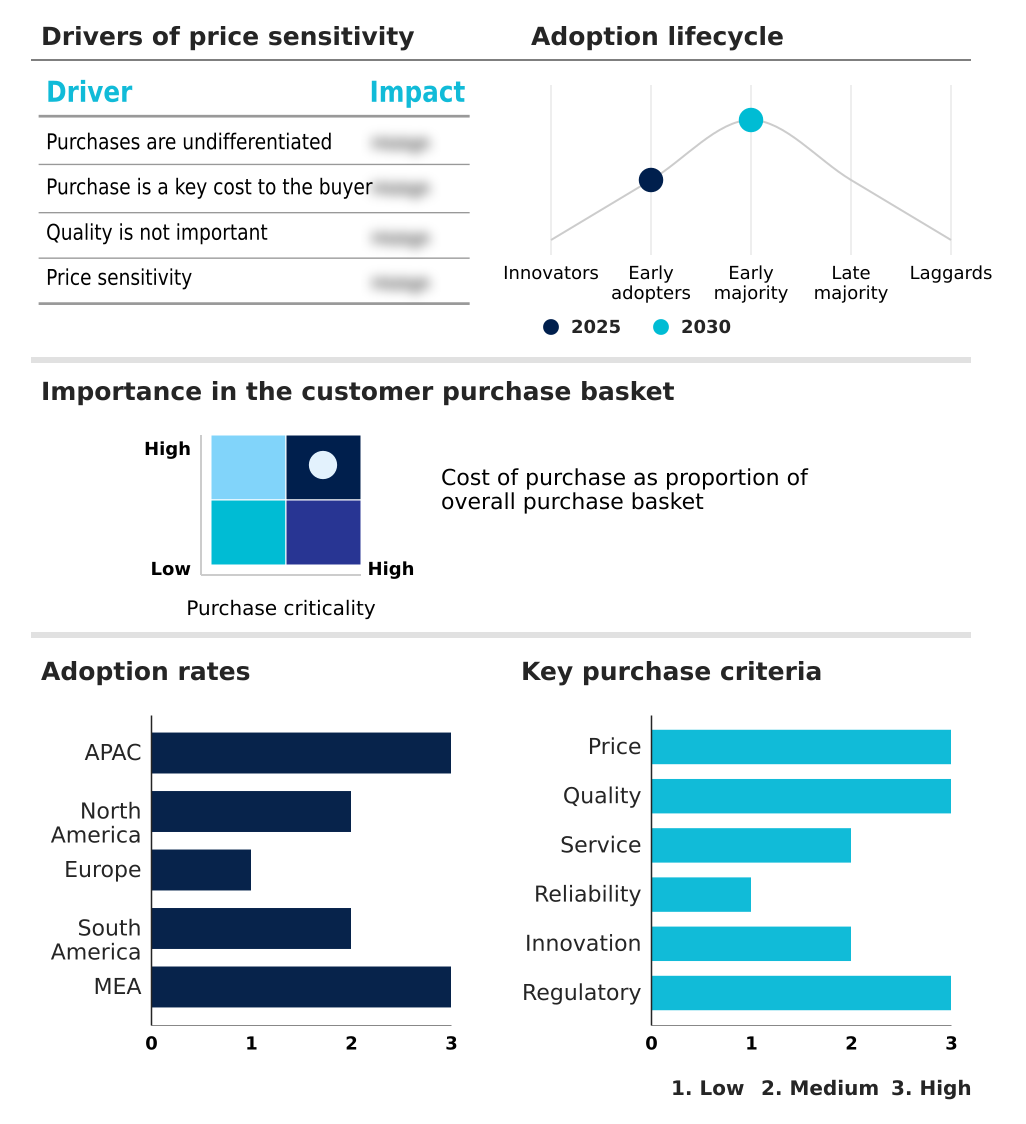
Customer Landscape of Passive Component Industry

Competitive Landscape

Companies are implementing various strategies, such as strategic alliances, passive component market forecast, partnerships, mergers and acquisitions, geographical expansion, and product/service launches, to enhance their presence in the industry.

Abracon LLC - The supplier provides an extensive portfolio of frequency control and timing devices, RF and antenna products, along with specialized inductor and connectivity solutions for high-performance electronic architectures.

The industry research and growth report includes detailed analyses of the competitive landscape of the market and information about key companies, including:

  • Abracon LLC
  • Bourns Inc.
  • Eaton Corp. Plc
  • Johanson Technology Inc.
  • Koa Corp.
  • Kyocera Corp.
  • Littelfuse Inc.
  • Murata Manufacturing Co. Ltd.
  • Nichicon Corp.
  • Panasonic Holdings Corp.
  • Rubycon Corp.
  • Samsung Electro Mechanics
  • Sumida Corp.
  • TAIYO YUDEN Co. Ltd.
  • TDK Corp.
  • TE Connectivity plc
  • Vishay Intertechnology Inc.
  • Wurth Elektronik GmbH and Co. KG
  • YAGEO Corp.

Qualitative and quantitative analysis of companies has been conducted to help clients understand the wider business environment as well as the strengths and weaknesses of key industry players. Data is qualitatively analyzed to categorize companies as pure play, category-focused, industry-focused, and diversified; it is quantitatively analyzed to categorize companies as dominant, leading, strong, tentative, and weak.

Recent Development and News in Passive component market

  • In the Semiconductors industry, the shift toward AI-optimized GPU architectures has increased power density requirements in data centers, directly impacting Passive Component demand by requiring advanced multilayer ceramic capacitors for localized power decoupling.
  • The integration of wide-bandgap semiconductors such as silicon carbide in electric vehicle powertrains has elevated operating switching frequencies, driving Passive Component demand for high-voltage film capacitors that manage extreme thermal cycling.
  • The transition toward 5G millimeter-wave radio frequency front-end architectures has amplified signal attenuation challenges, pulling Passive Component demand for compact surface-mount devices capable of precise impedance matching networks.
  • The deployment of autonomous driving domain controllers has created harsh electrical environments necessitating advanced sensor signal conditioning, reshaping the Passive Component market through the adoption of moisture-resistant chip resistors and soft-termination architectures.

Dive into Technavio’s robust research methodology, blending expert interviews, extensive data synthesis, and validated models for unparalleled Passive Component Market insights. See full methodology.

Market Scope
Page number 335
Base year 2025
Historic period 2020-2024
Forecast period 2026-2030
Growth momentum & CAGR Accelerate at a CAGR of 6.6%
Market growth 2026-2030 USD 14818.0 million
Market structure Fragmented
YoY growth 2025-2026(%) 6.2%
Key countries China, Japan, India, South Korea, Australia, Indonesia, US, Canada, Mexico, Germany, UK, France, Italy, Spain, The Netherlands, Brazil, Argentina, Chile, Saudi Arabia, UAE, South Africa, Israel and Turkey
Competitive landscape Leading Companies, Market Positioning of Companies, Competitive Strategies, and Industry Risks

Request Free Sample

Research Analyst Overview

  • The Passive Component continues to evolve in response to the escalating power density and miniaturization demands of modern electronic infrastructure. A prominent trend involves the structural transition toward advanced electric vehicle powertrains, which requires boardroom-level strategic decisions regarding the procurement of high-reliability components capable of withstanding extreme thermal environments.
  • Original equipment manufacturers are increasingly integrating aluminum electrolytic capacitors and power inductors to manage the intense electrical stress generated by wide-bandgap semiconductors. This strategic shift has enabled automotive manufacturers to achieve a 25% improvement in energy conversion efficiency within their battery management architectures.
  • Furthermore, the proliferation of hyperscale data centers necessitates robust transient voltage suppression and electromagnetic interference suppression to maintain operational stability. High-frequency filters and chip resistors are systematically deployed to optimize signal routing and minimize parasitic losses across complex printed circuit boards.
  • By investing in resilient supply chain frameworks and advanced dielectric ceramic formulations, global enterprises can successfully navigate raw material volatility while delivering the enhanced component reliability required for next-generation telecommunications and industrial automation systems.

What are the Key Data Covered in this Passive Component Market Research and Growth Report?

  • What is the expected growth of the Passive Component Market between 2026 and 2030?

    • USD 14.82 billion, at a CAGR of 6.6%

  • What segmentation does the market report cover?

    • The report is segmented by Product (Capacitors, Resistors, Inductors, Diode, and Transformers), End-user (Consumer electronics, IT and telecom industry, Automotive industry, Industrial machinery, and Others), Component (Passive, and Interconnecting), Material (Ceramic, Metal, Polymer, and Others) and Geography (APAC, North America, Europe, South America, Middle East and Africa)

  • Which regions are analyzed in the report?

    • APAC, North America, Europe, South America and Middle East and Africa

  • What are the key growth drivers and market challenges?

    • Exponential growth of AI hardware, Volatility in critical raw material sourcing

  • Who are the major players in the Passive Component Market?

    • Abracon LLC, Bourns Inc., Eaton Corp. Plc, Johanson Technology Inc., Koa Corp., Kyocera Corp., Littelfuse Inc., Murata Manufacturing Co. Ltd., Nichicon Corp., Panasonic Holdings Corp., Rubycon Corp., Samsung Electro Mechanics, Sumida Corp., TAIYO YUDEN Co. Ltd., TDK Corp., TE Connectivity plc, Vishay Intertechnology Inc., Wurth Elektronik GmbH and Co. KG and YAGEO Corp.

Market Research Insights

  • The Passive Component forms the critical electrical backbone for modern technological infrastructure, supporting everything from battery management systems to smart grid synchronization. As industrial automation accelerates, manufacturers rely on these devices to manage harsh electrical environments and ensure voltage stabilization.
  • Recent design iterations have achieved component footprint reduction by up to 30%, significantly improving overall thermal dissipation performance in compact consumer electronics. Furthermore, the implementation of advanced packaging methods has decreased mechanical flex cracking defects by 15% during automated surface-mount assembly.
  • These measurable efficiency gains enable original equipment manufacturers to lower operational defect rates and improve overall system reliability, ensuring stable direct-current filtering across high-power automotive and telecommunications hardware.

We can help! Our analysts can customize this passive component market research report to meet your requirements.

Get in touch

1. Executive Summary

1.1 Market overview

Executive Summary - Chart on Market Overview
Executive Summary - Data Table on Market Overview
Executive Summary - Chart on Global Market Characteristics
Executive Summary - Chart on Market by Geography
Executive Summary - Chart on Market Segmentation by Product
Executive Summary - Chart on Market Segmentation by End-user
Executive Summary - Chart on Market Segmentation by Component
Executive Summary - Chart on Market Segmentation by Material
Executive Summary - Chart on Incremental Growth
Executive Summary - Data Table on Incremental Growth
Executive Summary - Chart on Company Market Positioning

2. Technavio Analysis

2.1 Analysis of price sensitivity, lifecycle, customer purchase basket, adoption rates, and purchase criteria

2.2 Criticality of inputs and Factors of differentiation

Chart on Overview on criticality of inputs and factors of differentiation

2.3 Factors of disruption

Chart on Overview on factors of disruption

2.4 Impact of drivers and challenges

Chart on Impact of drivers and challenges in 2025 and 2030

3. Market Landscape

3.1 Market ecosystem

Chart on Parent Market
Data Table on - Parent Market

3.2 Market characteristics

Chart on Market characteristics analysis

3.3 Value chain analysis

Chart on Value chain analysis

4. Market Sizing

4.1 Market definition

Data Table on Offerings of companies included in the market definition

4.2 Market segment analysis

Market segments

4.3 Market size 2025

4.4 Market outlook: Forecast for 2025-2030

Chart on Global - Market size and forecast 2025-2030 ($ million)
Data Table on Global - Market size and forecast 2025-2030 ($ million)
Chart on Global Market: Year-over-year growth 2025-2030 (%)
Data Table on Global Market: Year-over-year growth 2025-2030 (%)

5. Historic Market Size

5.1 Global Passive Component 2020 - 2024

Historic Market Size - Data Table on Global Passive Component 2020 - 2024 ($ million)

5.2 Product segment analysis 2020 - 2024

Historic Market Size - Product Segment 2020 - 2024 ($ million)

5.3 End-user segment analysis 2020 - 2024

Historic Market Size - End-user Segment 2020 - 2024 ($ million)

5.4 Component segment analysis 2020 - 2024

Historic Market Size - Component Segment 2020 - 2024 ($ million)

5.5 Material segment analysis 2020 - 2024

Historic Market Size - Material Segment 2020 - 2024 ($ million)

5.6 Geography segment analysis 2020 - 2024

Historic Market Size - Geography Segment 2020 - 2024 ($ million)

5.7 Country segment analysis 2020 - 2024

Historic Market Size - Country Segment 2020 - 2024 ($ million)

6. Qualitative Analysis

6.1 Impact of AI on Global Passive Component Market

6.2 Impact of geopolitical conflicts on Global Passive Component Market

7. Five Forces Analysis

7.1 Five forces summary

Five forces analysis - Comparison between 2025 and 2030

7.2 Bargaining power of buyers

Bargaining power of buyers - Impact of key factors 2025 and 2030

7.3 Bargaining power of suppliers

Bargaining power of suppliers - Impact of key factors in 2025 and 2030

7.4 Threat of new entrants

Threat of new entrants - Impact of key factors in 2025 and 2030

7.5 Threat of substitutes

Threat of substitutes - Impact of key factors in 2025 and 2030

7.6 Threat of rivalry

Threat of rivalry - Impact of key factors in 2025 and 2030

7.7 Market condition

Chart on Market condition - Five forces 2025 and 2030

8. Market Segmentation by Product

8.1 Market segments

Chart on Product - Market share 2025-2030 (%)
Data Table on Product - Market share 2025-2030 (%)

8.2 Comparison by Product

Chart on Comparison by Product
Data Table on Comparison by Product

8.3 Capacitors - Market size and forecast 2025-2030

Chart on Capacitors - Market size and forecast 2025-2030 ($ million)
Data Table on Capacitors - Market size and forecast 2025-2030 ($ million)
Chart on Capacitors - Year-over-year growth 2025-2030 (%)
Data Table on Capacitors - Year-over-year growth 2025-2030 (%)

8.4 Resistors - Market size and forecast 2025-2030

Chart on Resistors - Market size and forecast 2025-2030 ($ million)
Data Table on Resistors - Market size and forecast 2025-2030 ($ million)
Chart on Resistors - Year-over-year growth 2025-2030 (%)
Data Table on Resistors - Year-over-year growth 2025-2030 (%)

8.5 Inductors - Market size and forecast 2025-2030

Chart on Inductors - Market size and forecast 2025-2030 ($ million)
Data Table on Inductors - Market size and forecast 2025-2030 ($ million)
Chart on Inductors - Year-over-year growth 2025-2030 (%)
Data Table on Inductors - Year-over-year growth 2025-2030 (%)

8.6 Diode - Market size and forecast 2025-2030

Chart on Diode - Market size and forecast 2025-2030 ($ million)
Data Table on Diode - Market size and forecast 2025-2030 ($ million)
Chart on Diode - Year-over-year growth 2025-2030 (%)
Data Table on Diode - Year-over-year growth 2025-2030 (%)

8.7 Transformers - Market size and forecast 2025-2030

Chart on Transformers - Market size and forecast 2025-2030 ($ million)
Data Table on Transformers - Market size and forecast 2025-2030 ($ million)
Chart on Transformers - Year-over-year growth 2025-2030 (%)
Data Table on Transformers - Year-over-year growth 2025-2030 (%)

8.8 Market opportunity by Product

Market opportunity by Product ($ million)
Data Table on Market opportunity by Product ($ million)

9. Market Segmentation by End-user

9.1 Market segments

Chart on End-user - Market share 2025-2030 (%)
Data Table on End-user - Market share 2025-2030 (%)

9.2 Comparison by End-user

Chart on Comparison by End-user
Data Table on Comparison by End-user

9.3 Consumer electronics - Market size and forecast 2025-2030

Chart on Consumer electronics - Market size and forecast 2025-2030 ($ million)
Data Table on Consumer electronics - Market size and forecast 2025-2030 ($ million)
Chart on Consumer electronics - Year-over-year growth 2025-2030 (%)
Data Table on Consumer electronics - Year-over-year growth 2025-2030 (%)

9.4 IT and telecom industry - Market size and forecast 2025-2030

Chart on IT and telecom industry - Market size and forecast 2025-2030 ($ million)
Data Table on IT and telecom industry - Market size and forecast 2025-2030 ($ million)
Chart on IT and telecom industry - Year-over-year growth 2025-2030 (%)
Data Table on IT and telecom industry - Year-over-year growth 2025-2030 (%)

9.5 Automotive industry - Market size and forecast 2025-2030

Chart on Automotive industry - Market size and forecast 2025-2030 ($ million)
Data Table on Automotive industry - Market size and forecast 2025-2030 ($ million)
Chart on Automotive industry - Year-over-year growth 2025-2030 (%)
Data Table on Automotive industry - Year-over-year growth 2025-2030 (%)

9.6 Industrial machinery - Market size and forecast 2025-2030

Chart on Industrial machinery - Market size and forecast 2025-2030 ($ million)
Data Table on Industrial machinery - Market size and forecast 2025-2030 ($ million)
Chart on Industrial machinery - Year-over-year growth 2025-2030 (%)
Data Table on Industrial machinery - Year-over-year growth 2025-2030 (%)

9.7 Others - Market size and forecast 2025-2030

Chart on Others - Market size and forecast 2025-2030 ($ million)
Data Table on Others - Market size and forecast 2025-2030 ($ million)
Chart on Others - Year-over-year growth 2025-2030 (%)
Data Table on Others - Year-over-year growth 2025-2030 (%)

9.8 Market opportunity by End-user

Market opportunity by End-user ($ million)
Data Table on Market opportunity by End-user ($ million)

10. Market Segmentation by Component

10.1 Market segments

Chart on Component - Market share 2025-2030 (%)
Data Table on Component - Market share 2025-2030 (%)

10.2 Comparison by Component

Chart on Comparison by Component
Data Table on Comparison by Component

10.3 Passive - Market size and forecast 2025-2030

Chart on Passive - Market size and forecast 2025-2030 ($ million)
Data Table on Passive - Market size and forecast 2025-2030 ($ million)
Chart on Passive - Year-over-year growth 2025-2030 (%)
Data Table on Passive - Year-over-year growth 2025-2030 (%)

10.4 Interconnecting - Market size and forecast 2025-2030

Chart on Interconnecting - Market size and forecast 2025-2030 ($ million)
Data Table on Interconnecting - Market size and forecast 2025-2030 ($ million)
Chart on Interconnecting - Year-over-year growth 2025-2030 (%)
Data Table on Interconnecting - Year-over-year growth 2025-2030 (%)

10.5 Market opportunity by Component

Market opportunity by Component ($ million)
Data Table on Market opportunity by Component ($ million)

11. Market Segmentation by Material

11.1 Market segments

Chart on Material - Market share 2025-2030 (%)
Data Table on Material - Market share 2025-2030 (%)

11.2 Comparison by Material

Chart on Comparison by Material
Data Table on Comparison by Material

11.3 Ceramic - Market size and forecast 2025-2030

Chart on Ceramic - Market size and forecast 2025-2030 ($ million)
Data Table on Ceramic - Market size and forecast 2025-2030 ($ million)
Chart on Ceramic - Year-over-year growth 2025-2030 (%)
Data Table on Ceramic - Year-over-year growth 2025-2030 (%)

11.4 Metal - Market size and forecast 2025-2030

Chart on Metal - Market size and forecast 2025-2030 ($ million)
Data Table on Metal - Market size and forecast 2025-2030 ($ million)
Chart on Metal - Year-over-year growth 2025-2030 (%)
Data Table on Metal - Year-over-year growth 2025-2030 (%)

11.5 Polymer - Market size and forecast 2025-2030

Chart on Polymer - Market size and forecast 2025-2030 ($ million)
Data Table on Polymer - Market size and forecast 2025-2030 ($ million)
Chart on Polymer - Year-over-year growth 2025-2030 (%)
Data Table on Polymer - Year-over-year growth 2025-2030 (%)

11.6 Others - Market size and forecast 2025-2030

Chart on Others - Market size and forecast 2025-2030 ($ million)
Data Table on Others - Market size and forecast 2025-2030 ($ million)
Chart on Others - Year-over-year growth 2025-2030 (%)
Data Table on Others - Year-over-year growth 2025-2030 (%)

11.7 Market opportunity by Material

Market opportunity by Material ($ million)
Data Table on Market opportunity by Material ($ million)

12. Customer Landscape

12.1 Customer landscape overview

Analysis of price sensitivity, lifecycle, customer purchase basket, adoption rates, and purchase criteria

13. Geographic Landscape

13.1 Geographic segmentation

Chart on Market share by geography 2025-2030 (%)
Data Table on Market share by geography 2025-2030 (%)

13.2 Geographic comparison

Chart on Geographic comparison
Data Table on Geographic comparison

13.3 APAC - Market size and forecast 2025-2030

Chart on APAC - Market size and forecast 2025-2030 ($ million)
Data Table on APAC - Market size and forecast 2025-2030 ($ million)
Chart on APAC - Year-over-year growth 2025-2030 (%)
Data Table on APAC - Year-over-year growth 2025-2030 (%)
Chart on Regional Comparison - APAC
Data Table on Regional Comparison - APAC

13.3.1 China - Market size and forecast 2025-2030

Chart on China - Market size and forecast 2025-2030 ($ million)
Data Table on China - Market size and forecast 2025-2030 ($ million)
Chart on China - Year-over-year growth 2025-2030 (%)
Data Table on China - Year-over-year growth 2025-2030 (%)

13.3.2 Japan - Market size and forecast 2025-2030

Chart on Japan - Market size and forecast 2025-2030 ($ million)
Data Table on Japan - Market size and forecast 2025-2030 ($ million)
Chart on Japan - Year-over-year growth 2025-2030 (%)
Data Table on Japan - Year-over-year growth 2025-2030 (%)

13.3.3 India - Market size and forecast 2025-2030

Chart on India - Market size and forecast 2025-2030 ($ million)
Data Table on India - Market size and forecast 2025-2030 ($ million)
Chart on India - Year-over-year growth 2025-2030 (%)
Data Table on India - Year-over-year growth 2025-2030 (%)

13.3.4 South Korea - Market size and forecast 2025-2030

Chart on South Korea - Market size and forecast 2025-2030 ($ million)
Data Table on South Korea - Market size and forecast 2025-2030 ($ million)
Chart on South Korea - Year-over-year growth 2025-2030 (%)
Data Table on South Korea - Year-over-year growth 2025-2030 (%)

13.3.5 Australia - Market size and forecast 2025-2030

Chart on Australia - Market size and forecast 2025-2030 ($ million)
Data Table on Australia - Market size and forecast 2025-2030 ($ million)
Chart on Australia - Year-over-year growth 2025-2030 (%)
Data Table on Australia - Year-over-year growth 2025-2030 (%)

13.3.6 Indonesia - Market size and forecast 2025-2030

Chart on Indonesia - Market size and forecast 2025-2030 ($ million)
Data Table on Indonesia - Market size and forecast 2025-2030 ($ million)
Chart on Indonesia - Year-over-year growth 2025-2030 (%)
Data Table on Indonesia - Year-over-year growth 2025-2030 (%)

13.4 North America - Market size and forecast 2025-2030

Chart on North America - Market size and forecast 2025-2030 ($ million)
Data Table on North America - Market size and forecast 2025-2030 ($ million)
Chart on North America - Year-over-year growth 2025-2030 (%)
Data Table on North America - Year-over-year growth 2025-2030 (%)
Chart on Regional Comparison - North America
Data Table on Regional Comparison - North America

13.4.1 US - Market size and forecast 2025-2030

Chart on US - Market size and forecast 2025-2030 ($ million)
Data Table on US - Market size and forecast 2025-2030 ($ million)
Chart on US - Year-over-year growth 2025-2030 (%)
Data Table on US - Year-over-year growth 2025-2030 (%)

13.4.2 Canada - Market size and forecast 2025-2030

Chart on Canada - Market size and forecast 2025-2030 ($ million)
Data Table on Canada - Market size and forecast 2025-2030 ($ million)
Chart on Canada - Year-over-year growth 2025-2030 (%)
Data Table on Canada - Year-over-year growth 2025-2030 (%)

13.4.3 Mexico - Market size and forecast 2025-2030

Chart on Mexico - Market size and forecast 2025-2030 ($ million)
Data Table on Mexico - Market size and forecast 2025-2030 ($ million)
Chart on Mexico - Year-over-year growth 2025-2030 (%)
Data Table on Mexico - Year-over-year growth 2025-2030 (%)

13.5 Europe - Market size and forecast 2025-2030

Chart on Europe - Market size and forecast 2025-2030 ($ million)
Data Table on Europe - Market size and forecast 2025-2030 ($ million)
Chart on Europe - Year-over-year growth 2025-2030 (%)
Data Table on Europe - Year-over-year growth 2025-2030 (%)
Chart on Regional Comparison - Europe
Data Table on Regional Comparison - Europe

13.5.1 Germany - Market size and forecast 2025-2030

Chart on Germany - Market size and forecast 2025-2030 ($ million)
Data Table on Germany - Market size and forecast 2025-2030 ($ million)
Chart on Germany - Year-over-year growth 2025-2030 (%)
Data Table on Germany - Year-over-year growth 2025-2030 (%)

13.5.2 UK - Market size and forecast 2025-2030

Chart on UK - Market size and forecast 2025-2030 ($ million)
Data Table on UK - Market size and forecast 2025-2030 ($ million)
Chart on UK - Year-over-year growth 2025-2030 (%)
Data Table on UK - Year-over-year growth 2025-2030 (%)

13.5.3 France - Market size and forecast 2025-2030

Chart on France - Market size and forecast 2025-2030 ($ million)
Data Table on France - Market size and forecast 2025-2030 ($ million)
Chart on France - Year-over-year growth 2025-2030 (%)
Data Table on France - Year-over-year growth 2025-2030 (%)

13.5.4 Italy - Market size and forecast 2025-2030

Chart on Italy - Market size and forecast 2025-2030 ($ million)
Data Table on Italy - Market size and forecast 2025-2030 ($ million)
Chart on Italy - Year-over-year growth 2025-2030 (%)
Data Table on Italy - Year-over-year growth 2025-2030 (%)

13.5.5 Spain - Market size and forecast 2025-2030

Chart on Spain - Market size and forecast 2025-2030 ($ million)
Data Table on Spain - Market size and forecast 2025-2030 ($ million)
Chart on Spain - Year-over-year growth 2025-2030 (%)
Data Table on Spain - Year-over-year growth 2025-2030 (%)

13.5.6 The Netherlands - Market size and forecast 2025-2030

Chart on The Netherlands - Market size and forecast 2025-2030 ($ million)
Data Table on The Netherlands - Market size and forecast 2025-2030 ($ million)
Chart on The Netherlands - Year-over-year growth 2025-2030 (%)
Data Table on The Netherlands - Year-over-year growth 2025-2030 (%)

13.6 South America - Market size and forecast 2025-2030

Chart on South America - Market size and forecast 2025-2030 ($ million)
Data Table on South America - Market size and forecast 2025-2030 ($ million)
Chart on South America - Year-over-year growth 2025-2030 (%)
Data Table on South America - Year-over-year growth 2025-2030 (%)
Chart on Regional Comparison - South America
Data Table on Regional Comparison - South America

13.6.1 Brazil - Market size and forecast 2025-2030

Chart on Brazil - Market size and forecast 2025-2030 ($ million)
Data Table on Brazil - Market size and forecast 2025-2030 ($ million)
Chart on Brazil - Year-over-year growth 2025-2030 (%)
Data Table on Brazil - Year-over-year growth 2025-2030 (%)

13.6.2 Argentina - Market size and forecast 2025-2030

Chart on Argentina - Market size and forecast 2025-2030 ($ million)
Data Table on Argentina - Market size and forecast 2025-2030 ($ million)
Chart on Argentina - Year-over-year growth 2025-2030 (%)
Data Table on Argentina - Year-over-year growth 2025-2030 (%)

13.6.3 Chile - Market size and forecast 2025-2030

Chart on Chile - Market size and forecast 2025-2030 ($ million)
Data Table on Chile - Market size and forecast 2025-2030 ($ million)
Chart on Chile - Year-over-year growth 2025-2030 (%)
Data Table on Chile - Year-over-year growth 2025-2030 (%)

13.7 Middle East and Africa - Market size and forecast 2025-2030

Chart on Middle East and Africa - Market size and forecast 2025-2030 ($ million)
Data Table on Middle East and Africa - Market size and forecast 2025-2030 ($ million)
Chart on Middle East and Africa - Year-over-year growth 2025-2030 (%)
Data Table on Middle East and Africa - Year-over-year growth 2025-2030 (%)
Chart on Regional Comparison - Middle East and Africa
Data Table on Regional Comparison - Middle East and Africa

13.7.1 Saudi Arabia - Market size and forecast 2025-2030

Chart on Saudi Arabia - Market size and forecast 2025-2030 ($ million)
Data Table on Saudi Arabia - Market size and forecast 2025-2030 ($ million)
Chart on Saudi Arabia - Year-over-year growth 2025-2030 (%)
Data Table on Saudi Arabia - Year-over-year growth 2025-2030 (%)

13.7.2 UAE - Market size and forecast 2025-2030

Chart on UAE - Market size and forecast 2025-2030 ($ million)
Data Table on UAE - Market size and forecast 2025-2030 ($ million)
Chart on UAE - Year-over-year growth 2025-2030 (%)
Data Table on UAE - Year-over-year growth 2025-2030 (%)

13.7.3 South Africa - Market size and forecast 2025-2030

Chart on South Africa - Market size and forecast 2025-2030 ($ million)
Data Table on South Africa - Market size and forecast 2025-2030 ($ million)
Chart on South Africa - Year-over-year growth 2025-2030 (%)
Data Table on South Africa - Year-over-year growth 2025-2030 (%)

13.7.4 Israel - Market size and forecast 2025-2030

Chart on Israel - Market size and forecast 2025-2030 ($ million)
Data Table on Israel - Market size and forecast 2025-2030 ($ million)
Chart on Israel - Year-over-year growth 2025-2030 (%)
Data Table on Israel - Year-over-year growth 2025-2030 (%)

13.7.5 Turkey - Market size and forecast 2025-2030

Chart on Turkey - Market size and forecast 2025-2030 ($ million)
Data Table on Turkey - Market size and forecast 2025-2030 ($ million)
Chart on Turkey - Year-over-year growth 2025-2030 (%)
Data Table on Turkey - Year-over-year growth 2025-2030 (%)

13.8 Market opportunity by geography

Market opportunity by geography ($ million)
Data Tables on Market opportunity by geography ($ million)

14. Drivers, Challenges, and Opportunity

14.1 Market drivers

Exponential growth of AI hardware
Accelerated electrification of global automotive
Proliferation of modernized telecommunications and edge infrastructure

14.2 Market challenges

Volatility in critical raw material sourcing
Technical barriers in extreme component miniaturization
Geopolitical friction and supply chain fragmentation

14.3 Impact of drivers and challenges

Impact of drivers and challenges in 2025 and 2030

14.4 Market opportunities

Rapid expansion of aerospace and defense satellite constellations
Integration of wide bandgap semiconductors in renewable power
Proliferation of industrial automation and predictive maintenance sensors

15. Competitive Landscape

15.1 Overview

15.2

Overview on criticality of inputs and factors of differentiation

15.3 Landscape disruption

Overview on factors of disruption

15.4 Industry risks

Impact of key risks on business

16. Competitive Analysis

16.1 Companies profiled

Companies covered

16.2 Company ranking index

16.3 Market positioning of companies

Matrix on companies position and classification

16.4 Eaton Corp. Plc

Eaton Corp. Plc - Overview
Eaton Corp. Plc - Business segments
Eaton Corp. Plc - Key news
Eaton Corp. Plc - Key offerings
Eaton Corp. Plc - Segment focus
SWOT

16.5 Koa Corp.

Koa Corp. - Overview
Koa Corp. - Product / Service
Koa Corp. - Key offerings
SWOT

16.6 Kyocera Corp.

Kyocera Corp. - Overview
Kyocera Corp. - Business segments
Kyocera Corp. - Key offerings
Kyocera Corp. - Segment focus
SWOT

16.7 Littelfuse Inc.

Littelfuse Inc. - Overview
Littelfuse Inc. - Business segments
Littelfuse Inc. - Key news
Littelfuse Inc. - Key offerings
Littelfuse Inc. - Segment focus
SWOT

16.8 Murata Manufacturing Co. Ltd.

Murata Manufacturing Co. Ltd. - Overview
Murata Manufacturing Co. Ltd. - Business segments
Murata Manufacturing Co. Ltd. - Key news
Murata Manufacturing Co. Ltd. - Key offerings
Murata Manufacturing Co. Ltd. - Segment focus
SWOT

16.9 Nichicon Corp.

Nichicon Corp. - Overview
Nichicon Corp. - Product / Service
Nichicon Corp. - Key offerings
SWOT

16.10 Panasonic Holdings Corp.

Panasonic Holdings Corp. - Overview
Panasonic Holdings Corp. - Business segments
Panasonic Holdings Corp. - Key news
Panasonic Holdings Corp. - Key offerings
Panasonic Holdings Corp. - Segment focus
SWOT

16.11 Rubycon Corp.

Rubycon Corp. - Overview
Rubycon Corp. - Product / Service
Rubycon Corp. - Key offerings
SWOT

16.12 Samsung Electro Mechanics

Samsung Electro Mechanics - Overview
Samsung Electro Mechanics - Product / Service
Samsung Electro Mechanics - Key offerings
SWOT

16.13 Sumida Corp.

Sumida Corp. - Overview
Sumida Corp. - Product / Service
Sumida Corp. - Key offerings
SWOT

16.14 TAIYO YUDEN Co. Ltd.

TAIYO YUDEN Co. Ltd. - Overview
TAIYO YUDEN Co. Ltd. - Product / Service
TAIYO YUDEN Co. Ltd. - Key offerings
SWOT

16.15 TDK Corp.

TDK Corp. - Overview
TDK Corp. - Business segments
TDK Corp. - Key offerings
TDK Corp. - Segment focus
SWOT

16.16 TE Connectivity plc

TE Connectivity plc - Overview
TE Connectivity plc - Business segments
TE Connectivity plc - Key offerings
TE Connectivity plc - Segment focus
SWOT

16.17 Vishay Intertechnology Inc.

Vishay Intertechnology Inc. - Overview
Vishay Intertechnology Inc. - Business segments
Vishay Intertechnology Inc. - Key news
Vishay Intertechnology Inc. - Key offerings
Vishay Intertechnology Inc. - Segment focus
SWOT

16.18 YAGEO Corp.

YAGEO Corp. - Overview
YAGEO Corp. - Product / Service
YAGEO Corp. - Key offerings
SWOT

17. Appendix

17.1 Scope of the report

Market definition
Objectives
Notes and caveats

17.2 Inclusions and exclusions checklist

Inclusions checklist
Exclusions checklist

17.3 Currency conversion rates for US$

17.4 Research methodology

17.5 Data procurement

Information sources

17.6 Data validation

17.7 Validation techniques employed for market sizing

17.8 Data synthesis

17.9 360 degree market analysis

17.10 List of abbreviations

Research Methodology

Technavio presents a detailed picture of the market by way of study, synthesis, and summation of data from multiple sources. The analysts have presented the various facets of the market with a particular focus on identifying the key industry influencers. The data thus presented is comprehensive, reliable, and the result of extensive research, both primary and secondary.

INFORMATION SOURCES

Primary sources

  • Manufacturers and suppliers
  • Channel partners
  • Industry experts
  • Strategic decision makers

Secondary sources

  • Industry journals and periodicals
  • Government data
  • Financial reports of key industry players
  • Historical data
  • Press releases

DATA ANALYSIS

Data Synthesis

  • Collation of data
  • Estimation of key figures
  • Analysis of derived insights

Data Validation

  • Triangulation with data models
  • Reference against proprietary databases
  • Corroboration with industry experts

REPORT WRITING

Qualitative

  • Market drivers
  • Market challenges
  • Market trends
  • Five forces analysis

Quantitative

  • Market size and forecast
  • Market segmentation
  • Geographical insights
  • Competitive landscape

Interested in this report?

Get your sample now to see our research methodology and insights!

Download Now

Frequently Asked Questions

Passive Component market growth will increase by USD 14818.0 million during 2026-2030.

The Passive Component market is expected to grow at a CAGR of 6.6% during 2026-2030.

Passive Component market is segmented by Product (Capacitors, Resistors, Inductors, Diode, Transformers) End-user (Consumer electronics, IT and telecom industry, Automotive industry, Industrial machinery, Others) Component (Passive, Interconnecting) Material (Ceramic, Metal, Polymer, Others)

Abracon LLC, Bourns Inc., Eaton Corp. Plc, Johanson Technology Inc., Koa Corp., Kyocera Corp., Littelfuse Inc., Murata Manufacturing Co. Ltd., Nichicon Corp., Panasonic Holdings Corp., Rubycon Corp., Samsung Electro Mechanics, Sumida Corp., TAIYO YUDEN Co. Ltd., TDK Corp., TE Connectivity plc, Vishay Intertechnology Inc., Wurth Elektronik GmbH and Co. KG, YAGEO Corp. are a few of the key vendors in the Passive Component market.

APAC will register the highest growth rate of 47% among the other regions. Therefore, the Passive Component market in APAC is expected to garner significant business opportunities for the vendors during the forecast period.

China, Japan, India, South Korea, Australia, Indonesia, US, Canada, Mexico, Germany, UK, France, Italy, Spain, The Netherlands, Brazil, Argentina, Chile, Saudi Arabia, UAE, South Africa, Israel, Turkey

  • Exponential growth of AI hardware is the driving factor this market.

The Passive Component market vendors should focus on grabbing business opportunities from the Product segment as it accounted for the largest market share in the base year.
RIA - Research AI Assistant
Ask RIA