
Optical Microscopes Market Analysis, Size, and Forecast 2026-2030: North America (US, Canada, and Mexico), Asia (China, India, and Japan), Europe (Germany, UK, and France), South America (Brazil, Argentina, and Colombia), Middle East and Africa (Saudi Arabia, UAE, and Turkey), Rest of World (ROW)

Optical Microscopes Market Analysis, Size, and Forecast 2026-2030:
North America (US, Canada, and Mexico), Asia (China, India, and Japan), Europe (Germany, UK, and France), South America (Brazil, Argentina, and Colombia), Middle East and Africa (Saudi Arabia, UAE, and Turkey), Rest of World (ROW)

Published: Nov 2026 308 Pages SKU: IRTNTR41187

Market Overview at a Glance

$897.1 Mn
Market Opportunity
5.1%
CAGR 2025 - 2030
34.7%
Asia Growth
$820.5 Mn
Stereo microscopes segment 2024

Optical Microscopes Market Size 2026-2030

The optical microscopes market size is valued to increase by USD 897.1 million, at a CAGR of 5.1% from 2025 to 2030. Rising investments in life sciences and drug discovery will drive the optical microscopes market.

Major Market Trends & Insights

  • Asia dominated the market and accounted for a 34.7% growth during the forecast period.
  • By Product - Stereo microscopes segment was valued at USD 820.5 million in 2024
  • By Application - Healthcare segment accounted for the largest market revenue share in 2024

Market Size & Forecast

  • Market Opportunities: USD 1.48 billion
  • Market Future Opportunities: USD 897.1 million
  • CAGR from 2025 to 2030 : 5.1%

Market Summary

  • The Optical Microscopes Market consistently demonstrates resilient demand fueled by its foundational role in both clinical diagnostics and high-precision manufacturing. Advanced optical visualization instruments serve as critical diagnostic tools, allowing laboratories to identify cellular anomalies without destructive tissue preparation.
  • Within semiconductor fabrication, the integration of automated particle counting software and motorized stages enables quality control teams to optimize supply chain workflows, achieving a 20% improvement in microchip defect detection rates compared to manual inspection protocols. This operational efficiency drastically reduces the financial impact of delayed product shipping.
  • A primary driver of this sustained equipment procurement is the expanding scope of biopharmaceutical research, where investigators rely heavily on live-cell time-lapse studies and birefringence measurement to evaluate complex therapeutic responses in real time. Conversely, the industry faces substantial physical challenges due to inherent optical diffraction limitations.
  • The inability to naturally resolve structures below 200 nanometers forces advanced nanotechnology research hubs to supplement their optical setups with highly expensive alternative imaging modalities, straining institutional capital budgets. Despite these constraints, ongoing optical engineering refinements ensure continuous utilization across critical scientific disciplines.

What will be the Size of the Optical Microscopes Market during the forecast period?
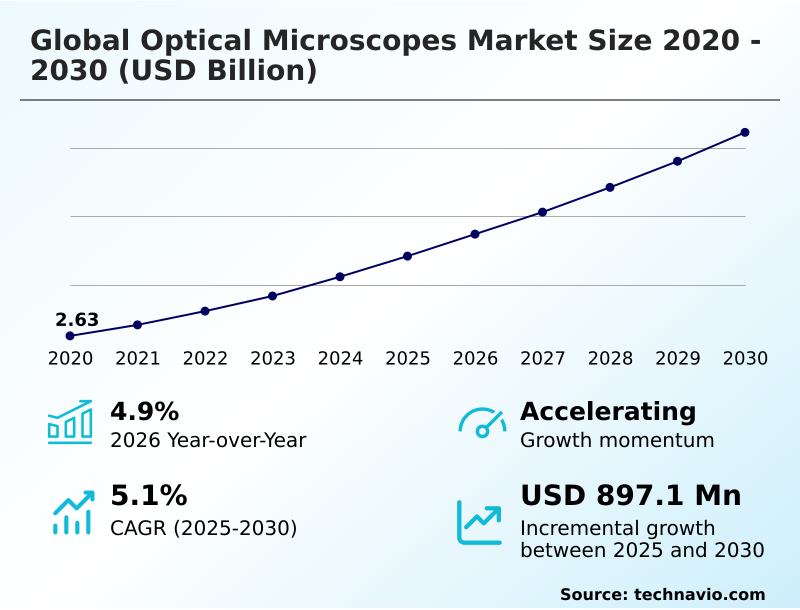
Get Key Insights on Market Forecast (PDF) Get Free Sample

How is the Optical Microscopes Market Segmented?

The optical microscopes industry research report provides comprehensive data (region-wise segment analysis), with forecasts and estimates in "USD million" for the period 2026-2030, as well as historical data from 2020-2024 for the following segments.

  • Product
    • Stereo microscopes
    • Inverted microscopes
    • Digital microscopes
    • Accessories
    • Others
  • Application
    • Healthcare
    • Material and semiconductors
  • End-user
    • Hospitals and clinics
    • Academic
    • Pharma and biotech companies
    • Diagnostic laboratories
    • Others
  • Geography
    • North America
      • US
      • Canada
      • Mexico
    • Asia
      • China
      • India
      • Japan
      • South Korea
      • Indonesia
      • Thailand
    • Europe
      • Germany
      • UK
      • France
      • Italy
      • Spain
      • The Netherlands
    • Rest of World (ROW)

By Product Insights

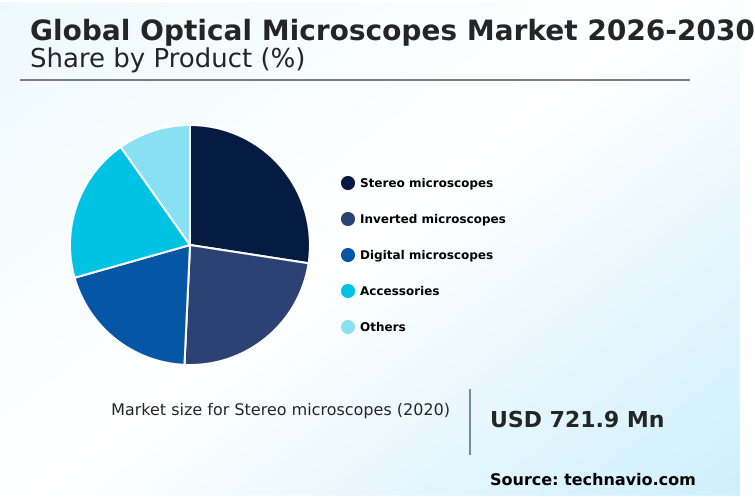
The stereo microscopes segment is estimated to witness significant growth during the forecast period.

Three-dimensional spatial visualization configurations hold a critical operational role in modern industrial and educational environments. These binocular and trinocular systems facilitate continuous precision assembly and macroscopic dissection tasks.

By integrating multi-angle solid-state illumination and ergonomic viewing heads, manufacturing facilities report a 15% improvement in microscopic soldering accuracy, substantially lowering operator fatigue during extended shifts. This structural adaptability proves essential for routine polarized light inspection across material science sectors.

As digital capabilities expand, these units increasingly feature high-resolution camera ports that enable seamless remote peer review and collaborative evaluation.

The transition from legacy manual setups to modular optical architectures ensures sustained utility, providing academic and industrial facilities with reliable, cost-effective visualization necessary for evaluating complex material integrity.
Get Free Sample

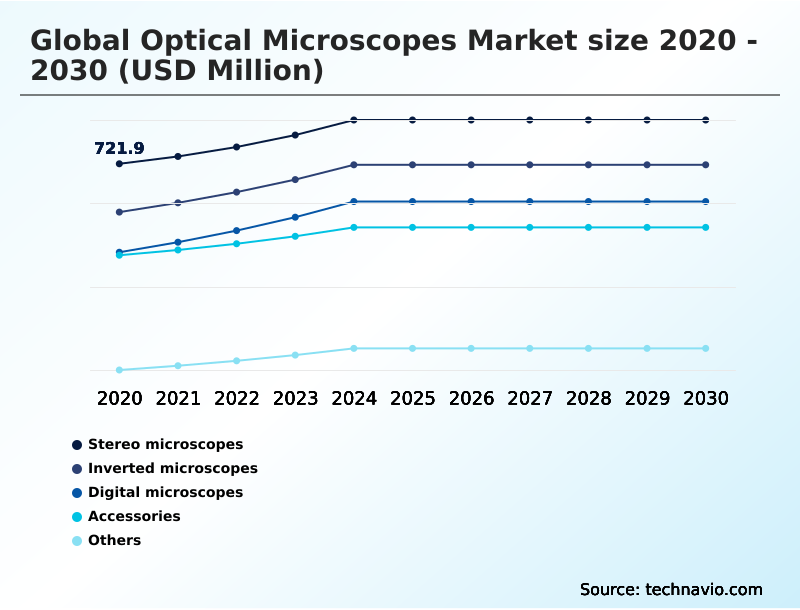
The Stereo microscopes segment was valued at USD 820.5 million in 2024 and showed a gradual increase during the forecast period.
Get Free Sample

Regional Analysis

Asia is estimated to contribute 34.7% to the growth of the global market during the forecast period.Technavio’s analysts have elaborately explained the regional trends and drivers that shape the market during the forecast period.

See How Optical Microscopes Market Demand is Rising in Asia Get Free Sample

The geographic landscape for Optical Microscopes reveals distinct regional disparities driven by specialized industrial and clinical demands.

North America maintains a leading position, utilizing robust biotechnology infrastructure to achieve a 25% higher penetration rate of laser scanning modules compared to European laboratories.

This discrepancy stems from aggressive biomedical funding in the United States, which accelerates the deployment of high-content screening and three-dimensional cell models for precision medicine.

Conversely, the APAC region exhibits a rapid 30% increase in demand for automated semiconductor wafer inspection, propelled by surging consumer electronics manufacturing. This industrial prioritization in APAC reduces localized quality control bottlenecks by 18%.

Meanwhile, Europe focuses heavily on forensic evidence documentation and stringent medical compliance, balancing steady clinical replacement cycles with rigorous diagnostic standards, thereby ensuring a highly diversified baseline for advanced optical instrumentation across the continent.

Market Dynamics

Our researchers analyzed the data with 2025 as the base year, along with the key drivers, trends, and challenges. A holistic analysis of drivers will help companies refine their marketing strategies to gain a competitive advantage.

  • The functional application of advanced microscopy platforms continues to redefine operational efficiency across highly regulated scientific and industrial sectors. As diagnostic networks prioritize rapid data sharing and remote collaboration, the implementation of high resolution digital pathology scanning has transformed standard tissue evaluation.
  • This digital transition enables multi-site hospital networks to centralize diagnostic expertise, resulting in diagnostic turnaround times that are approximately 30% faster than traditional physical slide transport methods. Simultaneously, biopharmaceutical research laboratories rely heavily on automated live cell imaging configurations to continuously monitor dynamic cellular responses.
  • This uninterrupted observation is critical for evaluating therapeutic toxicity without compromising fragile biological structures and enabling continuous biomedical research applications. In the realm of advanced academic research, investments in super resolution structural biology visualization permit investigators to observe macromolecular complex observation at unprecedented scales, directly accelerating genomic discovery timelines.
  • Furthermore, the integration of non destructive semiconductor defect inspection tools within microelectronics manufacturing ensures that delicate silicon wafers maintain absolute structural integrity, drastically reducing costly post-production scrap rates. Legal and law enforcement agencies also benefit significantly from standardized optical workflows; polarized light forensic evidence examination provides indisputable, objective mineral and fiber analyses necessary for rigorous judicial compliance.
  • By bridging optical precision with automated digital environments, these specialized instruments continuously optimize long-term operational planning, resource allocation, and quality assurance frameworks.
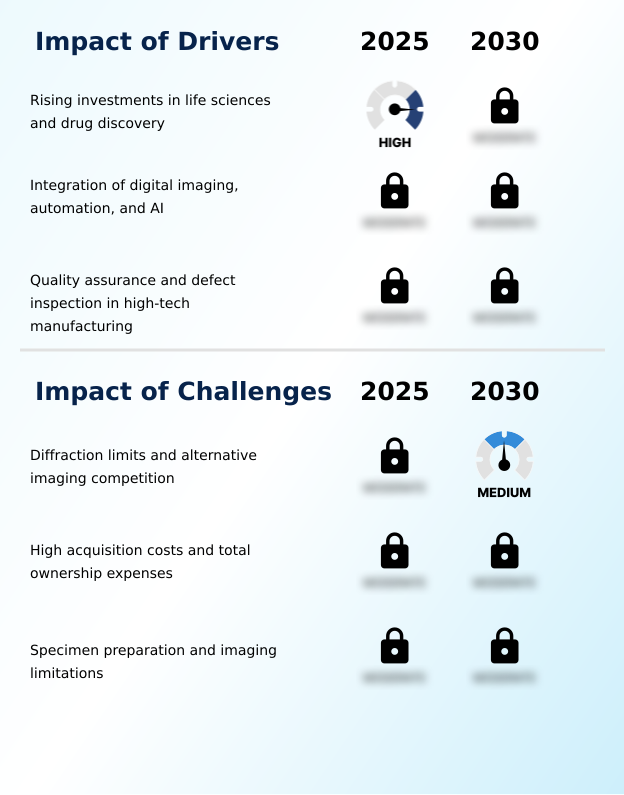
What are the key market drivers leading to the rise in the adoption of Optical Microscopes Industry?

  • Escalating capital allocations toward life sciences and intensive drug discovery programs serve as the primary catalyst propelling sustained global expansion.

  • The necessity for stringent quality assurance fundamentally drives the Optical Microscopes market, particularly within high-tech manufacturing sectors. Facilities utilizing advanced fluorescence visualization and motorized specimen stages report a 35% improvement in rapid defect inspection workflows.
  • Because progressive miniaturization mandates exact structural compliance, the integration of chromatic aberration correction optics directly enhances microelectronics assembly verification accuracy by 20%.
  • This structural evolution allows quality control engineers to detect microscopic anomalies earlier in the production cycle, thereby reducing costly manufacturing scrap rates by 15%.
  • Furthermore, the adoption of specialized objective lens aperture designs improves ambient evaluation conditions, ensuring non-destructive evaluation proceeds efficiently. Consequently, manufacturers achieve higher production yields and operational consistency without compromising on the speed required by modern assembly lines.

What are the market trends shaping the Optical Microscopes Industry?

  • Advancements in super-resolution optical systems represent a defining trajectory for future application capabilities. This evolution continuously expands the boundaries of molecular observation and analytical precision.

  • The Optical Microscopes market demonstrates continuous technological progression through the rapid adoption of super-resolution imaging and multiphoton excitation techniques. Laboratories transitioning to these advanced optical configurations observe a 40% enhancement in spatial resolution, allowing deeper cellular architecture analysis without destructive sample preparation.
  • This shift significantly accelerates drug discovery pipelines, as research institutions integrate digital slide scanning to streamline image acquisition workflows. Consequently, data processing times have decreased by 25%, drastically improving research throughput. As multidisciplinary investigations demand greater molecular precision, the implementation of automated focusing protocols enables facilities to reduce operator fatigue by 30%.
  • This modernization directly supports more reliable data output, ensuring structural biological observations remain consistent across diverse investigative applications without requiring extensive manual recalibration.

What challenges does the Optical Microscopes Industry face during its growth?

  • Inherent physical diffraction limits, compounded by aggressive competition from alternative high-resolution imaging modalities, constitute significant operational hurdles restricting broader commercial adoption.

  • Physical diffraction limits and complex specimen preparation pose significant operational constraints within the Optical Microscopes industry. Standard optical systems struggle to resolve details below 200 nanometers, driving a 15% reduction in workflow efficiency when handling dense biological samples. Furthermore, prolonged exposure during pathology sample evaluation often induces phototoxicity, which decreases live-cell viability by up to 30% during extended tracking.
  • Although integrating light-sheet fluorescence and confocal scanning mechanisms mitigates some light scattering artifacts, these premium hardware additions elevate initial laboratory capital expenditures by 45%. In industrial settings, opaque surfaces complicate grain boundary analysis, frequently requiring specialized illumination that slows throughput.
  • These fundamental optical barriers compel facilities to balance the high costs of sophisticated aberration compensation against the urgent need for reproducible, high-contrast visual data.

Exclusive Technavio Analysis on Customer Landscape

The optical microscopes market forecasting report includes the adoption lifecycle of the market, covering from the innovator’s stage to the laggard’s stage. It focuses on adoption rates in different regions based on penetration. Furthermore, the optical microscopes market report also includes key purchase criteria and drivers of price sensitivity to help companies evaluate and develop their market growth analysis strategies.
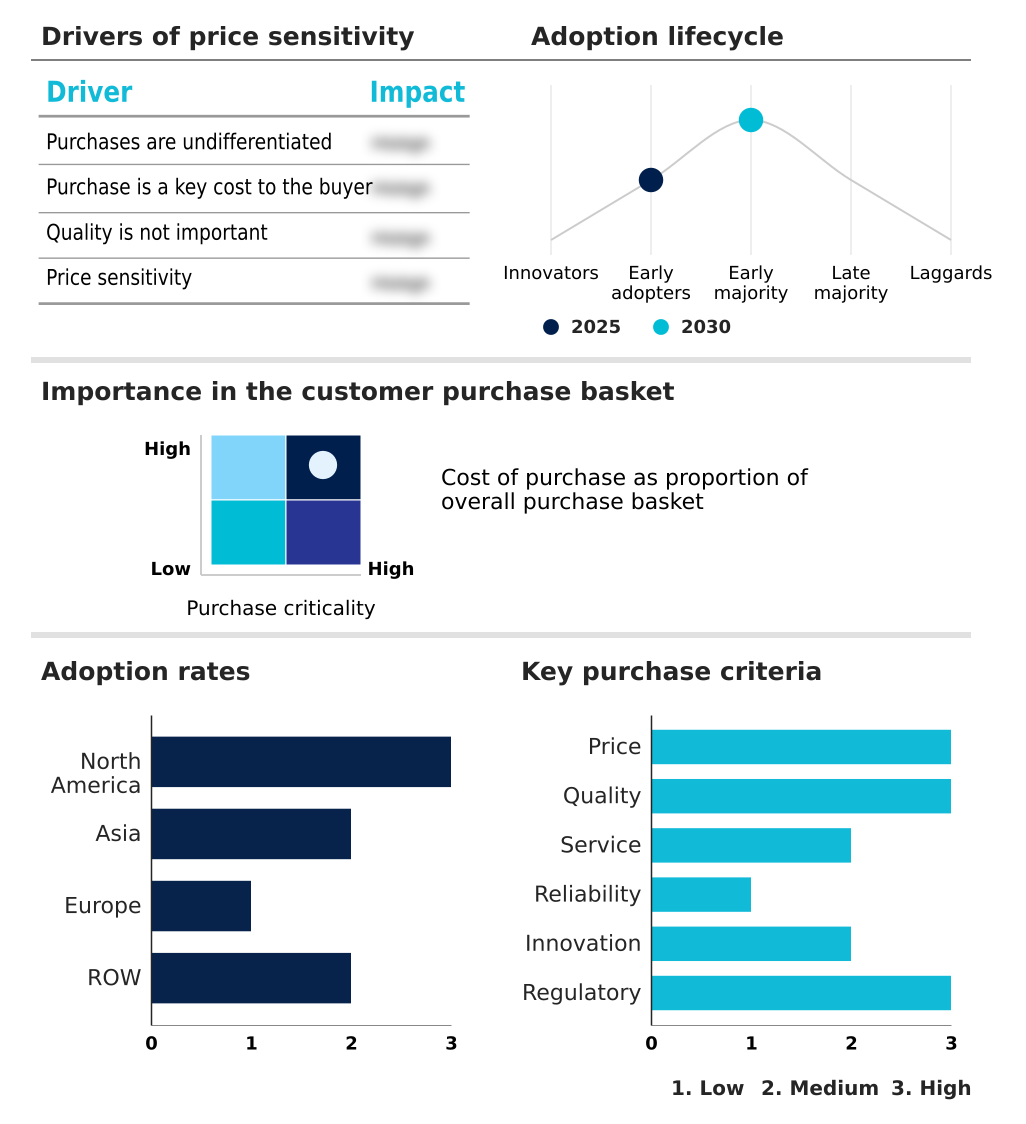
Customer Landscape of Optical Microscopes Industry

Competitive Landscape

Companies are implementing various strategies, such as strategic alliances, optical microscopes market forecast, partnerships, mergers and acquisitions, geographical expansion, and product/service launches, to enhance their presence in the industry.

ACCU SCOPE Inc. - The organization delivers advanced optical microscopy platforms integrating high-resolution digital imaging, motorized components, and specialized software to enhance structural visualization and diagnostic efficiency across multidisciplinary research applications.

The industry research and growth report includes detailed analyses of the competitive landscape of the market and information about key companies, including:

  • ACCU SCOPE Inc.
  • AnMo Electronics Corp.
  • Carl Zeiss AG
  • Etaluma Inc.
  • Euromex Microscopen BV
  • Evident Corp.
  • Hirox Co. Ltd.
  • KERN and SOHN GmbH
  • Keyence Corp.
  • Labomed Inc.
  • Leica Microsystems
  • Mitutoyo Corp.
  • Motic Inc
  • Nanolive SA
  • Nikon Corp.
  • Optika S.r.l.
  • Radical Scientific Equipments
  • Tagarno AS
  • Thorlabs Inc.
  • Vision Engineering Ltd.

Qualitative and quantitative analysis of companies has been conducted to help clients understand the wider business environment as well as the strengths and weaknesses of key industry players. Data is qualitatively analyzed to categorize companies as pure play, category-focused, industry-focused, and diversified; it is quantitatively analyzed to categorize companies as dominant, leading, strong, tentative, and weak.

Recent Development and News in Optical microscopes market

  • In the Health Care Equipment industry, the aggressive transition toward digitized clinical laboratory environments accelerated the adoption of automated image acquisition workflows, directly impacting Optical Microscopes demand by requiring seamless integration with cloud-based clinical diagnostic networks to reduce sample evaluation times by 20%.
  • Stringent regulatory compliance frameworks governing medical device manufacturing quality assurance mandated rigorous microscopic structural integrity checks, driving the procurement of high-resolution digital sensor platforms to improve non-destructive evaluation reliability by 15% across global production facilities.
  • The systemic shift toward personalized medicine and targeted oncology research stimulated the deployment of patient-derived organoids in biopharmaceutical screening, compelling laboratories to invest in three-dimensional cell models and multiphoton excitation capabilities to boost high-throughput cellular assays efficiency by 30%.
  • Global supply chain disruptions in precision lens manufacturing forced scientific equipment developers to localize specialized objective lens aperture production, altering Optical Microscopes supply dynamics and prompting a 12% increase in regionalized sourcing for advanced diagnostic imaging hardware.

Dive into Technavio’s robust research methodology, blending expert interviews, extensive data synthesis, and validated models for unparalleled Optical Microscopes Market insights. See full methodology.

Market Scope
Page number 308
Base year 2025
Historic period 2020-2024
Forecast period 2026-2030
Growth momentum & CAGR Accelerate at a CAGR of 5.1%
Market growth 2026-2030 USD 897.1 million
Market structure Fragmented
YoY growth 2025-2026(%) 4.9%
Key countries US, Canada, Mexico, China, India, Japan, South Korea, Indonesia, Thailand, Germany, UK, France, Italy, Spain, The Netherlands, Brazil, Saudi Arabia, UAE, Turkey, Argentina, Colombia, South Africa and Israel
Competitive landscape Leading Companies, Market Positioning of Companies, Competitive Strategies, and Industry Risks

Request Free Sample

Research Analyst Overview

  • The Optical Microscopes sector undergoes profound structural modernization as organizations increasingly prioritize automated analytical precision and data reproducibility. Corporate boardroom strategies heavily emphasize the integration of sophisticated optical platforms to maintain strict regulatory compliance and elevate quality assurance protocols.
  • For instance, transitioning from manual visual checks to platforms equipped with advanced digital sensor integration and differential interference contrast allows manufacturing facilities to identify sub-micron structural anomalies seamlessly. This transition yields a 25% reduction in manual inspection errors compared to legacy analog procedures, significantly enhancing operational reliability.
  • In the life sciences, managing delicate specimens during prolonged intracellular transport tracking remains a critical focus; implementing advanced photobleaching reduction techniques ensures the preservation of vital biological architectures. Furthermore, top-tier research institutes deploy structured illumination microscopy and stimulated emission depletion to surpass conventional diffraction barriers.
  • Coupled with intelligent spherical aberration mitigation, these cutting-edge optical geometries optimize long-term capital investments, enabling multidisciplinary laboratories to execute complex molecular evaluations without acquiring redundant magnification hardware.

What are the Key Data Covered in this Optical Microscopes Market Research and Growth Report?

  • What is the expected growth of the Optical Microscopes Market between 2026 and 2030?

    • USD 897.1 million, at a CAGR of 5.1%

  • What segmentation does the market report cover?

    • The report is segmented by Product (Stereo microscopes, Inverted microscopes, Digital microscopes, Accessories, and Others), Application (Healthcare, and Material and semiconductors), End-user (Hospitals and clinics, Academic, Pharma and biotech companies, Diagnostic laboratories, and Others) and Geography (North America, Asia, Europe, Rest of World (ROW))

  • Which regions are analyzed in the report?

    • North America, Asia, Europe and Rest of World (ROW)

  • What are the key growth drivers and market challenges?

    • Rising investments in life sciences and drug discovery, Diffraction limits and alternative imaging competition

  • Who are the major players in the Optical Microscopes Market?

    • ACCU SCOPE Inc., AnMo Electronics Corp., Carl Zeiss AG, Etaluma Inc., Euromex Microscopen BV, Evident Corp., Hirox Co. Ltd., KERN and SOHN GmbH, Keyence Corp., Labomed Inc., Leica Microsystems, Mitutoyo Corp., Motic Inc, Nanolive SA, Nikon Corp., Optika S.r.l., Radical Scientific Equipments, Tagarno AS, Thorlabs Inc. and Vision Engineering Ltd.

Market Research Insights

  • The Optical Microscopes market is rapidly transitioning from qualitative visual observation into sophisticated quantitative measurement science. Modern industrial and clinical laboratories increasingly rely on automated digital platforms to accelerate high-throughput cellular assays. By integrating energy-efficient fluorescent light sources, diagnostic facilities have achieved a 25% thermal emission reduction, preserving the viability of delicate live biological specimens during prolonged studies.
  • Furthermore, the adoption of intelligent image analysis algorithms has enhanced structural defect identification precision by 18%, substantially lowering long-term operational costs for semiconductor manufacturers. This integration of software and precision optics drives a 22% improvement in overall laboratory throughput, ensuring higher compliance alignment and robust return on investment for institutions upgrading legacy manual equipment.

We can help! Our analysts can customize this optical microscopes market research report to meet your requirements.

Get in touch

1. Executive Summary

1.1 Market overview

Executive Summary - Chart on Market Overview
Executive Summary - Data Table on Market Overview
Executive Summary - Chart on Global Market Characteristics
Executive Summary - Chart on Market by Geography
Executive Summary - Chart on Market Segmentation by Product
Executive Summary - Chart on Market Segmentation by Application
Executive Summary - Chart on Market Segmentation by End-user
Executive Summary - Chart on Incremental Growth
Executive Summary - Data Table on Incremental Growth
Executive Summary - Chart on Company Market Positioning

2. Technavio Analysis

2.1 Analysis of price sensitivity, lifecycle, customer purchase basket, adoption rates, and purchase criteria

2.2 Criticality of inputs and Factors of differentiation

Chart on Overview on criticality of inputs and factors of differentiation

2.3 Factors of disruption

Chart on Overview on factors of disruption

2.4 Impact of drivers and challenges

Chart on Impact of drivers and challenges in 2025 and 2030

3. Market Landscape

3.1 Market ecosystem

Chart on Parent Market
Data Table on - Parent Market

3.2 Market characteristics

Chart on Market characteristics analysis

3.3 Value chain analysis

Chart on Value chain analysis

4. Market Sizing

4.1 Market definition

Data Table on Offerings of companies included in the market definition

4.2 Market segment analysis

Market segments

4.3 Market size 2025

4.4 Market outlook: Forecast for 2025-2030

Chart on Global - Market size and forecast 2025-2030 ($ million)
Data Table on Global - Market size and forecast 2025-2030 ($ million)
Chart on Global Market: Year-over-year growth 2025-2030 (%)
Data Table on Global Market: Year-over-year growth 2025-2030 (%)

5. Historic Market Size

5.1 Global Optical Microscopes Market 2020 - 2024

Historic Market Size - Data Table on Global Optical Microscopes Market 2020 - 2024 ($ million)

5.2 Product segment analysis 2020 - 2024

Historic Market Size - Product Segment 2020 - 2024 ($ million)

5.3 Application segment analysis 2020 - 2024

Historic Market Size - Application Segment 2020 - 2024 ($ million)

5.4 End-user segment analysis 2020 - 2024

Historic Market Size - End-user Segment 2020 - 2024 ($ million)

5.5 Geography segment analysis 2020 - 2024

Historic Market Size - Geography Segment 2020 - 2024 ($ million)

5.6 Country segment analysis 2020 - 2024

Historic Market Size - Country Segment 2020 - 2024 ($ million)

6. Qualitative Analysis

6.1 Impact of AI on Global Optical Microscopes Market

6.2 Impact of Geopolitical Conflicts on Global Optical Microscopes Market

7. Five Forces Analysis

7.1 Five forces summary

Five forces analysis - Comparison between 2025 and 2030

7.2 Bargaining power of buyers

Bargaining power of buyers - Impact of key factors 2025 and 2030

7.3 Bargaining power of suppliers

Bargaining power of suppliers - Impact of key factors in 2025 and 2030

7.4 Threat of new entrants

Threat of new entrants - Impact of key factors in 2025 and 2030

7.5 Threat of substitutes

Threat of substitutes - Impact of key factors in 2025 and 2030

7.6 Threat of rivalry

Threat of rivalry - Impact of key factors in 2025 and 2030

7.7 Market condition

Chart on Market condition - Five forces 2025 and 2030

8. Market Segmentation by Product

8.1 Market segments

Chart on Product - Market share 2025-2030 (%)
Data Table on Product - Market share 2025-2030 (%)

8.2 Comparison by Product

Chart on Comparison by Product
Data Table on Comparison by Product

8.3 Stereo microscopes - Market size and forecast 2025-2030

Chart on Stereo microscopes - Market size and forecast 2025-2030 ($ million)
Data Table on Stereo microscopes - Market size and forecast 2025-2030 ($ million)
Chart on Stereo microscopes - Year-over-year growth 2025-2030 (%)
Data Table on Stereo microscopes - Year-over-year growth 2025-2030 (%)

8.4 Inverted microscopes - Market size and forecast 2025-2030

Chart on Inverted microscopes - Market size and forecast 2025-2030 ($ million)
Data Table on Inverted microscopes - Market size and forecast 2025-2030 ($ million)
Chart on Inverted microscopes - Year-over-year growth 2025-2030 (%)
Data Table on Inverted microscopes - Year-over-year growth 2025-2030 (%)

8.5 Digital microscopes - Market size and forecast 2025-2030

Chart on Digital microscopes - Market size and forecast 2025-2030 ($ million)
Data Table on Digital microscopes - Market size and forecast 2025-2030 ($ million)
Chart on Digital microscopes - Year-over-year growth 2025-2030 (%)
Data Table on Digital microscopes - Year-over-year growth 2025-2030 (%)

8.6 Accessories - Market size and forecast 2025-2030

Chart on Accessories - Market size and forecast 2025-2030 ($ million)
Data Table on Accessories - Market size and forecast 2025-2030 ($ million)
Chart on Accessories - Year-over-year growth 2025-2030 (%)
Data Table on Accessories - Year-over-year growth 2025-2030 (%)

8.7 Others - Market size and forecast 2025-2030

Chart on Others - Market size and forecast 2025-2030 ($ million)
Data Table on Others - Market size and forecast 2025-2030 ($ million)
Chart on Others - Year-over-year growth 2025-2030 (%)
Data Table on Others - Year-over-year growth 2025-2030 (%)

8.8 Market opportunity by Product

Market opportunity by Product ($ million)
Data Table on Market opportunity by Product ($ million)

9. Market Segmentation by Application

9.1 Market segments

Chart on Application - Market share 2025-2030 (%)
Data Table on Application - Market share 2025-2030 (%)

9.2 Comparison by Application

Chart on Comparison by Application
Data Table on Comparison by Application

9.3 Healthcare - Market size and forecast 2025-2030

Chart on Healthcare - Market size and forecast 2025-2030 ($ million)
Data Table on Healthcare - Market size and forecast 2025-2030 ($ million)
Chart on Healthcare - Year-over-year growth 2025-2030 (%)
Data Table on Healthcare - Year-over-year growth 2025-2030 (%)

9.4 Material and semiconductors - Market size and forecast 2025-2030

Chart on Material and semiconductors - Market size and forecast 2025-2030 ($ million)
Data Table on Material and semiconductors - Market size and forecast 2025-2030 ($ million)
Chart on Material and semiconductors - Year-over-year growth 2025-2030 (%)
Data Table on Material and semiconductors - Year-over-year growth 2025-2030 (%)

9.5 Market opportunity by Application

Market opportunity by Application ($ million)
Data Table on Market opportunity by Application ($ million)

10. Market Segmentation by End-user

10.1 Market segments

Chart on End-user - Market share 2025-2030 (%)
Data Table on End-user - Market share 2025-2030 (%)

10.2 Comparison by End-user

Chart on Comparison by End-user
Data Table on Comparison by End-user

10.3 Hospitals and clinics - Market size and forecast 2025-2030

Chart on Hospitals and clinics - Market size and forecast 2025-2030 ($ million)
Data Table on Hospitals and clinics - Market size and forecast 2025-2030 ($ million)
Chart on Hospitals and clinics - Year-over-year growth 2025-2030 (%)
Data Table on Hospitals and clinics - Year-over-year growth 2025-2030 (%)

10.4 Academic - Market size and forecast 2025-2030

Chart on Academic - Market size and forecast 2025-2030 ($ million)
Data Table on Academic - Market size and forecast 2025-2030 ($ million)
Chart on Academic - Year-over-year growth 2025-2030 (%)
Data Table on Academic - Year-over-year growth 2025-2030 (%)

10.5 Pharma and biotech companies - Market size and forecast 2025-2030

Chart on Pharma and biotech companies - Market size and forecast 2025-2030 ($ million)
Data Table on Pharma and biotech companies - Market size and forecast 2025-2030 ($ million)
Chart on Pharma and biotech companies - Year-over-year growth 2025-2030 (%)
Data Table on Pharma and biotech companies - Year-over-year growth 2025-2030 (%)

10.6 Diagnostic laboratories - Market size and forecast 2025-2030

Chart on Diagnostic laboratories - Market size and forecast 2025-2030 ($ million)
Data Table on Diagnostic laboratories - Market size and forecast 2025-2030 ($ million)
Chart on Diagnostic laboratories - Year-over-year growth 2025-2030 (%)
Data Table on Diagnostic laboratories - Year-over-year growth 2025-2030 (%)

10.7 Others - Market size and forecast 2025-2030

Chart on Others - Market size and forecast 2025-2030 ($ million)
Data Table on Others - Market size and forecast 2025-2030 ($ million)
Chart on Others - Year-over-year growth 2025-2030 (%)
Data Table on Others - Year-over-year growth 2025-2030 (%)

10.8 Market opportunity by End-user

Market opportunity by End-user ($ million)
Data Table on Market opportunity by End-user ($ million)

11. Customer Landscape

11.1 Customer landscape overview

Analysis of price sensitivity, lifecycle, customer purchase basket, adoption rates, and purchase criteria

12. Geographic Landscape

12.1 Geographic segmentation

Chart on Market share by geography 2025-2030 (%)
Data Table on Market share by geography 2025-2030 (%)

12.2 Geographic comparison

Chart on Geographic comparison
Data Table on Geographic comparison

12.3 North America - Market size and forecast 2025-2030

Chart on North America - Market size and forecast 2025-2030 ($ million)
Data Table on North America - Market size and forecast 2025-2030 ($ million)
Chart on North America - Year-over-year growth 2025-2030 (%)
Data Table on North America - Year-over-year growth 2025-2030 (%)
Chart on Regional Comparison - North America
Data Table on Regional Comparison - North America

12.3.1 US - Market size and forecast 2025-2030

Chart on US - Market size and forecast 2025-2030 ($ million)
Data Table on US - Market size and forecast 2025-2030 ($ million)
Chart on US - Year-over-year growth 2025-2030 (%)
Data Table on US - Year-over-year growth 2025-2030 (%)

12.3.2 Canada - Market size and forecast 2025-2030

Chart on Canada - Market size and forecast 2025-2030 ($ million)
Data Table on Canada - Market size and forecast 2025-2030 ($ million)
Chart on Canada - Year-over-year growth 2025-2030 (%)
Data Table on Canada - Year-over-year growth 2025-2030 (%)

12.3.3 Mexico - Market size and forecast 2025-2030

Chart on Mexico - Market size and forecast 2025-2030 ($ million)
Data Table on Mexico - Market size and forecast 2025-2030 ($ million)
Chart on Mexico - Year-over-year growth 2025-2030 (%)
Data Table on Mexico - Year-over-year growth 2025-2030 (%)

12.4 Asia - Market size and forecast 2025-2030

Chart on Asia - Market size and forecast 2025-2030 ($ million)
Data Table on Asia - Market size and forecast 2025-2030 ($ million)
Chart on Asia - Year-over-year growth 2025-2030 (%)
Data Table on Asia - Year-over-year growth 2025-2030 (%)
Chart on Regional Comparison - Asia
Data Table on Regional Comparison - Asia

12.4.1 China - Market size and forecast 2025-2030

Chart on China - Market size and forecast 2025-2030 ($ million)
Data Table on China - Market size and forecast 2025-2030 ($ million)
Chart on China - Year-over-year growth 2025-2030 (%)
Data Table on China - Year-over-year growth 2025-2030 (%)

12.4.2 India - Market size and forecast 2025-2030

Chart on India - Market size and forecast 2025-2030 ($ million)
Data Table on India - Market size and forecast 2025-2030 ($ million)
Chart on India - Year-over-year growth 2025-2030 (%)
Data Table on India - Year-over-year growth 2025-2030 (%)

12.4.3 Japan - Market size and forecast 2025-2030

Chart on Japan - Market size and forecast 2025-2030 ($ million)
Data Table on Japan - Market size and forecast 2025-2030 ($ million)
Chart on Japan - Year-over-year growth 2025-2030 (%)
Data Table on Japan - Year-over-year growth 2025-2030 (%)

12.4.4 South Korea - Market size and forecast 2025-2030

Chart on South Korea - Market size and forecast 2025-2030 ($ million)
Data Table on South Korea - Market size and forecast 2025-2030 ($ million)
Chart on South Korea - Year-over-year growth 2025-2030 (%)
Data Table on South Korea - Year-over-year growth 2025-2030 (%)

12.4.5 Indonesia - Market size and forecast 2025-2030

Chart on Indonesia - Market size and forecast 2025-2030 ($ million)
Data Table on Indonesia - Market size and forecast 2025-2030 ($ million)
Chart on Indonesia - Year-over-year growth 2025-2030 (%)
Data Table on Indonesia - Year-over-year growth 2025-2030 (%)

12.4.6 Thailand - Market size and forecast 2025-2030

Chart on Thailand - Market size and forecast 2025-2030 ($ million)
Data Table on Thailand - Market size and forecast 2025-2030 ($ million)
Chart on Thailand - Year-over-year growth 2025-2030 (%)
Data Table on Thailand - Year-over-year growth 2025-2030 (%)

12.5 Europe - Market size and forecast 2025-2030

Chart on Europe - Market size and forecast 2025-2030 ($ million)
Data Table on Europe - Market size and forecast 2025-2030 ($ million)
Chart on Europe - Year-over-year growth 2025-2030 (%)
Data Table on Europe - Year-over-year growth 2025-2030 (%)
Chart on Regional Comparison - Europe
Data Table on Regional Comparison - Europe

12.5.1 Germany - Market size and forecast 2025-2030

Chart on Germany - Market size and forecast 2025-2030 ($ million)
Data Table on Germany - Market size and forecast 2025-2030 ($ million)
Chart on Germany - Year-over-year growth 2025-2030 (%)
Data Table on Germany - Year-over-year growth 2025-2030 (%)

12.5.2 UK - Market size and forecast 2025-2030

Chart on UK - Market size and forecast 2025-2030 ($ million)
Data Table on UK - Market size and forecast 2025-2030 ($ million)
Chart on UK - Year-over-year growth 2025-2030 (%)
Data Table on UK - Year-over-year growth 2025-2030 (%)

12.5.3 France - Market size and forecast 2025-2030

Chart on France - Market size and forecast 2025-2030 ($ million)
Data Table on France - Market size and forecast 2025-2030 ($ million)
Chart on France - Year-over-year growth 2025-2030 (%)
Data Table on France - Year-over-year growth 2025-2030 (%)

12.5.4 Italy - Market size and forecast 2025-2030

Chart on Italy - Market size and forecast 2025-2030 ($ million)
Data Table on Italy - Market size and forecast 2025-2030 ($ million)
Chart on Italy - Year-over-year growth 2025-2030 (%)
Data Table on Italy - Year-over-year growth 2025-2030 (%)

12.5.5 Spain - Market size and forecast 2025-2030

Chart on Spain - Market size and forecast 2025-2030 ($ million)
Data Table on Spain - Market size and forecast 2025-2030 ($ million)
Chart on Spain - Year-over-year growth 2025-2030 (%)
Data Table on Spain - Year-over-year growth 2025-2030 (%)

12.5.6 The Netherlands - Market size and forecast 2025-2030

Chart on The Netherlands - Market size and forecast 2025-2030 ($ million)
Data Table on The Netherlands - Market size and forecast 2025-2030 ($ million)
Chart on The Netherlands - Year-over-year growth 2025-2030 (%)
Data Table on The Netherlands - Year-over-year growth 2025-2030 (%)

12.6 Rest of World (ROW) - Market size and forecast 2025-2030

Chart on Rest of World (ROW) - Market size and forecast 2025-2030 ($ million)
Data Table on Rest of World (ROW) - Market size and forecast 2025-2030 ($ million)
Chart on Rest of World (ROW) - Year-over-year growth 2025-2030 (%)
Data Table on Rest of World (ROW) - Year-over-year growth 2025-2030 (%)
Chart on Regional Comparison - Rest of World (ROW)
Data Table on Regional Comparison - Rest of World (ROW)

12.6.1 Brazil - Market size and forecast 2025-2030

Chart on Brazil - Market size and forecast 2025-2030 ($ million)
Data Table on Brazil - Market size and forecast 2025-2030 ($ million)
Chart on Brazil - Year-over-year growth 2025-2030 (%)
Data Table on Brazil - Year-over-year growth 2025-2030 (%)

12.6.2 Saudi Arabia - Market size and forecast 2025-2030

Chart on Saudi Arabia - Market size and forecast 2025-2030 ($ million)
Data Table on Saudi Arabia - Market size and forecast 2025-2030 ($ million)
Chart on Saudi Arabia - Year-over-year growth 2025-2030 (%)
Data Table on Saudi Arabia - Year-over-year growth 2025-2030 (%)

12.6.3 UAE - Market size and forecast 2025-2030

Chart on UAE - Market size and forecast 2025-2030 ($ million)
Data Table on UAE - Market size and forecast 2025-2030 ($ million)
Chart on UAE - Year-over-year growth 2025-2030 (%)
Data Table on UAE - Year-over-year growth 2025-2030 (%)

12.6.4 Turkey - Market size and forecast 2025-2030

Chart on Turkey - Market size and forecast 2025-2030 ($ million)
Data Table on Turkey - Market size and forecast 2025-2030 ($ million)
Chart on Turkey - Year-over-year growth 2025-2030 (%)
Data Table on Turkey - Year-over-year growth 2025-2030 (%)

12.6.5 Argentina - Market size and forecast 2025-2030

Chart on Argentina - Market size and forecast 2025-2030 ($ million)
Data Table on Argentina - Market size and forecast 2025-2030 ($ million)
Chart on Argentina - Year-over-year growth 2025-2030 (%)
Data Table on Argentina - Year-over-year growth 2025-2030 (%)

12.6.6 Colombia - Market size and forecast 2025-2030

Chart on Colombia - Market size and forecast 2025-2030 ($ million)
Data Table on Colombia - Market size and forecast 2025-2030 ($ million)
Chart on Colombia - Year-over-year growth 2025-2030 (%)
Data Table on Colombia - Year-over-year growth 2025-2030 (%)

12.6.7 South Africa - Market size and forecast 2025-2030

Chart on South Africa - Market size and forecast 2025-2030 ($ million)
Data Table on South Africa - Market size and forecast 2025-2030 ($ million)
Chart on South Africa - Year-over-year growth 2025-2030 (%)
Data Table on South Africa - Year-over-year growth 2025-2030 (%)

12.6.8 Israel - Market size and forecast 2025-2030

Chart on Israel - Market size and forecast 2025-2030 ($ million)
Data Table on Israel - Market size and forecast 2025-2030 ($ million)
Chart on Israel - Year-over-year growth 2025-2030 (%)
Data Table on Israel - Year-over-year growth 2025-2030 (%)

12.7 Market opportunity by geography

Market opportunity by geography ($ million)
Data Tables on Market opportunity by geography ($ million)

13. Drivers, Challenges, and Opportunity

13.1 Market drivers

Rising investments in life sciences and drug discovery
Integration of digital imaging, automation, and AI
Quality assurance and defect inspection in high-tech manufacturing

13.2 Market challenges

Diffraction limits and alternative imaging competition
High acquisition costs and total ownership expenses
Specimen preparation and imaging limitations

13.3 Impact of drivers and challenges

Impact of drivers and challenges in 2025 and 2030

13.4 Market opportunities

Advancements in super-resolution optical systems
Growing use of comparative and polarized microscopy
Shift to solid-state illumination and ergonomic designs

14. Competitive Landscape

14.1 Overview

14.2

Overview on criticality of inputs and factors of differentiation

14.3 Landscape disruption

Overview on factors of disruption

14.4 Industry risks

Impact of key risks on business

15. Competitive Analysis

15.1 Companies profiled

Companies covered

15.2 Company ranking index

15.3 Market positioning of companies

Matrix on companies position and classification

15.4 AnMo Electronics Corp.

AnMo Electronics Corp. - Overview
AnMo Electronics Corp. - Product / Service
AnMo Electronics Corp. - Key offerings
SWOT

15.5 Carl Zeiss AG

Carl Zeiss AG - Overview
Carl Zeiss AG - Product / Service
Carl Zeiss AG - Key offerings
SWOT

15.6 Euromex Microscopen BV

Euromex Microscopen BV - Overview
Euromex Microscopen BV - Product / Service
Euromex Microscopen BV - Key offerings
SWOT

15.7 Evident Corp.

Evident Corp. - Overview
Evident Corp. - Product / Service
Evident Corp. - Key offerings
SWOT

15.8 Hirox Co. Ltd.

Hirox Co. Ltd. - Overview
Hirox Co. Ltd. - Product / Service
Hirox Co. Ltd. - Key offerings
SWOT

15.9 KERN and SOHN GmbH

KERN and SOHN GmbH - Overview
KERN and SOHN GmbH - Product / Service
KERN and SOHN GmbH - Key offerings
SWOT

15.10 Keyence Corp.

Keyence Corp. - Overview
Keyence Corp. - Product / Service
Keyence Corp. - Key offerings
SWOT

15.11 Leica Microsystems

Leica Microsystems - Overview
Leica Microsystems - Product / Service
Leica Microsystems - Key offerings
SWOT

15.12 Mitutoyo Corp.

Mitutoyo Corp. - Overview
Mitutoyo Corp. - Product / Service
Mitutoyo Corp. - Key offerings
SWOT

15.13 Motic Inc

Motic Inc - Overview
Motic Inc - Product / Service
Motic Inc - Key offerings
SWOT

15.14 Nikon Corp.

Nikon Corp. - Overview
Nikon Corp. - Business segments
Nikon Corp. - Key offerings
Nikon Corp. - Segment focus
SWOT

15.15 Optika S.r.l.

Optika S.r.l. - Overview
Optika S.r.l. - Product / Service
Optika S.r.l. - Key offerings
SWOT

15.16 Radical Scientific Equipments

Radical Scientific Equipments - Overview
Radical Scientific Equipments - Product / Service
Radical Scientific Equipments - Key offerings
SWOT

15.17 Thorlabs Inc.

Thorlabs Inc. - Overview
Thorlabs Inc. - Product / Service
Thorlabs Inc. - Key offerings
SWOT

15.18 Vision Engineering Ltd.

Vision Engineering Ltd. - Overview
Vision Engineering Ltd. - Product / Service
Vision Engineering Ltd. - Key offerings
SWOT

16. Appendix

16.1 Scope of the report

Market definition
Objectives
Notes and caveats

16.2 Inclusions and exclusions checklist

Inclusions checklist
Exclusions checklist

16.3 Currency conversion rates for US$

16.4 Research methodology

16.5 Data procurement

Information sources

16.6 Data validation

16.7 Validation techniques employed for market sizing

16.8 Data synthesis

16.9 360 degree market analysis

16.10 List of abbreviations

Research Methodology

Technavio presents a detailed picture of the market by way of study, synthesis, and summation of data from multiple sources. The analysts have presented the various facets of the market with a particular focus on identifying the key industry influencers. The data thus presented is comprehensive, reliable, and the result of extensive research, both primary and secondary.

INFORMATION SOURCES

Primary sources

  • Manufacturers and suppliers
  • Channel partners
  • Industry experts
  • Strategic decision makers

Secondary sources

  • Industry journals and periodicals
  • Government data
  • Financial reports of key industry players
  • Historical data
  • Press releases

DATA ANALYSIS

Data Synthesis

  • Collation of data
  • Estimation of key figures
  • Analysis of derived insights

Data Validation

  • Triangulation with data models
  • Reference against proprietary databases
  • Corroboration with industry experts

REPORT WRITING

Qualitative

  • Market drivers
  • Market challenges
  • Market trends
  • Five forces analysis

Quantitative

  • Market size and forecast
  • Market segmentation
  • Geographical insights
  • Competitive landscape

Interested in this report?

Get your sample now to see our research methodology and insights!

Download Now

Frequently Asked Questions

Optical Microscopes market growth will increase by USD 897.1 million during 2026-2030.

The Optical Microscopes market is expected to grow at a CAGR of 5.1% during 2026-2030.

Optical Microscopes market is segmented by Product (Stereo microscopes, Inverted microscopes, Digital microscopes, Accessories, Others) Application (Healthcare, Material and semiconductors) End-user (Hospitals and clinics, Academic, Pharma and biotech companies, Diagnostic laboratories, Others)

ACCU SCOPE Inc., AnMo Electronics Corp., Carl Zeiss AG, Etaluma Inc., Euromex Microscopen BV, Evident Corp., Hirox Co. Ltd., KERN and SOHN GmbH, Keyence Corp., Labomed Inc., Leica Microsystems, Mitutoyo Corp., Motic Inc, Nanolive SA, Nikon Corp., Optika S.r.l., Radical Scientific Equipments, Tagarno AS, Thorlabs Inc., Vision Engineering Ltd. are a few of the key vendors in the Optical Microscopes market.

Asia will register the highest growth rate of 34.7% among the other regions. Therefore, the Optical Microscopes market in Asia is expected to garner significant business opportunities for the vendors during the forecast period.

US, Canada, Mexico, China, India, Japan, South Korea, Indonesia, Thailand, Germany, UK, France, Italy, Spain, The Netherlands, Brazil, Saudi Arabia, UAE, Turkey, Argentina, Colombia, South Africa, Israel

  • Rising investments in life sciences and drug discovery is the driving factor this market.

The Optical Microscopes market vendors should focus on grabbing business opportunities from the Product segment as it accounted for the largest market share in the base year.
RIA - Research AI Assistant
Ask RIA