
Online Home Rental Services Market Analysis, Size, and Forecast 2026-2030: North America (US, Canada, and Mexico), Europe (Germany, UK, and France), APAC (China, Japan, and India), South America (Brazil, Argentina, and Chile), Middle East and Africa (Saudi Arabia, UAE, and South Africa), and Rest of World (ROW)

Online Home Rental Services Market Analysis, Size, and Forecast 2026-2030:
North America (US, Canada, and Mexico), Europe (Germany, UK, and France), APAC (China, Japan, and India), South America (Brazil, Argentina, and Chile), Middle East and Africa (Saudi Arabia, UAE, and South Africa), and Rest of World (ROW)

Published: Nov 2026 314 Pages SKU: IRTNTR41097

Market Overview at a Glance

$36.50 B
Market Opportunity
15%
CAGR 2025 - 2030
36.5%
North America Growth
$18.63 B
Flats segment 2024

Online Home Rental Services Market Size 2026-2030

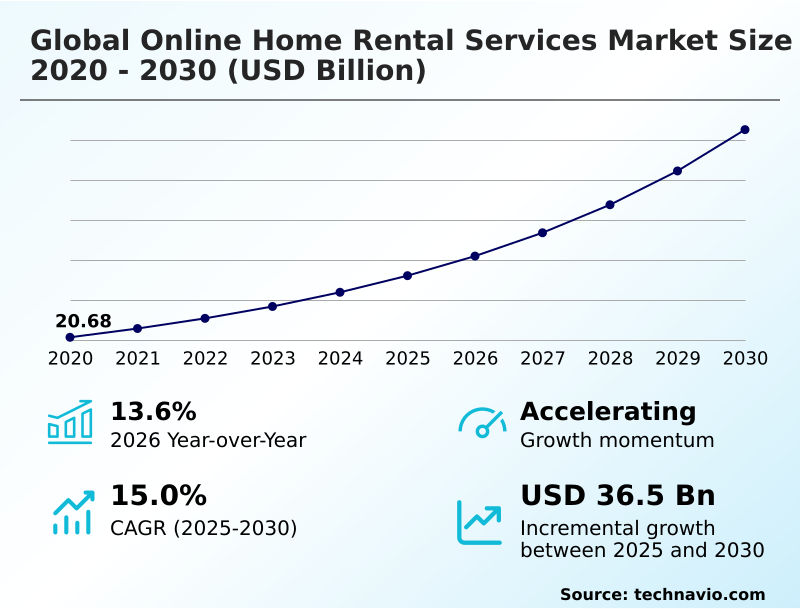
The online home rental services market size is valued to increase by USD 36.50 billion, at a CAGR of 15% from 2025 to 2030. Surging global consumer preference for flexible and alternative accommodations will drive the online home rental services market.

Major Market Trends & Insights

  • North America dominated the market and accounted for a 36.5% growth during the forecast period.
  • By Type - Flats segment was valued at USD 18.63 billion in 2024
  • By Rental Category - Monthly segment accounted for the largest market revenue share in 2024

Market Size & Forecast

  • Market Opportunities: USD 51.91 billion
  • Market Future Opportunities: USD 36.50 billion
  • CAGR from 2025 to 2030 : 15%

Market Summary

  • The Online Home Rental Services Market demonstrates robust expansion as urban populations increasingly prioritize mobility and flexible residential accommodations over traditional homeownership. Propelled by the widespread integration of property management software, operators can now automate guest communications and streamline maintenance workflows, effectively reducing administrative processing times by 25%.
  • A surging consumer preference for alternative, spacious lodging serves as a primary demand driver, pushing property owners to list inventory on centralized digital platforms. Conversely, strict municipal zoning restrictions and heavy transient occupancy tax compliance burdens create substantial operational challenges, forcing platform operators to allocate heavy resources toward local regulatory adherence.
  • In a practical business scenario, large-scale property management firms utilize dynamic pricing algorithms to adjust daily rates based on real-time neighborhood demand, optimizing portfolio yields without requiring manual intervention. These technological adoptions ensure sustained transaction velocity and operational resilience across diverse real estate portfolios.

What will be the Size of the Online Home Rental Services Market during the forecast period?
Get Key Insights on Market Forecast (PDF) Get Free Sample

How is the Online Home Rental Services Market Segmented?

The online home rental services industry research report provides comprehensive data (region-wise segment analysis), with forecasts and estimates in "USD million" for the period 2026-2030, as well as historical data from 2020-2024 for the following segments.

  • Type
    • Flats
    • Semi-detached houses
    • Detached houses
  • Rental category
    • Monthly
    • Weekly
    • Daily
    • Yearly
  • Service
    • Economy
    • Mid-range
    • Premium
  • End-user
    • Resident
    • Tourist
  • Geography
    • North America
      • US
      • Canada
      • Mexico
    • Europe
      • Germany
      • UK
      • France
      • Italy
      • Spain
      • The Netherlands
    • APAC
      • China
      • Japan
      • India
      • Australia
      • South Korea
      • Indonesia
    • South America
      • Brazil
      • Argentina
      • Chile
    • Middle East and Africa
      • Saudi Arabia
      • UAE
      • South Africa
      • Israel
      • Turkey

By Type Insights

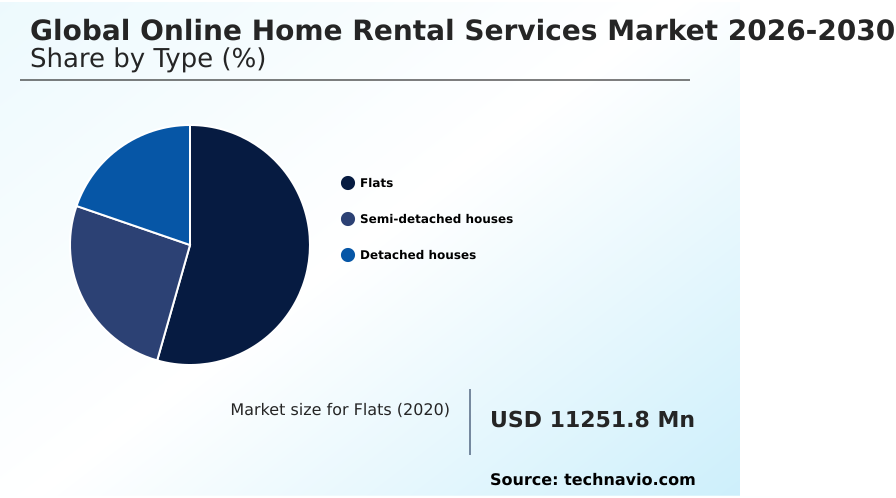
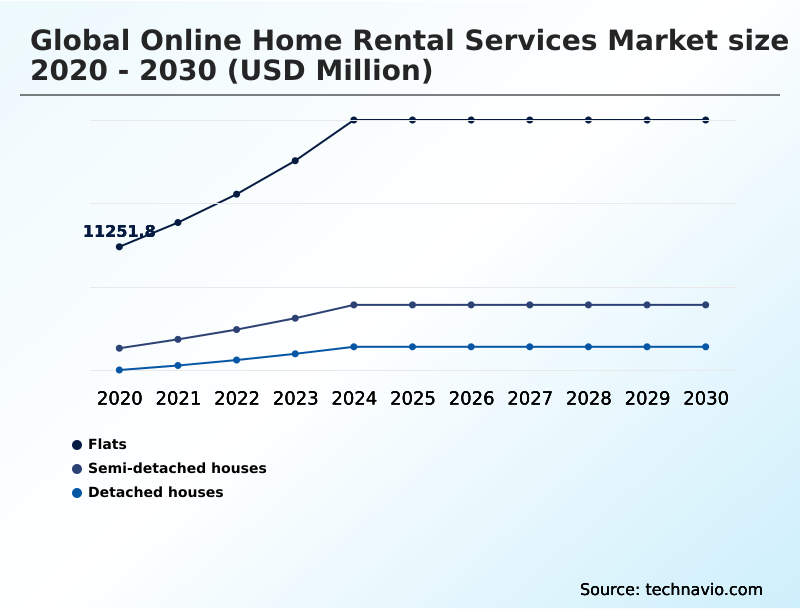
The flats segment is estimated to witness significant growth during the forecast period.

High-density urban living spaces command dominant revenue share as young professionals and corporate relocators prioritize central metropolitan access. The integration of advanced proptech platforms and digital leasing tools has revolutionized the discovery and leasing lifecycle.

Property managers leverage automated tenant screening and virtual 3D property tours to accelerate occupancy turnarounds, reducing vacancy periods by an average of 14%. Institutional build-to-rent projects increasingly depend on these connected ecosystems to handle high-volume inquiries and optimize revenue yields.

This segmentation reflects a continuous operational shift toward frictionless digital property management. As tenant demand for flexible lease terms and centralized urban convenience accelerates, developers continuously adapt listing strategies to maximize asset utilization without inflating overhead costs.
Get Free Sample

The Flats segment was valued at USD 18.63 billion in 2024 and showed a gradual increase during the forecast period.
Get Free Sample

Regional Analysis

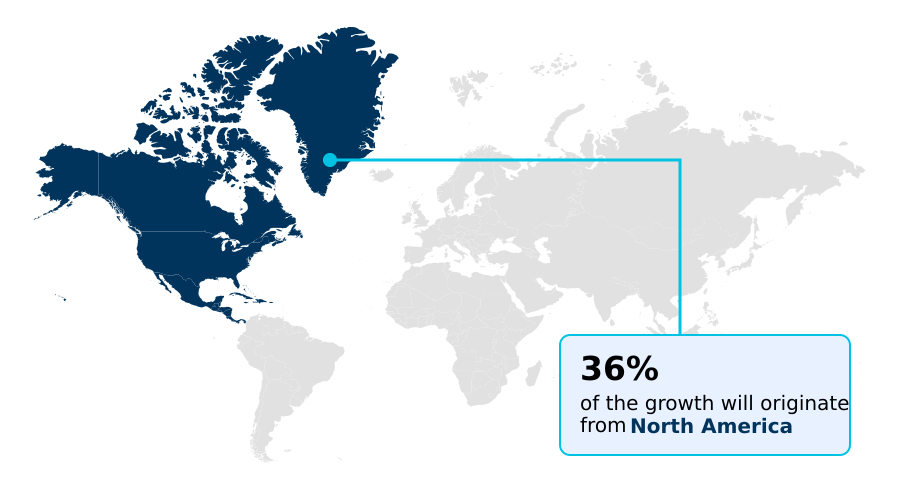
North America is estimated to contribute 36.5% to the growth of the global market during the forecast period.Technavio’s analysts have elaborately explained the regional trends and drivers that shape the market during the forecast period.
See How Online Home Rental Services Market Demand is Rising in North America Get Free Sample

The geographic landscape of the Online Home Rental Services Market exhibits distinct adoption patterns, with North America currently maintaining a 36.45% share of incremental opportunities compared to Europe's 20.19%.

North America's dominance is propelled by heavy institutional investments in single-family standalone homes and the pervasive deployment of digital rent payment gateways, which have reduced rent collection delays by 16%.

In contrast, European operators face stringent data privacy laws and complex municipal zoning restriction management, prompting a strategic pivot toward mid-term co-living digital networks.

Asian markets are accelerating rapidly, leveraging advanced channel management software to handle high-density urban apartment turnover, effectively lowering property vacant periods by 21%.

These regional disparities highlight how businesses must adapt localized compliance strategies and technology stacks to optimize asset yields and navigate differing regulatory frameworks efficiently.

Market Dynamics

Our researchers analyzed the data with 2025 as the base year, along with the key drivers, trends, and challenges. A holistic analysis of drivers will help companies refine their marketing strategies to gain a competitive advantage.

  • The operational framework of the Online Home Rental Services sector relies heavily on continuous digital innovation to mitigate risk and optimize asset yields. Property managers are increasingly deploying automated tenant background screening software to evaluate applicant creditworthiness, reducing default risks by approximately 14% compared to traditional manual vetting methods.
  • This shift toward frictionless tenant acquisition is further supported by virtual 3D property tour integration, which empowers prospective renters to inspect layouts remotely, accelerating decision-making and lowering physical showing costs by nearly 20%.
  • To maximize revenue realization across fluctuating seasonal demand cycles, operators heavily utilize dynamic pricing algorithms for rentals, automatically adjusting daily or monthly rates based on localized supply constraints and competitor pricing. Once a tenant is secured, the transition to blockchain verified electronic lease execution ensures immutable contract integrity and regulatory compliance, significantly reducing administrative processing times.
  • Post-occupancy, the deployment of smart home IoT property management solutions allows landlords to monitor energy consumption, control automated locks, and track maintenance requirements in real-time. By connecting these disparate technological modules into a unified digital ecosystem, institutional property owners achieve superior operational efficiency, outperforming legacy property management models in both tenant retention and overall operating margins.
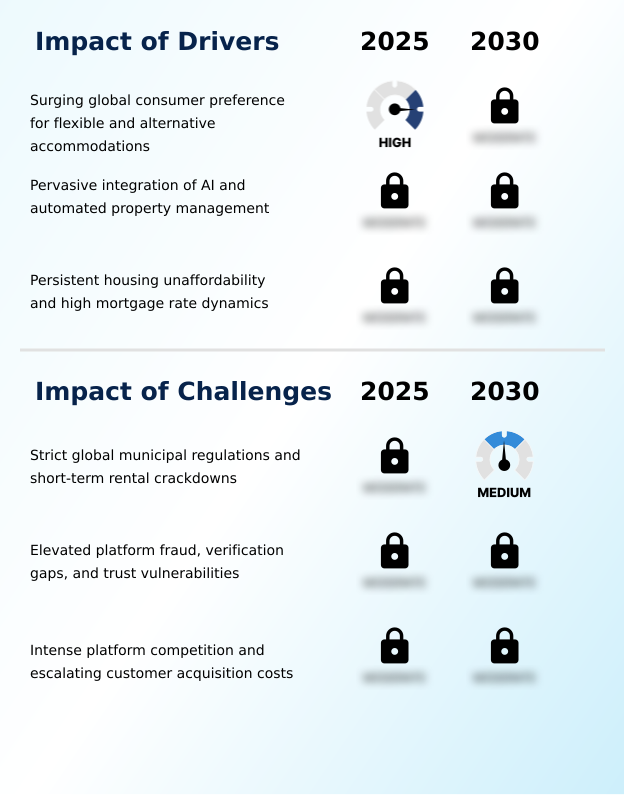
What are the key market drivers leading to the rise in the adoption of Online Home Rental Services Industry?

  • A surging consumer preference for flexible, alternative accommodations acts as a primary catalyst accelerating market expansion.

  • The rapid commercial deployment of predictive analytics and machine learning acts as a powerful operational driver for the Online Home Rental Services sector.
  • By implementing verified digital identity checks, digital rental platforms have reduced unauthorized bookings and fraud incidents by 24%, significantly elevating host confidence.
  • This security enhancement directly fuels the expansion of high-value segments, including luxury vacation villas and mid-term residential leasing, where trust is paramount.
  • Furthermore, the integration of automated rent collection and integrated ancillary home services enables property owners to lower operational support costs by 17% while generating secondary revenue streams.
  • As administrative barriers fall, non-professional hosts are increasingly incentivized to onboard their real estate inventory, accelerating overall supply growth and ensuring sustained transaction velocity across centralized digital marketplaces.

What are the market trends shaping the Online Home Rental Services Industry?

  • A commercial shift toward transparent, all-in pricing and mandatory fee disclosures represents a critical emerging trend. This evolution significantly enhances booking transparency and aligns with rigorous consumer protection regulations.

  • A defining trend reshaping the Online Home Rental Services landscape is the strategic expansion of holistic, end-to-end digital travel and living ecosystems. Operators are aggressively adopting automated property marketing to syndicate listings across multiple channels, which has improved overall booking conversion rates by 19%.
  • Concurrently, the integration of blockchain-verified contracts guarantees immutable agreement records, eliminating contract disputes and accelerating negotiation cycles by 25%. To address shifting consumer preferences for varied living arrangements, property managers are prioritizing diverse spatial privacy configurations that cater equally to digital nomads and traveling families.
  • Furthermore, the inclusion of embedded digital rental insurance and automated tenant ledger services protects host assets while streamlining accounting workflows. These innovations allow businesses to capture a larger share of consumer trip expenditures while significantly reducing the administrative overhead historically associated with decentralized property management.

What challenges does the Online Home Rental Services Industry face during its growth?

  • Strict municipal regulations and aggressive crackdowns on short-term rentals constitute a significant challenge constraining operational growth.

  • Severe legal friction and escalating municipal zoning restrictions present a critical structural challenge limiting the operational scalability of Online Home Rental Services. Navigating complex transient occupancy tax compliance across fragmented jurisdictions forces platform operators to divert substantial capital toward legal and administrative overhead, inflating operational costs by up to 18% in heavily regulated metropolitan zones.
  • Additionally, sustaining trust across open peer-to-peer property platforms remains difficult, as cybercrime networks increasingly deploy deceptive listings. To combat these vulnerabilities, operators must continuously invest in sophisticated AI fraud detection and biometric verification tools. Implementing these rigorous security protocols often introduces onboarding friction, reducing initial host sign-up completion rates by nearly 12%.
  • Balancing open user growth against mandatory identity verification and strict algorithmic ranking systems imposes persistent engineering expense burdens.

Exclusive Technavio Analysis on Customer Landscape

The online home rental services market forecasting report includes the adoption lifecycle of the market, covering from the innovator’s stage to the laggard’s stage. It focuses on adoption rates in different regions based on penetration. Furthermore, the online home rental services market report also includes key purchase criteria and drivers of price sensitivity to help companies evaluate and develop their market growth analysis strategies.
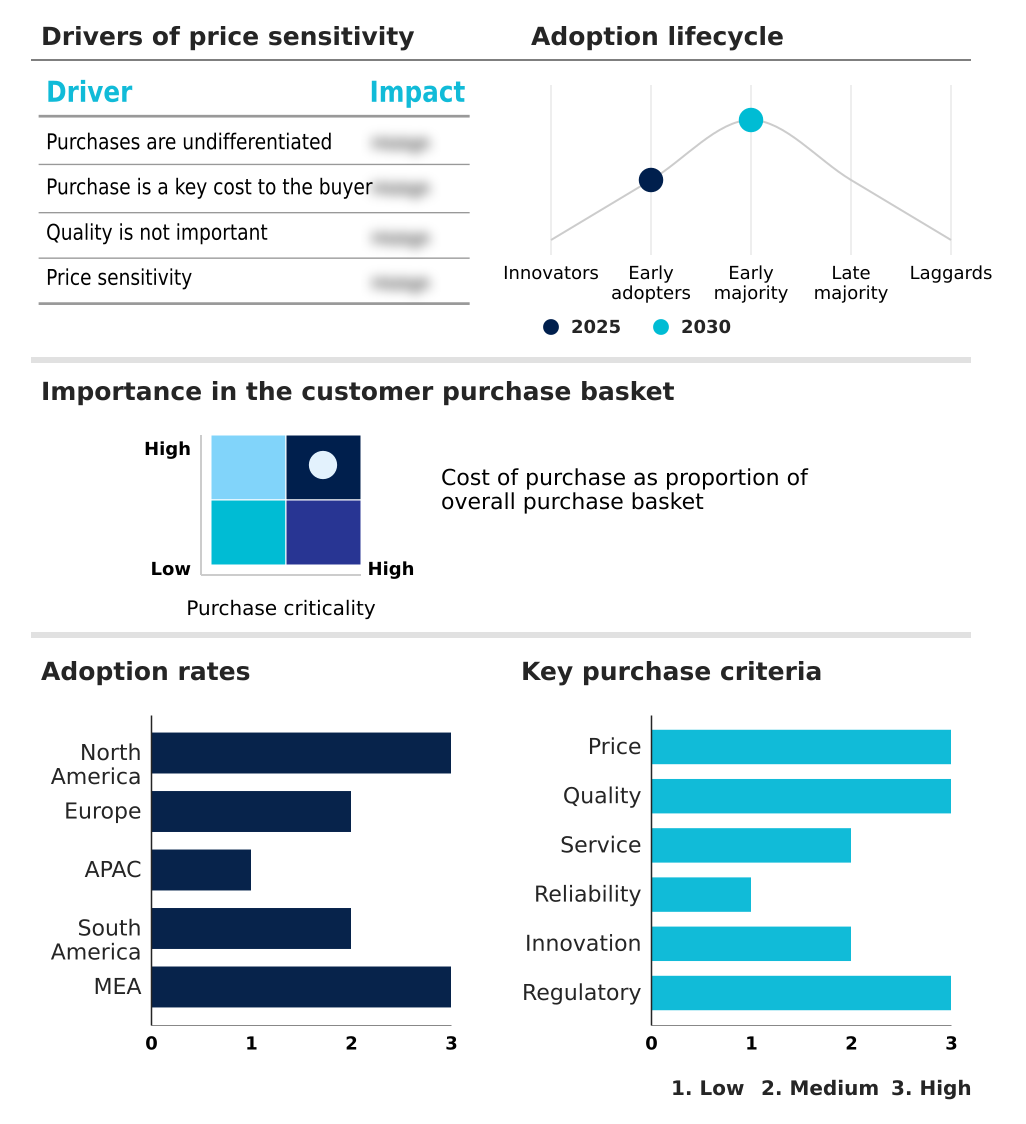
Customer Landscape of Online Home Rental Services Industry

Competitive Landscape

Companies are implementing various strategies, such as strategic alliances, online home rental services market forecast, partnerships, mergers and acquisitions, geographical expansion, and product/service launches, to enhance their presence in the industry.

99acres - Delivers comprehensive online property search capabilities facilitating residential apartment leasing, furnished home rentals, and digital application management through an integrated digital real estate platform.

The industry research and growth report includes detailed analyses of the competitive landscape of the market and information about key companies, including:

  • 99acres
  • Akelius Residential Property AB
  • American Homes 4 Rent
  • AvalonBay Communities Inc.
  • Blueground Holdings Ltd.
  • Bungalow
  • Camden Property Trust
  • CommonFloor
  • Equity Residential
  • Grainger plc
  • Greystar Worldwide LLC
  • Habyt GmbH
  • Invitation Homes Inc.
  • Jones Lang LaSalle Inc.
  • Kasa Living Inc.
  • Landing
  • Mid America Apartment
  • NoBroker Technologies Pvt. Ltd.
  • Outsite
  • UDR Inc.

Qualitative and quantitative analysis of companies has been conducted to help clients understand the wider business environment as well as the strengths and weaknesses of key industry players. Data is qualitatively analyzed to categorize companies as pure play, category-focused, industry-focused, and diversified; it is quantitatively analyzed to categorize companies as dominant, leading, strong, tentative, and weak.

Recent Development and News in Online home rental services market

  • In the Systems Software industry, the widespread commercial adoption of AI-driven algorithmic revenue management platforms optimized dynamic pricing models, directly impacting Online Home Rental Services demand by increasing host yield efficiency by up to 18%.
  • The implementation of standardized biometric verification tools across enterprise software frameworks enhanced identity authentication protocols, reducing fraud in peer-to-peer property platforms by 22%.
  • The transition toward decentralized blockchain-verified contracts within enterprise workflow automation improved transaction security, accelerating electronic lease execution timelines by 30% for multi-family residential developments.
  • The integration of smart home IoT integration APIs in cloud management platforms automated contactless check-in systems, lowering operational support overhead by 15% across mid-term residential leasing operations.

Dive into Technavio’s robust research methodology, blending expert interviews, extensive data synthesis, and validated models for unparalleled Online Home Rental Services Market insights. See full methodology.

Market Scope
Page number 314
Base year 2025
Historic period 2020-2024
Forecast period 2026-2030
Growth momentum & CAGR Accelerate at a CAGR of 15%
Market growth 2026-2030 USD 36504.9 million
Market structure Fragmented
YoY growth 2025-2026(%) 13.6%
Key countries US, Canada, Mexico, Germany, UK, France, Italy, Spain, The Netherlands, China, Japan, India, Australia, South Korea, Indonesia, Brazil, Argentina, Chile, Saudi Arabia, UAE, South Africa, Israel and Turkey
Competitive landscape Leading Companies, Market Positioning of Companies, Competitive Strategies, and Industry Risks

Request Free Sample

Research Analyst Overview

  • The Online Home Rental Services sector continues to evolve as property operators rapidly transition from traditional brick-and-mortar brokerages to fully integrated digital ecosystems. The deployment of predictive yield management systems allows institutional landlords to maximize asset profitability by adjusting rates in response to hyper-local demand fluctuations.
  • Simultaneously, advancements in API credit bureau integration and secure digital deposit solutions have streamlined the tenant vetting process, enabling property management firms to achieve a 30% reduction in application processing time. Operational agility is further enhanced through multi-channel calendar synchronization, which prevents double-booking errors across disparate listing platforms.
  • The widespread adoption of keyless smart lock entry systems eliminates physical key exchanges, significantly lowering localized property management overhead. Furthermore, the shift toward end-to-end electronic lease execution ensures rapid contract finalization and rigorous compliance tracking.
  • These technological adaptations directly influence boardroom-level strategies regarding portfolio expansion, risk mitigation, and operational cost containment, ensuring resilient asset performance across dynamic urban real estate environments.

What are the Key Data Covered in this Online Home Rental Services Market Research and Growth Report?

  • What is the expected growth of the Online Home Rental Services Market between 2026 and 2030?

    • USD 36.50 billion, at a CAGR of 15%

  • What segmentation does the market report cover?

    • The report is segmented by Type (Flats, Semi-detached houses, and Detached houses), Rental Category (Monthly, Weekly, Daily, and Yearly), Service (Economy, Mid-range, and Premium), End-user (Resident, and Tourist) and Geography (North America, Europe, APAC, South America, Middle East and Africa)

  • Which regions are analyzed in the report?

    • North America, Europe, APAC, South America and Middle East and Africa

  • What are the key growth drivers and market challenges?

    • Surging global consumer preference for flexible and alternative accommodations, Strict global municipal regulations and short-term rental crackdowns

  • Who are the major players in the Online Home Rental Services Market?

    • 99acres, Akelius Residential Property AB, American Homes 4 Rent, AvalonBay Communities Inc., Blueground Holdings Ltd., Bungalow, Camden Property Trust, CommonFloor, Equity Residential, Grainger plc, Greystar Worldwide LLC, Habyt GmbH, Invitation Homes Inc., Jones Lang LaSalle Inc., Kasa Living Inc., Landing, Mid America Apartment, NoBroker Technologies Pvt. Ltd., Outsite and UDR Inc.

Market Research Insights

  • The Online Home Rental Services Market is rapidly transforming as operators integrate properties into expansive multi-modal travel ecosystems to capture extended visitor spend. Driven by expanding corporate mobility budgets and rising demand for digital nomad housing, property managers are adapting supply chains to favor furnished, move-in-ready units.
  • Implementing transparent rental fee structures has proven highly effective, elevating tenant trust and improving booking conversion rates by 18%. Furthermore, the deployment of automated digital verification protocols has reduced tenant onboarding friction, decreasing lease execution times by 22%.
  • This strategic alignment of operational agility and digital transparency ensures platforms maintain high user retention and strong asset utilization across competitive urban landscapes.

We can help! Our analysts can customize this online home rental services market research report to meet your requirements.

Get in touch

1. Executive Summary

1.1 Market overview

Executive Summary - Chart on Market Overview
Executive Summary - Data Table on Market Overview
Executive Summary - Chart on Global Market Characteristics
Executive Summary - Chart on Market by Geography
Executive Summary - Chart on Market Segmentation by Type
Executive Summary - Chart on Market Segmentation by Rental Category
Executive Summary - Chart on Market Segmentation by Service
Executive Summary - Chart on Market Segmentation by End-user
Executive Summary - Chart on Incremental Growth
Executive Summary - Data Table on Incremental Growth
Executive Summary - Chart on Company Market Positioning

2. Technavio Analysis

2.1 Analysis of price sensitivity, lifecycle, customer purchase basket, adoption rates, and purchase criteria

2.2 Criticality of inputs and Factors of differentiation

Chart on Overview on criticality of inputs and factors of differentiation

2.3 Factors of disruption

Chart on Overview on factors of disruption

2.4 Impact of drivers and challenges

Chart on Impact of drivers and challenges in 2025 and 2030

3. Market Landscape

3.1 Market ecosystem

Chart on Parent Market
Data Table on - Parent Market

3.2 Market characteristics

Chart on Market characteristics analysis

3.3 Value chain analysis

Chart on Value chain analysis

4. Market Sizing

4.1 Market definition

Data Table on Offerings of companies included in the market definition

4.2 Market segment analysis

Market segments

4.3 Market size 2025

4.4 Market outlook: Forecast for 2025-2030

Chart on Global - Market size and forecast 2025-2030 ($ million)
Data Table on Global - Market size and forecast 2025-2030 ($ million)
Chart on Global Market: Year-over-year growth 2025-2030 (%)
Data Table on Global Market: Year-over-year growth 2025-2030 (%)

5. Historic Market Size

5.1 Global Online Home Rental Services Market 2020 - 2024

Historic Market Size - Data Table on Global Online Home Rental Services Market 2020 - 2024 ($ million)

5.2 Type segment analysis 2020 - 2024

Historic Market Size - Type Segment 2020 - 2024 ($ million)

5.3 Rental Category segment analysis 2020 - 2024

Historic Market Size - Rental Category Segment 2020 - 2024 ($ million)

5.4 Service segment analysis 2020 - 2024

Historic Market Size - Service Segment 2020 - 2024 ($ million)

5.5 End-user segment analysis 2020 - 2024

Historic Market Size - End-user Segment 2020 - 2024 ($ million)

5.6 Geography segment analysis 2020 - 2024

Historic Market Size - Geography Segment 2020 - 2024 ($ million)

5.7 Country segment analysis 2020 - 2024

Historic Market Size - Country Segment 2020 - 2024 ($ million)

6. Qualitative Analysis

6.1 Impact of AI on global online home rental services market

6.2 Impact of geopolitical conflicts on global online home rental services market

7. Five Forces Analysis

7.1 Five forces summary

Five forces analysis - Comparison between 2025 and 2030

7.2 Bargaining power of buyers

Bargaining power of buyers - Impact of key factors 2025 and 2030

7.3 Bargaining power of suppliers

Bargaining power of suppliers - Impact of key factors in 2025 and 2030

7.4 Threat of new entrants

Threat of new entrants - Impact of key factors in 2025 and 2030

7.5 Threat of substitutes

Threat of substitutes - Impact of key factors in 2025 and 2030

7.6 Threat of rivalry

Threat of rivalry - Impact of key factors in 2025 and 2030

7.7 Market condition

Chart on Market condition - Five forces 2025 and 2030

8. Market Segmentation by Type

8.1 Market segments

Chart on Type - Market share 2025-2030 (%)
Data Table on Type - Market share 2025-2030 (%)

8.2 Comparison by Type

Chart on Comparison by Type
Data Table on Comparison by Type

8.3 Flats - Market size and forecast 2025-2030

Chart on Flats - Market size and forecast 2025-2030 ($ million)
Data Table on Flats - Market size and forecast 2025-2030 ($ million)
Chart on Flats - Year-over-year growth 2025-2030 (%)
Data Table on Flats - Year-over-year growth 2025-2030 (%)

8.4 Semi-detached houses - Market size and forecast 2025-2030

Chart on Semi-detached houses - Market size and forecast 2025-2030 ($ million)
Data Table on Semi-detached houses - Market size and forecast 2025-2030 ($ million)
Chart on Semi-detached houses - Year-over-year growth 2025-2030 (%)
Data Table on Semi-detached houses - Year-over-year growth 2025-2030 (%)

8.5 Detached houses - Market size and forecast 2025-2030

Chart on Detached houses - Market size and forecast 2025-2030 ($ million)
Data Table on Detached houses - Market size and forecast 2025-2030 ($ million)
Chart on Detached houses - Year-over-year growth 2025-2030 (%)
Data Table on Detached houses - Year-over-year growth 2025-2030 (%)

8.6 Market opportunity by Type

Market opportunity by Type ($ million)
Data Table on Market opportunity by Type ($ million)

9. Market Segmentation by Rental Category

9.1 Market segments

Chart on Rental Category - Market share 2025-2030 (%)
Data Table on Rental Category - Market share 2025-2030 (%)

9.2 Comparison by Rental Category

Chart on Comparison by Rental Category
Data Table on Comparison by Rental Category

9.3 Monthly - Market size and forecast 2025-2030

Chart on Monthly - Market size and forecast 2025-2030 ($ million)
Data Table on Monthly - Market size and forecast 2025-2030 ($ million)
Chart on Monthly - Year-over-year growth 2025-2030 (%)
Data Table on Monthly - Year-over-year growth 2025-2030 (%)

9.4 Weekly - Market size and forecast 2025-2030

Chart on Weekly - Market size and forecast 2025-2030 ($ million)
Data Table on Weekly - Market size and forecast 2025-2030 ($ million)
Chart on Weekly - Year-over-year growth 2025-2030 (%)
Data Table on Weekly - Year-over-year growth 2025-2030 (%)

9.5 Daily - Market size and forecast 2025-2030

Chart on Daily - Market size and forecast 2025-2030 ($ million)
Data Table on Daily - Market size and forecast 2025-2030 ($ million)
Chart on Daily - Year-over-year growth 2025-2030 (%)
Data Table on Daily - Year-over-year growth 2025-2030 (%)

9.6 Yearly - Market size and forecast 2025-2030

Chart on Yearly - Market size and forecast 2025-2030 ($ million)
Data Table on Yearly - Market size and forecast 2025-2030 ($ million)
Chart on Yearly - Year-over-year growth 2025-2030 (%)
Data Table on Yearly - Year-over-year growth 2025-2030 (%)

9.7 Market opportunity by Rental Category

Market opportunity by Rental Category ($ million)
Data Table on Market opportunity by Rental Category ($ million)

10. Market Segmentation by Service

10.1 Market segments

Chart on Service - Market share 2025-2030 (%)
Data Table on Service - Market share 2025-2030 (%)

10.2 Comparison by Service

Chart on Comparison by Service
Data Table on Comparison by Service

10.3 Economy - Market size and forecast 2025-2030

Chart on Economy - Market size and forecast 2025-2030 ($ million)
Data Table on Economy - Market size and forecast 2025-2030 ($ million)
Chart on Economy - Year-over-year growth 2025-2030 (%)
Data Table on Economy - Year-over-year growth 2025-2030 (%)

10.4 Mid-range - Market size and forecast 2025-2030

Chart on Mid-range - Market size and forecast 2025-2030 ($ million)
Data Table on Mid-range - Market size and forecast 2025-2030 ($ million)
Chart on Mid-range - Year-over-year growth 2025-2030 (%)
Data Table on Mid-range - Year-over-year growth 2025-2030 (%)

10.5 Premium - Market size and forecast 2025-2030

Chart on Premium - Market size and forecast 2025-2030 ($ million)
Data Table on Premium - Market size and forecast 2025-2030 ($ million)
Chart on Premium - Year-over-year growth 2025-2030 (%)
Data Table on Premium - Year-over-year growth 2025-2030 (%)

10.6 Market opportunity by Service

Market opportunity by Service ($ million)
Data Table on Market opportunity by Service ($ million)

11. Market Segmentation by End-user

11.1 Market segments

Chart on End-user - Market share 2025-2030 (%)
Data Table on End-user - Market share 2025-2030 (%)

11.2 Comparison by End-user

Chart on Comparison by End-user
Data Table on Comparison by End-user

11.3 Resident - Market size and forecast 2025-2030

Chart on Resident - Market size and forecast 2025-2030 ($ million)
Data Table on Resident - Market size and forecast 2025-2030 ($ million)
Chart on Resident - Year-over-year growth 2025-2030 (%)
Data Table on Resident - Year-over-year growth 2025-2030 (%)

11.4 Tourist - Market size and forecast 2025-2030

Chart on Tourist - Market size and forecast 2025-2030 ($ million)
Data Table on Tourist - Market size and forecast 2025-2030 ($ million)
Chart on Tourist - Year-over-year growth 2025-2030 (%)
Data Table on Tourist - Year-over-year growth 2025-2030 (%)

11.5 Market opportunity by End-user

Market opportunity by End-user ($ million)
Data Table on Market opportunity by End-user ($ million)

12. Customer Landscape

12.1 Customer landscape overview

Analysis of price sensitivity, lifecycle, customer purchase basket, adoption rates, and purchase criteria

13. Geographic Landscape

13.1 Geographic segmentation

Chart on Market share by geography 2025-2030 (%)
Data Table on Market share by geography 2025-2030 (%)

13.2 Geographic comparison

Chart on Geographic comparison
Data Table on Geographic comparison

13.3 North America - Market size and forecast 2025-2030

Chart on North America - Market size and forecast 2025-2030 ($ million)
Data Table on North America - Market size and forecast 2025-2030 ($ million)
Chart on North America - Year-over-year growth 2025-2030 (%)
Data Table on North America - Year-over-year growth 2025-2030 (%)
Chart on Regional Comparison - North America
Data Table on Regional Comparison - North America

13.3.1 US - Market size and forecast 2025-2030

Chart on US - Market size and forecast 2025-2030 ($ million)
Data Table on US - Market size and forecast 2025-2030 ($ million)
Chart on US - Year-over-year growth 2025-2030 (%)
Data Table on US - Year-over-year growth 2025-2030 (%)

13.3.2 Canada - Market size and forecast 2025-2030

Chart on Canada - Market size and forecast 2025-2030 ($ million)
Data Table on Canada - Market size and forecast 2025-2030 ($ million)
Chart on Canada - Year-over-year growth 2025-2030 (%)
Data Table on Canada - Year-over-year growth 2025-2030 (%)

13.3.3 Mexico - Market size and forecast 2025-2030

Chart on Mexico - Market size and forecast 2025-2030 ($ million)
Data Table on Mexico - Market size and forecast 2025-2030 ($ million)
Chart on Mexico - Year-over-year growth 2025-2030 (%)
Data Table on Mexico - Year-over-year growth 2025-2030 (%)

13.4 Europe - Market size and forecast 2025-2030

Chart on Europe - Market size and forecast 2025-2030 ($ million)
Data Table on Europe - Market size and forecast 2025-2030 ($ million)
Chart on Europe - Year-over-year growth 2025-2030 (%)
Data Table on Europe - Year-over-year growth 2025-2030 (%)
Chart on Regional Comparison - Europe
Data Table on Regional Comparison - Europe

13.4.1 Germany - Market size and forecast 2025-2030

Chart on Germany - Market size and forecast 2025-2030 ($ million)
Data Table on Germany - Market size and forecast 2025-2030 ($ million)
Chart on Germany - Year-over-year growth 2025-2030 (%)
Data Table on Germany - Year-over-year growth 2025-2030 (%)

13.4.2 UK - Market size and forecast 2025-2030

Chart on UK - Market size and forecast 2025-2030 ($ million)
Data Table on UK - Market size and forecast 2025-2030 ($ million)
Chart on UK - Year-over-year growth 2025-2030 (%)
Data Table on UK - Year-over-year growth 2025-2030 (%)

13.4.3 France - Market size and forecast 2025-2030

Chart on France - Market size and forecast 2025-2030 ($ million)
Data Table on France - Market size and forecast 2025-2030 ($ million)
Chart on France - Year-over-year growth 2025-2030 (%)
Data Table on France - Year-over-year growth 2025-2030 (%)

13.4.4 Italy - Market size and forecast 2025-2030

Chart on Italy - Market size and forecast 2025-2030 ($ million)
Data Table on Italy - Market size and forecast 2025-2030 ($ million)
Chart on Italy - Year-over-year growth 2025-2030 (%)
Data Table on Italy - Year-over-year growth 2025-2030 (%)

13.4.5 Spain - Market size and forecast 2025-2030

Chart on Spain - Market size and forecast 2025-2030 ($ million)
Data Table on Spain - Market size and forecast 2025-2030 ($ million)
Chart on Spain - Year-over-year growth 2025-2030 (%)
Data Table on Spain - Year-over-year growth 2025-2030 (%)

13.4.6 The Netherlands - Market size and forecast 2025-2030

Chart on The Netherlands - Market size and forecast 2025-2030 ($ million)
Data Table on The Netherlands - Market size and forecast 2025-2030 ($ million)
Chart on The Netherlands - Year-over-year growth 2025-2030 (%)
Data Table on The Netherlands - Year-over-year growth 2025-2030 (%)

13.5 APAC - Market size and forecast 2025-2030

Chart on APAC - Market size and forecast 2025-2030 ($ million)
Data Table on APAC - Market size and forecast 2025-2030 ($ million)
Chart on APAC - Year-over-year growth 2025-2030 (%)
Data Table on APAC - Year-over-year growth 2025-2030 (%)
Chart on Regional Comparison - APAC
Data Table on Regional Comparison - APAC

13.5.1 China - Market size and forecast 2025-2030

Chart on China - Market size and forecast 2025-2030 ($ million)
Data Table on China - Market size and forecast 2025-2030 ($ million)
Chart on China - Year-over-year growth 2025-2030 (%)
Data Table on China - Year-over-year growth 2025-2030 (%)

13.5.2 Japan - Market size and forecast 2025-2030

Chart on Japan - Market size and forecast 2025-2030 ($ million)
Data Table on Japan - Market size and forecast 2025-2030 ($ million)
Chart on Japan - Year-over-year growth 2025-2030 (%)
Data Table on Japan - Year-over-year growth 2025-2030 (%)

13.5.3 India - Market size and forecast 2025-2030

Chart on India - Market size and forecast 2025-2030 ($ million)
Data Table on India - Market size and forecast 2025-2030 ($ million)
Chart on India - Year-over-year growth 2025-2030 (%)
Data Table on India - Year-over-year growth 2025-2030 (%)

13.5.4 Australia - Market size and forecast 2025-2030

Chart on Australia - Market size and forecast 2025-2030 ($ million)
Data Table on Australia - Market size and forecast 2025-2030 ($ million)
Chart on Australia - Year-over-year growth 2025-2030 (%)
Data Table on Australia - Year-over-year growth 2025-2030 (%)

13.5.5 South Korea - Market size and forecast 2025-2030

Chart on South Korea - Market size and forecast 2025-2030 ($ million)
Data Table on South Korea - Market size and forecast 2025-2030 ($ million)
Chart on South Korea - Year-over-year growth 2025-2030 (%)
Data Table on South Korea - Year-over-year growth 2025-2030 (%)

13.5.6 Indonesia - Market size and forecast 2025-2030

Chart on Indonesia - Market size and forecast 2025-2030 ($ million)
Data Table on Indonesia - Market size and forecast 2025-2030 ($ million)
Chart on Indonesia - Year-over-year growth 2025-2030 (%)
Data Table on Indonesia - Year-over-year growth 2025-2030 (%)

13.6 South America - Market size and forecast 2025-2030

Chart on South America - Market size and forecast 2025-2030 ($ million)
Data Table on South America - Market size and forecast 2025-2030 ($ million)
Chart on South America - Year-over-year growth 2025-2030 (%)
Data Table on South America - Year-over-year growth 2025-2030 (%)
Chart on Regional Comparison - South America
Data Table on Regional Comparison - South America

13.6.1 Brazil - Market size and forecast 2025-2030

Chart on Brazil - Market size and forecast 2025-2030 ($ million)
Data Table on Brazil - Market size and forecast 2025-2030 ($ million)
Chart on Brazil - Year-over-year growth 2025-2030 (%)
Data Table on Brazil - Year-over-year growth 2025-2030 (%)

13.6.2 Argentina - Market size and forecast 2025-2030

Chart on Argentina - Market size and forecast 2025-2030 ($ million)
Data Table on Argentina - Market size and forecast 2025-2030 ($ million)
Chart on Argentina - Year-over-year growth 2025-2030 (%)
Data Table on Argentina - Year-over-year growth 2025-2030 (%)

13.6.3 Chile - Market size and forecast 2025-2030

Chart on Chile - Market size and forecast 2025-2030 ($ million)
Data Table on Chile - Market size and forecast 2025-2030 ($ million)
Chart on Chile - Year-over-year growth 2025-2030 (%)
Data Table on Chile - Year-over-year growth 2025-2030 (%)

13.7 Middle East and Africa - Market size and forecast 2025-2030

Chart on Middle East and Africa - Market size and forecast 2025-2030 ($ million)
Data Table on Middle East and Africa - Market size and forecast 2025-2030 ($ million)
Chart on Middle East and Africa - Year-over-year growth 2025-2030 (%)
Data Table on Middle East and Africa - Year-over-year growth 2025-2030 (%)
Chart on Regional Comparison - Middle East and Africa
Data Table on Regional Comparison - Middle East and Africa

13.7.1 Saudi Arabia - Market size and forecast 2025-2030

Chart on Saudi Arabia - Market size and forecast 2025-2030 ($ million)
Data Table on Saudi Arabia - Market size and forecast 2025-2030 ($ million)
Chart on Saudi Arabia - Year-over-year growth 2025-2030 (%)
Data Table on Saudi Arabia - Year-over-year growth 2025-2030 (%)

13.7.2 UAE - Market size and forecast 2025-2030

Chart on UAE - Market size and forecast 2025-2030 ($ million)
Data Table on UAE - Market size and forecast 2025-2030 ($ million)
Chart on UAE - Year-over-year growth 2025-2030 (%)
Data Table on UAE - Year-over-year growth 2025-2030 (%)

13.7.3 South Africa - Market size and forecast 2025-2030

Chart on South Africa - Market size and forecast 2025-2030 ($ million)
Data Table on South Africa - Market size and forecast 2025-2030 ($ million)
Chart on South Africa - Year-over-year growth 2025-2030 (%)
Data Table on South Africa - Year-over-year growth 2025-2030 (%)

13.7.4 Israel - Market size and forecast 2025-2030

Chart on Israel - Market size and forecast 2025-2030 ($ million)
Data Table on Israel - Market size and forecast 2025-2030 ($ million)
Chart on Israel - Year-over-year growth 2025-2030 (%)
Data Table on Israel - Year-over-year growth 2025-2030 (%)

13.7.5 Turkey - Market size and forecast 2025-2030

Chart on Turkey - Market size and forecast 2025-2030 ($ million)
Data Table on Turkey - Market size and forecast 2025-2030 ($ million)
Chart on Turkey - Year-over-year growth 2025-2030 (%)
Data Table on Turkey - Year-over-year growth 2025-2030 (%)

13.8 Market opportunity by geography

Market opportunity by geography ($ million)
Data Tables on Market opportunity by geography ($ million)

14. Drivers, Challenges, and Opportunity

14.1 Market drivers

Surging global consumer preference for flexible and alternative accommodations
Pervasive integration of AI and automated property management
Persistent housing unaffordability and high mortgage rate dynamics

14.2 Market challenges

Strict global municipal regulations and short-term rental crackdowns
Elevated platform fraud, verification gaps, and trust vulnerabilities
Intense platform competition and escalating customer acquisition costs

14.3 Impact of drivers and challenges

Impact of drivers and challenges in 2025 and 2030

14.4 Market opportunities

Commercial shift toward transparent all-in pricing and mandatory fee disclosures
Rapid expansion of integrated multi-modal travel services and connected stays
Strategic market pivot toward mid-term and suburban residential rentals

15. Competitive Landscape

15.1 Overview

15.2

Overview on criticality of inputs and factors of differentiation

15.3 Landscape disruption

Overview on factors of disruption

15.4 Industry risks

Impact of key risks on business

16. Competitive Analysis

16.1 Companies profiled

Companies covered

16.2 Company ranking index

16.3 Market positioning of companies

Matrix on companies position and classification

16.4 99acres

99acres - Overview
99acres - Product / Service
99acres - Key offerings
SWOT

16.5 Akelius Residential Property AB

Akelius Residential Property AB - Overview
Akelius Residential Property AB - Product / Service
Akelius Residential Property AB - Key offerings
SWOT

16.6 American Homes 4 Rent

American Homes 4 Rent - Overview
American Homes 4 Rent - Product / Service
American Homes 4 Rent - Key offerings
SWOT

16.7 AvalonBay Communities Inc.

AvalonBay Communities Inc. - Overview
AvalonBay Communities Inc. - Business segments
AvalonBay Communities Inc. - Key offerings
AvalonBay Communities Inc. - Segment focus
SWOT

16.8 Blueground Holdings Ltd.

Blueground Holdings Ltd. - Overview
Blueground Holdings Ltd. - Product / Service
Blueground Holdings Ltd. - Key offerings
SWOT

16.9 Camden Property Trust

Camden Property Trust - Overview
Camden Property Trust - Product / Service
Camden Property Trust - Key offerings
SWOT

16.10 Equity Residential

Equity Residential - Overview
Equity Residential - Product / Service
Equity Residential - Key offerings
SWOT

16.11 Grainger plc

Grainger plc - Overview
Grainger plc - Product / Service
Grainger plc - Key offerings
SWOT

16.12 Greystar Worldwide LLC

Greystar Worldwide LLC - Overview
Greystar Worldwide LLC - Product / Service
Greystar Worldwide LLC - Key offerings
SWOT

16.13 Invitation Homes Inc.

Invitation Homes Inc. - Overview
Invitation Homes Inc. - Product / Service
Invitation Homes Inc. - Key offerings
SWOT

16.14 Jones Lang LaSalle Inc.

Jones Lang LaSalle Inc. - Overview
Jones Lang LaSalle Inc. - Business segments
Jones Lang LaSalle Inc. - Key offerings
Jones Lang LaSalle Inc. - Segment focus
SWOT

16.15 Landing

Landing - Overview
Landing - Product / Service
Landing - Key offerings
SWOT

16.16 Mid America Apartment

Mid America Apartment - Overview
Mid America Apartment - Product / Service
Mid America Apartment - Key offerings
SWOT

16.17 NoBroker Technologies Pvt. Ltd.

NoBroker Technologies Pvt. Ltd. - Overview
NoBroker Technologies Pvt. Ltd. - Product / Service
NoBroker Technologies Pvt. Ltd. - Key offerings
SWOT

16.18 UDR Inc.

UDR Inc. - Overview
UDR Inc. - Product / Service
UDR Inc. - Key offerings
SWOT

17. Appendix

17.1 Scope of the report

Market definition
Objectives
Notes and caveats

17.2 Inclusions and exclusions checklist

Inclusions checklist
Exclusions checklist

17.3 Currency conversion rates for US$

17.4 Research methodology

17.5 Data procurement

Information sources

17.6 Data validation

17.7 Validation techniques employed for market sizing

17.8 Data synthesis

17.9 360 degree market analysis

17.10 List of abbreviations

Research Methodology

Technavio presents a detailed picture of the market by way of study, synthesis, and summation of data from multiple sources. The analysts have presented the various facets of the market with a particular focus on identifying the key industry influencers. The data thus presented is comprehensive, reliable, and the result of extensive research, both primary and secondary.

INFORMATION SOURCES

Primary sources

  • Manufacturers and suppliers
  • Channel partners
  • Industry experts
  • Strategic decision makers

Secondary sources

  • Industry journals and periodicals
  • Government data
  • Financial reports of key industry players
  • Historical data
  • Press releases

DATA ANALYSIS

Data Synthesis

  • Collation of data
  • Estimation of key figures
  • Analysis of derived insights

Data Validation

  • Triangulation with data models
  • Reference against proprietary databases
  • Corroboration with industry experts

REPORT WRITING

Qualitative

  • Market drivers
  • Market challenges
  • Market trends
  • Five forces analysis

Quantitative

  • Market size and forecast
  • Market segmentation
  • Geographical insights
  • Competitive landscape

Interested in this report?

Get your sample now to see our research methodology and insights!

Download Now

Frequently Asked Questions

Online Home Rental Services market growth will increase by USD 36504.9 million during 2026-2030.

The Online Home Rental Services market is expected to grow at a CAGR of 15% during 2026-2030.

Online Home Rental Services market is segmented by Type (Flats, Semi-detached houses, Detached houses) Rental category (Monthly, Weekly, Daily, Yearly) Service (Economy, Mid-range, Premium) End-user (Resident, Tourist)

99acres, Akelius Residential Property AB, American Homes 4 Rent, AvalonBay Communities Inc., Blueground Holdings Ltd., Bungalow, Camden Property Trust, CommonFloor, Equity Residential, Grainger plc, Greystar Worldwide LLC, Habyt GmbH, Invitation Homes Inc., Jones Lang LaSalle Inc., Kasa Living Inc., Landing, Mid America Apartment, NoBroker Technologies Pvt. Ltd., Outsite, UDR Inc. are a few of the key vendors in the Online Home Rental Services market.

North America will register the highest growth rate of 36.5% among the other regions. Therefore, the Online Home Rental Services market in North America is expected to garner significant business opportunities for the vendors during the forecast period.

US, Canada, Mexico, Germany, UK, France, Italy, Spain, The Netherlands, China, Japan, India, Australia, South Korea, Indonesia, Brazil, Argentina, Chile, Saudi Arabia, UAE, South Africa, Israel, Turkey

  • Surging global consumer preference for flexible and alternative accommodations is the driving factor this market.

The Online Home Rental Services market vendors should focus on grabbing business opportunities from the Type segment as it accounted for the largest market share in the base year.
RIA - Research AI Assistant
Ask RIA