
Mobile Device Management (MDM) Market Analysis, Size, and Forecast 2026-2030: APAC (China, Japan, and India), Europe (Germany, UK, and France), North America (US, Canada, and Mexico), South America (Brazil, Argentina, and Chile), Middle East and Africa (UAE, Saudi Arabia, and South Africa), and Rest of World (ROW)

Mobile Device Management (MDM) Market Analysis, Size, and Forecast 2026-2030:
APAC (China, Japan, and India), Europe (Germany, UK, and France), North America (US, Canada, and Mexico), South America (Brazil, Argentina, and Chile), Middle East and Africa (UAE, Saudi Arabia, and South Africa), and Rest of World (ROW)

Published: Nov 2026 287 Pages SKU: IRTNTR40280

Market Overview at a Glance

$32.26 B
Market Opportunity
28.7%
CAGR 2025 - 2030
54.4%
APAC Growth
$6.86 B
Large enterprises segment 2024

Mobile Device Management (Mdm) Market Size 2026-2030

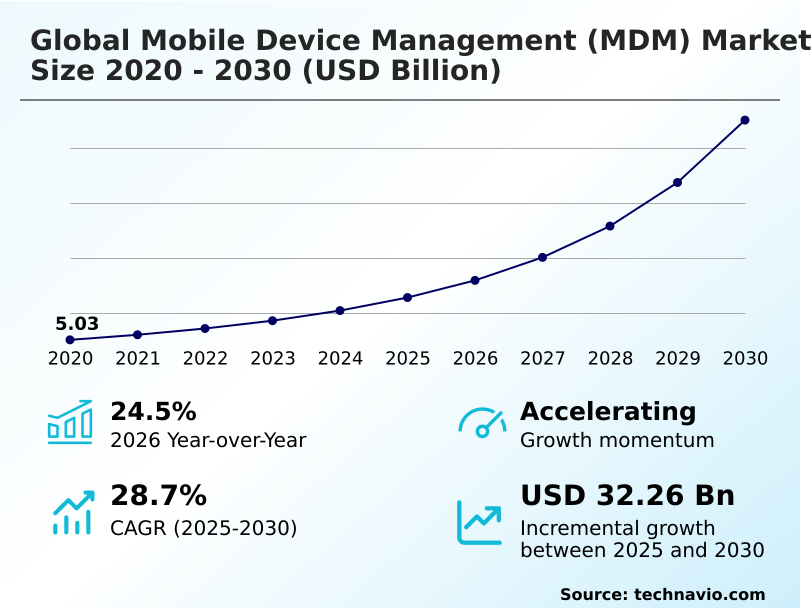
The mobile device management (mdm) market size is valued to increase by USD 32.26 billion, at a CAGR of 28.7% from 2025 to 2030. Global expansion of remote and hybrid work models will drive the mobile device management (mdm) market.

Major Market Trends & Insights

  • APAC dominated the market and accounted for a 54.4% growth during the forecast period.
  • By End-user - Large enterprises segment was valued at USD 6.86 billion in 2024
  • By Deployment - On premise segment accounted for the largest market revenue share in 2024

Market Size & Forecast

  • Market Opportunities: USD 39.96 billion
  • Market Future Opportunities: USD 32.26 billion
  • CAGR from 2025 to 2030 : 28.7%

Market Summary

  • The Mobile Device Management (MDM) market functions as a critical infrastructure layer for organizations navigating decentralized digital operations. Enterprises increasingly rely on centralized platforms to enforce cryptographic policies, deploy applications, and monitor hardware health across heterogeneous operating systems.
  • In the logistics sector, supply chain coordinators utilize these tools to instantly push routing updates and lockdown security profiles to thousands of ruggedized handheld terminals, ensuring continuous field operations without requiring physical IT intervention. A primary driver for this adoption is the permanent shift toward hybrid work structures, which necessitates over-the-air provisioning to maintain secure connectivity outside traditional corporate firewalls.
  • Conversely, integrating legacy internal applications with modern mobile operating systems presents a significant structural challenge, often increasing cross-platform synchronization failures and elevating integration costs. Organizations deploying advanced endpoint administration platforms report a 35% reduction in security breach incidents compared to those utilizing fragmented administrative approaches.
  • Consequently, unified endpoint governance has evolved from a discretionary IT utility into an essential mechanism for preserving intellectual property and maintaining continuous regulatory alignment.

What will be the Size of the Mobile Device Management (Mdm) Market during the forecast period?
Get Key Insights on Market Forecast (PDF) Get Free Sample

How is the Mobile Device Management (Mdm) Market Segmented?

The mobile device management (mdm) industry research report provides comprehensive data (region-wise segment analysis), with forecasts and estimates in "USD million" for the period 2026-2030, as well as historical data from 2020-2024 for the following segments.

  • End-user
    • Large enterprises
    • SMEs
  • Deployment
    • On premise
    • Cloud based
  • Component
    • Solutions
    • Services
  • Geography
    • APAC
      • China
      • Japan
      • India
      • South Korea
      • Australia
      • Indonesia
    • Europe
      • Germany
      • UK
      • France
      • Italy
      • Spain
      • The Netherlands
    • North America
      • US
      • Canada
      • Mexico
    • South America
      • Brazil
      • Argentina
      • Chile
    • Middle East and Africa
      • UAE
      • Saudi Arabia
      • South Africa
      • Israel
      • Turkey

By End-user Insights

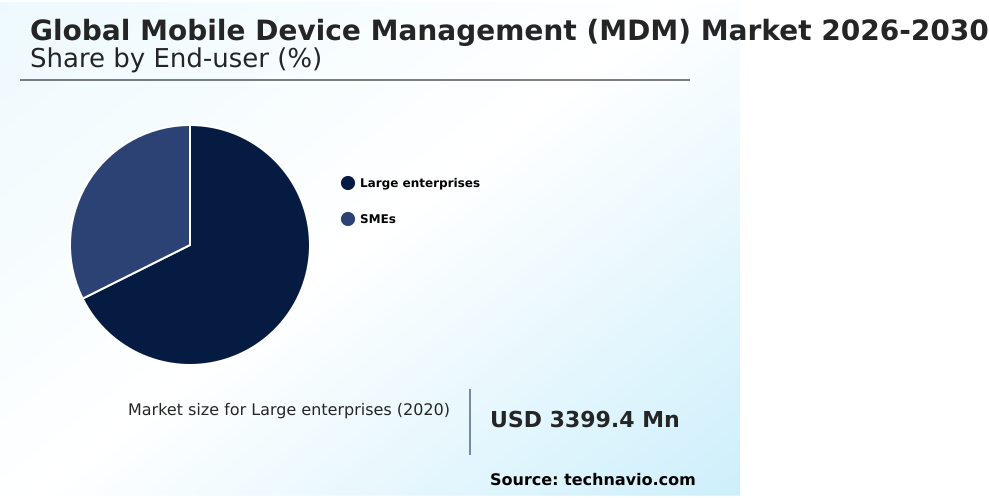
The large enterprises segment is estimated to witness significant growth during the forecast period.

Large enterprises dictate the structural evolution of the Mobile Device Management (MDM) market due to their massive, globally distributed hardware fleets. These multinationals construct complex digital workspace architectures that seamlessly integrate with preexisting identity federation systems.

Managing tens of thousands of endpoints requires stringent endpoint governance protocols and continuous device posture assessments to validate network access. Administrators leverage comprehensive application lifecycle management and mobile application whitelisting to control software execution across heterogeneous operating systems.

Furthermore, establishing secure data isolation environments ensures proprietary corporate information remains separate from personal employee usage. Utilizing advanced remote diagnostic capabilities, large organizations have improved automated fault resolution by 25%.

This centralization minimizes manual oversight overhead, successfully shielding critical operational assets from sophisticated external cyber threats.
Get Free Sample

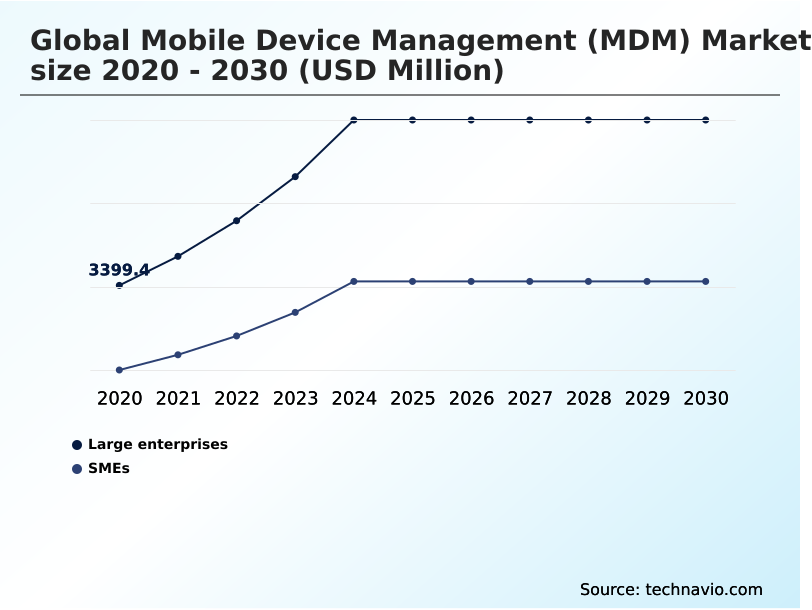
The Large enterprises segment was valued at USD 6.86 billion in 2024 and showed a gradual increase during the forecast period.
Get Free Sample

Regional Analysis

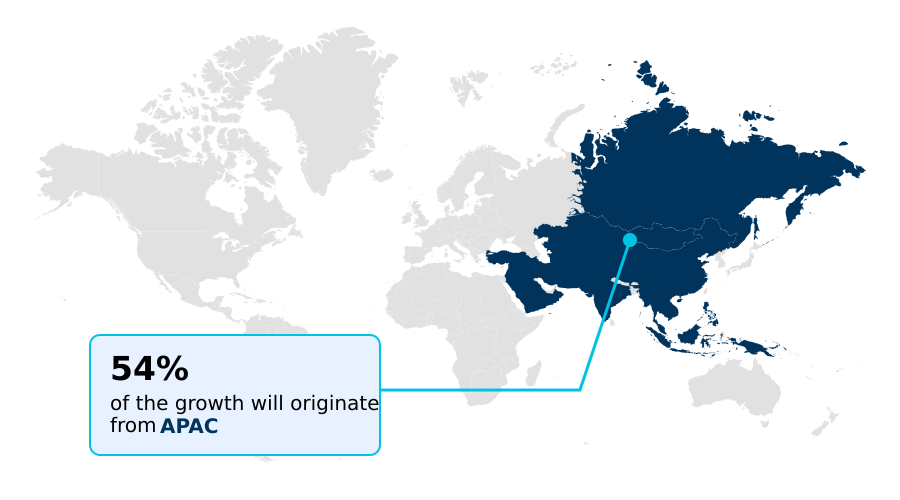
APAC is estimated to contribute 54.4% to the growth of the global market during the forecast period.Technavio’s analysts have elaborately explained the regional trends and drivers that shape the market during the forecast period.
See How Mobile Device Management (Mdm) Market Demand is Rising in APAC Get Free Sample

The geographic distribution of the Mobile Device Management (MDM) market reflects distinct regional compliance mandates and technology adoption rates.

North American enterprises dominate cloud transitions, utilizing software as a service delivery to achieve 45% faster deployment times compared to traditional models. Conversely, European organizations favor localized on premise infrastructure and rigorous network traffic encryption to satisfy strict privacy regulations.

Across APAC, the rapid industrialization of mobile operations demands advanced hardware backed security attestation and predictive maintenance algorithms to manage heterogeneous hardware fleets. Businesses globally integrate telemetry analytics services and automated configuration profiles within unified administration consoles to streamline oversight.

By prioritizing proactive vulnerability mitigation strategies and robust network intrusion defense, organizations in these mature regions reduce IT helpdesk ticketing by 30%, optimizing resource allocation for distributed workforce management.

Market Dynamics

Our researchers analyzed the data with 2025 as the base year, along with the key drivers, trends, and challenges. A holistic analysis of drivers will help companies refine their marketing strategies to gain a competitive advantage.

  • The operational stability of modern enterprises depends heavily on securing decentralized hardware ecosystems, driving continuous expansion within the Mobile Device Management (MDM) sector. As organizations transition toward permanent hybrid work models, the reliance on remote administration platforms becomes an absolute necessity for maintaining uninterrupted productivity.
  • To protect sensitive intellectual property, IT administrators strictly enforce containerization for corporate data separation, ensuring that proprietary databases remain isolated from unverified personal applications. This compartmentalization is critical for compliance and risk management across highly regulated industries.
  • Furthermore, the integration of automated patch deployment for smartphones guarantees that all field devices receive critical vulnerability updates instantaneously, minimizing exposure to sophisticated cyber threats. The implementation of zero trust architecture for endpoints forces continuous behavioral authentication, denying network access to any device exhibiting anomalous telemetry.
  • When hardware is compromised or lost, security teams execute remote wipe functionality over cellular networks to permanently erase local corporate partitions, preventing unauthorized data exfiltration. Streamlining device onboarding, administrators utilize over the air device provisioning to configure security profiles and software credentials instantly without manual intervention.
  • Organizations adopting these comprehensive mobility frameworks achieve a 40% faster compliance audit completion rate compared to entities utilizing fragmented oversight strategies. By consolidating these capabilities into a single administrative pane, businesses effectively neutralize digital vulnerabilities, optimize resource allocation, and ensure resilient operational continuity across vast geographic landscapes.
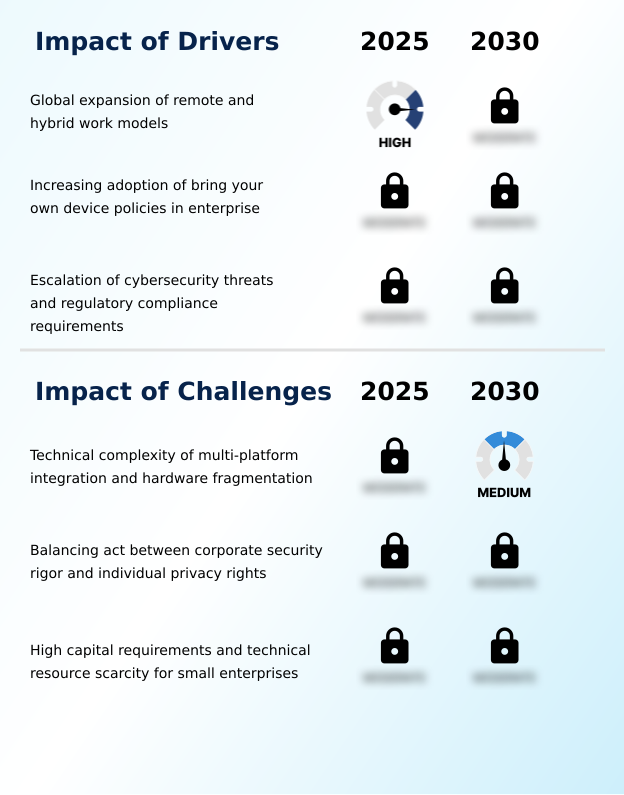
What are the key market drivers leading to the rise in the adoption of Mobile Device Management (Mdm) Industry?

  • The global expansion of remote and hybrid work models serves as a primary driver for the market, compelling organizations to adopt robust centralized platforms to secure decentralized hardware endpoints.

  • The global transition toward decentralized operations necessitates robust hybrid workforce infrastructure to maintain continuous oversight of off-premise endpoints. Widespread adoption of bring your own device policies introduces severe security vulnerabilities, elevating the need for comprehensive cybersecurity threat mitigation.
  • To address these risks, administrators deploy enterprise mobility suites that facilitate seamless over the air provisioning and unified endpoint orchestration. Implementing strict role based access configurations paired with advanced threat detection heuristics allows organizations to defend against malicious data exfiltration.
  • Consequently, the reliance on remote wipe functionality becomes a critical defense mechanism for intellectual property protection in the event of hardware theft.
  • By centralizing these controls, enterprises have successfully reduced endpoint breach incidents by 40%, securing operational continuity across geographically distributed teams.

What are the market trends shaping the Mobile Device Management (Mdm) Industry?

  • The integration of artificial intelligence and machine learning into automated device remediation represents a pivotal trend in the market. This technological evolution enables proactive vulnerability management and significantly reduces manual administrative workloads across complex hardware ecosystems.

  • The Mobile Device Management (MDM) market is evolving rapidly as organizations integrate artificial intelligence to shift from reactive monitoring to proactive self-healing infrastructure. Machine learning telemetry analyzes vast amounts of device telemetry data to identify system vulnerabilities before exploitation. This transition enables an autonomous remediation engine to resolve over 90% of configuration drift issues without human intervention.
  • To support a seamless digital employee experience, companies utilize multi tenant cloud environments for agile software as a service delivery. Integrating zero trust network access with biometric identity verification enforces strict identity validation for every connection request. Furthermore, zero touch enrollment pipelines and automated patch deployment streamline onboarding and maintenance across the expanding industrial iot ecosystem.
  • Consequently, IT departments report operational efficiency improvements exceeding 35%, ensuring uninterrupted productivity while neutralizing sophisticated network threats across heterogeneous endpoints.

What challenges does the Mobile Device Management (Mdm) Industry face during its growth?

  • The technical complexity associated with multi-platform integration and hardware fragmentation remains a significant challenge, restricting seamless interoperability and increasing administrative burdens for enterprise mobility deployments.

  • The lack of mobile firmware standardization across fragmented hardware ecosystems severely limits seamless integration and heightens administrative complexity. Achieving robust cross platform endpoint security demands significant technical resources to reconcile disparate operating systems. Organizations struggle to deploy containerized application workspaces effectively, complicating the isolation of corporate data from personal applications.
  • Furthermore, navigating complex cryptographic key distribution alongside conditional authentication frameworks strains internal IT capabilities. Stringent data sovereignty mandates and continuous regulatory compliance auditing escalate operational overhead, forcing enterprises to adopt restrictive corporate liability models. Managing malware attack prevention while maintaining strict endpoint resilience protocols requires continuous policy updates.
  • Consequently, these compounding technical barriers have increased compliance deployment costs by 22% for mid-sized organizations, hindering the rapid scaling of advanced mobility operations.

Exclusive Technavio Analysis on Customer Landscape

The mobile device management (mdm) market forecasting report includes the adoption lifecycle of the market, covering from the innovator’s stage to the laggard’s stage. It focuses on adoption rates in different regions based on penetration. Furthermore, the mobile device management (mdm) market report also includes key purchase criteria and drivers of price sensitivity to help companies evaluate and develop their market growth analysis strategies.
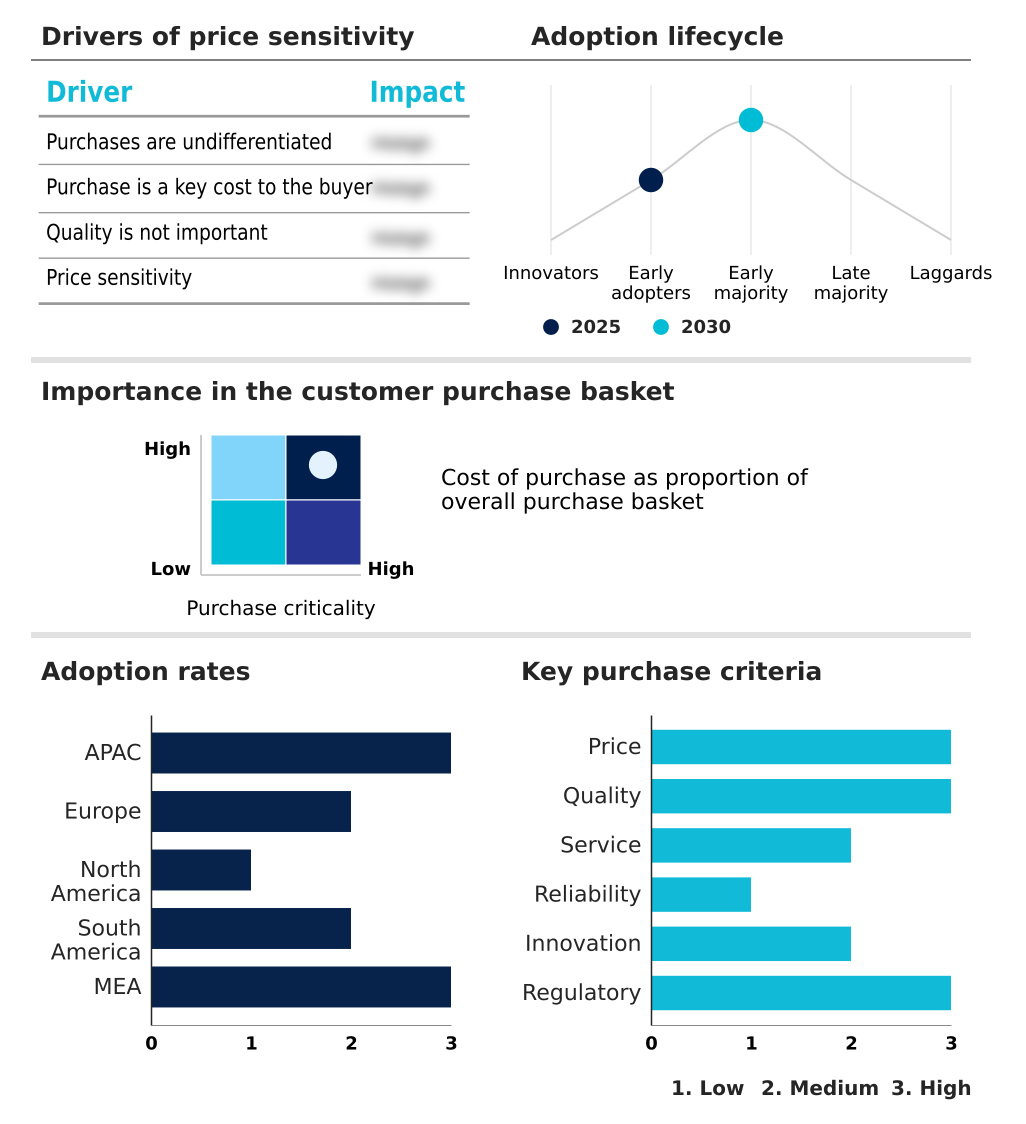
Customer Landscape of Mobile Device Management (Mdm) Industry

Competitive Landscape

Companies are implementing various strategies, such as strategic alliances, mobile device management (mdm) market forecast, partnerships, mergers and acquisitions, geographical expansion, and product/service launches, to enhance their presence in the industry.

42Gears Mobility Systems Ltd. - Delivers comprehensive mobile device management platforms featuring unified endpoint security, remote application configuration, automated patching, and robust digital workspace monitoring to optimize administrative oversight and regulatory compliance.

The industry research and growth report includes detailed analyses of the competitive landscape of the market and information about key companies, including:

  • 42Gears Mobility Systems Ltd.
  • AppTec360 AG
  • baramundi software GmbH
  • BlackBerry Ltd.
  • Cisco Systems Inc.
  • Citrix Systems Inc.
  • Esper.io Inc.
  • IBM Corp.
  • Ivanti Software Inc.
  • JAMF Holding Corp.
  • ManageEngine
  • Matrix42 GmbH
  • Microsoft Corp.
  • Miradore Oy
  • Mitsogo Inc.
  • NinjaOne LLC
  • Omnissa Inc.
  • Scalefusion
  • Sophos Group Ltd.
  • SOTI Inc.

Qualitative and quantitative analysis of companies has been conducted to help clients understand the wider business environment as well as the strengths and weaknesses of key industry players. Data is qualitatively analyzed to categorize companies as pure play, category-focused, industry-focused, and diversified; it is quantitatively analyzed to categorize companies as dominant, leading, strong, tentative, and weak.

Recent Development and News in Mobile device management (mdm) market

  • In the Application Software industry, the transition toward multi tenant cloud environments accelerated software as a service delivery models, directly impacting Mobile Device Management (MDM) demand by enabling enterprises to manage high-volume endpoints with a 40% reduction in local server overhead.
  • The implementation of strict data sovereignty mandates across the European Union compelled application developers to redesign data localization frameworks, increasing the necessity for regulatory compliance auditing capabilities within Mobile Device Management (MDM) solutions to avoid non-compliance penalties.
  • Advancements in automated patch deployment algorithms for enterprise software ecosystems streamlined systemic vulnerability remediation, boosting Mobile Device Management (MDM) adoption as organizations sought to enhance endpoint resilience protocols across remote workforces with 90% automation efficiency.
  • The proliferation of bring your own device policies in corporate IT strategies necessitated robust separation of personal and professional data within applications, driving Mobile Device Management (MDM) providers to integrate zero touch enrollment pipelines that accelerated device onboarding by 35%.

Dive into Technavio’s robust research methodology, blending expert interviews, extensive data synthesis, and validated models for unparalleled Mobile Device Management (Mdm) Market insights. See full methodology.

Market Scope
Page number 287
Base year 2025
Historic period 2020-2024
Forecast period 2026-2030
Growth momentum & CAGR Accelerate at a CAGR of 28.7%
Market growth 2026-2030 USD 32261.7 million
Market structure Fragmented
YoY growth 2025-2026(%) 24.5%
Key countries China, Japan, India, South Korea, Australia, Indonesia, Germany, UK, France, Italy, Spain, The Netherlands, US, Canada, Mexico, Brazil, Argentina, Chile, UAE, Saudi Arabia, South Africa, Israel and Turkey
Competitive landscape Leading Companies, Market Positioning of Companies, Competitive Strategies, and Industry Risks

Request Free Sample

Research Analyst Overview

  • The continuous evolution of the Mobile Device Management (MDM) market reflects an enterprise imperative to secure expanding digital boundaries against sophisticated intrusion tactics. Organizations are aggressively redesigning their digital workspace architectures to accommodate decentralized workforces, shifting from perimeter defense to persistent zero trust network access.
  • This strategic realignment forces IT leadership to evaluate security platforms based on their ability to execute seamless cryptographic key distribution and hardware backed security attestation across diverse hardware fleets. Advanced telemetry analytics services process vast amounts of endpoint data, enabling predictive maintenance algorithms to anticipate hardware failures before they disrupt field operations.
  • Concurrently, the integration of an autonomous remediation engine allows platforms to correct configuration drift instantly, ensuring continuous alignment with enterprise security baselines. Companies adopting these automated configuration profiles report a 30% reduction in unauthorized network access incidents, directly linking technical agility to measurable risk mitigation.
  • By consolidating mobile administrative functions, enterprises ensure stringent compliance, enhance frontline productivity, and successfully insulate proprietary assets from emerging operational vulnerabilities.

What are the Key Data Covered in this Mobile Device Management (Mdm) Market Research and Growth Report?

  • What is the expected growth of the Mobile Device Management (Mdm) Market between 2026 and 2030?

    • USD 32.26 billion, at a CAGR of 28.7%

  • What segmentation does the market report cover?

    • The report is segmented by End-user (Large enterprises, and SMEs), Deployment (On premise, and Cloud based), Component (Solutions, and Services) and Geography (APAC, Europe, North America, South America, Middle East and Africa)

  • Which regions are analyzed in the report?

    • APAC, Europe, North America, South America and Middle East and Africa

  • What are the key growth drivers and market challenges?

    • Global expansion of remote and hybrid work models , Technical complexity of multi-platform integration and hardware fragmentation

  • Who are the major players in the Mobile Device Management (Mdm) Market?

    • 42Gears Mobility Systems Ltd., AppTec360 AG, baramundi software GmbH, BlackBerry Ltd., Cisco Systems Inc., Citrix Systems Inc., Esper.io Inc., IBM Corp., Ivanti Software Inc., JAMF Holding Corp., ManageEngine, Matrix42 GmbH, Microsoft Corp., Miradore Oy, Mitsogo Inc., NinjaOne LLC, Omnissa Inc., Scalefusion, Sophos Group Ltd. and SOTI Inc.

Market Research Insights

  • The Mobile Device Management (MDM) market provides the essential framework for securing decentralized corporate hardware operations. Organizations leverage multi tenant cloud environments to orchestrate zero touch enrollment pipelines, streamlining the onboarding of remote hardware assets. The widespread integration of bring your own device frameworks demands robust containerization to ensure effective malware attack prevention without compromising user privacy.
  • Deploying these centralized oversight solutions enables enterprises to execute rigorous regulatory compliance auditing seamlessly. Facilities implementing these advanced endpoint security protocols experience a 45% decrease in unauthorized access attempts. Furthermore, transitioning to automated policy enforcement reduces IT helpdesk diagnostic times by 30%, optimizing administrative workflows and significantly bolstering long-term operational resilience across distributed workforces.

We can help! Our analysts can customize this mobile device management (mdm) market research report to meet your requirements.

Get in touch

1. Executive Summary

1.1 Market overview

Executive Summary - Chart on Market Overview
Executive Summary - Data Table on Market Overview
Executive Summary - Chart on Global Market Characteristics
Executive Summary - Chart on Market by Geography
Executive Summary - Chart on Market Segmentation by End-user
Executive Summary - Chart on Market Segmentation by Deployment
Executive Summary - Chart on Market Segmentation by Component
Executive Summary - Chart on Incremental Growth
Executive Summary - Data Table on Incremental Growth
Executive Summary - Chart on Company Market Positioning

2. Technavio Analysis

2.1 Analysis of price sensitivity, lifecycle, customer purchase basket, adoption rates, and purchase criteria

2.2 Criticality of inputs and Factors of differentiation

Chart on Overview on criticality of inputs and factors of differentiation

2.3 Factors of disruption

Chart on Overview on factors of disruption

2.4 Impact of drivers and challenges

Chart on Impact of drivers and challenges in 2025 and 2030

3. Market Landscape

3.1 Market ecosystem

Chart on Parent Market
Data Table on - Parent Market

3.2 Market characteristics

Chart on Market characteristics analysis

3.3 Value chain analysis

Chart on Value chain analysis

4. Market Sizing

4.1 Market definition

Data Table on Offerings of companies included in the market definition

4.2 Market segment analysis

Market segments

4.3 Market size 2025

4.4 Market outlook: Forecast for 2025-2030

Chart on Global - Market size and forecast 2025-2030 ($ million)
Data Table on Global - Market size and forecast 2025-2030 ($ million)
Chart on Global Market: Year-over-year growth 2025-2030 (%)
Data Table on Global Market: Year-over-year growth 2025-2030 (%)

5. Historic Market Size

5.1 Global Mobile Device Management (MDM) Market 2020 - 2024

Historic Market Size - Data Table on Global Mobile Device Management (MDM) Market 2020 - 2024 ($ million)

5.2 End-user segment analysis 2020 - 2024

Historic Market Size - End-user Segment 2020 - 2024 ($ million)

5.3 Deployment segment analysis 2020 - 2024

Historic Market Size - Deployment Segment 2020 - 2024 ($ million)

5.4 Component segment analysis 2020 - 2024

Historic Market Size - Component Segment 2020 - 2024 ($ million)

5.5 Geography segment analysis 2020 - 2024

Historic Market Size - Geography Segment 2020 - 2024 ($ million)

5.6 Country segment analysis 2020 - 2024

Historic Market Size - Country Segment 2020 - 2024 ($ million)

6. Qualitative Analysis

6.1 Impact of AI on Global Mobile Device Management (MDM) Market

6.2 Impact of Geopolitical Conflicts on Global Mobile Device Management (MDM) Market

7. Five Forces Analysis

7.1 Five forces summary

Five forces analysis - Comparison between 2025 and 2030

7.2 Bargaining power of buyers

Bargaining power of buyers - Impact of key factors 2025 and 2030

7.3 Bargaining power of suppliers

Bargaining power of suppliers - Impact of key factors in 2025 and 2030

7.4 Threat of new entrants

Threat of new entrants - Impact of key factors in 2025 and 2030

7.5 Threat of substitutes

Threat of substitutes - Impact of key factors in 2025 and 2030

7.6 Threat of rivalry

Threat of rivalry - Impact of key factors in 2025 and 2030

7.7 Market condition

Chart on Market condition - Five forces 2025 and 2030

8. Market Segmentation by End-user

8.1 Market segments

Chart on End-user - Market share 2025-2030 (%)
Data Table on End-user - Market share 2025-2030 (%)

8.2 Comparison by End-user

Chart on Comparison by End-user
Data Table on Comparison by End-user

8.3 Large enterprises - Market size and forecast 2025-2030

Chart on Large enterprises - Market size and forecast 2025-2030 ($ million)
Data Table on Large enterprises - Market size and forecast 2025-2030 ($ million)
Chart on Large enterprises - Year-over-year growth 2025-2030 (%)
Data Table on Large enterprises - Year-over-year growth 2025-2030 (%)

8.4 SMEs - Market size and forecast 2025-2030

Chart on SMEs - Market size and forecast 2025-2030 ($ million)
Data Table on SMEs - Market size and forecast 2025-2030 ($ million)
Chart on SMEs - Year-over-year growth 2025-2030 (%)
Data Table on SMEs - Year-over-year growth 2025-2030 (%)

8.5 Market opportunity by End-user

Market opportunity by End-user ($ million)
Data Table on Market opportunity by End-user ($ million)

9. Market Segmentation by Deployment

9.1 Market segments

Chart on Deployment - Market share 2025-2030 (%)
Data Table on Deployment - Market share 2025-2030 (%)

9.2 Comparison by Deployment

Chart on Comparison by Deployment
Data Table on Comparison by Deployment

9.3 On premise - Market size and forecast 2025-2030

Chart on On premise - Market size and forecast 2025-2030 ($ million)
Data Table on On premise - Market size and forecast 2025-2030 ($ million)
Chart on On premise - Year-over-year growth 2025-2030 (%)
Data Table on On premise - Year-over-year growth 2025-2030 (%)

9.4 Cloud based - Market size and forecast 2025-2030

Chart on Cloud based - Market size and forecast 2025-2030 ($ million)
Data Table on Cloud based - Market size and forecast 2025-2030 ($ million)
Chart on Cloud based - Year-over-year growth 2025-2030 (%)
Data Table on Cloud based - Year-over-year growth 2025-2030 (%)

9.5 Market opportunity by Deployment

Market opportunity by Deployment ($ million)
Data Table on Market opportunity by Deployment ($ million)

10. Market Segmentation by Component

10.1 Market segments

Chart on Component - Market share 2025-2030 (%)
Data Table on Component - Market share 2025-2030 (%)

10.2 Comparison by Component

Chart on Comparison by Component
Data Table on Comparison by Component

10.3 Solutions - Market size and forecast 2025-2030

Chart on Solutions - Market size and forecast 2025-2030 ($ million)
Data Table on Solutions - Market size and forecast 2025-2030 ($ million)
Chart on Solutions - Year-over-year growth 2025-2030 (%)
Data Table on Solutions - Year-over-year growth 2025-2030 (%)

10.4 Services - Market size and forecast 2025-2030

Chart on Services - Market size and forecast 2025-2030 ($ million)
Data Table on Services - Market size and forecast 2025-2030 ($ million)
Chart on Services - Year-over-year growth 2025-2030 (%)
Data Table on Services - Year-over-year growth 2025-2030 (%)

10.5 Market opportunity by Component

Market opportunity by Component ($ million)
Data Table on Market opportunity by Component ($ million)

11. Customer Landscape

11.1 Customer landscape overview

Analysis of price sensitivity, lifecycle, customer purchase basket, adoption rates, and purchase criteria

12. Geographic Landscape

12.1 Geographic segmentation

Chart on Market share by geography 2025-2030 (%)
Data Table on Market share by geography 2025-2030 (%)

12.2 Geographic comparison

Chart on Geographic comparison
Data Table on Geographic comparison

12.3 APAC - Market size and forecast 2025-2030

Chart on APAC - Market size and forecast 2025-2030 ($ million)
Data Table on APAC - Market size and forecast 2025-2030 ($ million)
Chart on APAC - Year-over-year growth 2025-2030 (%)
Data Table on APAC - Year-over-year growth 2025-2030 (%)
Chart on Regional Comparison - APAC
Data Table on Regional Comparison - APAC

12.3.1 China - Market size and forecast 2025-2030

Chart on China - Market size and forecast 2025-2030 ($ million)
Data Table on China - Market size and forecast 2025-2030 ($ million)
Chart on China - Year-over-year growth 2025-2030 (%)
Data Table on China - Year-over-year growth 2025-2030 (%)

12.3.2 Japan - Market size and forecast 2025-2030

Chart on Japan - Market size and forecast 2025-2030 ($ million)
Data Table on Japan - Market size and forecast 2025-2030 ($ million)
Chart on Japan - Year-over-year growth 2025-2030 (%)
Data Table on Japan - Year-over-year growth 2025-2030 (%)

12.3.3 India - Market size and forecast 2025-2030

Chart on India - Market size and forecast 2025-2030 ($ million)
Data Table on India - Market size and forecast 2025-2030 ($ million)
Chart on India - Year-over-year growth 2025-2030 (%)
Data Table on India - Year-over-year growth 2025-2030 (%)

12.3.4 South Korea - Market size and forecast 2025-2030

Chart on South Korea - Market size and forecast 2025-2030 ($ million)
Data Table on South Korea - Market size and forecast 2025-2030 ($ million)
Chart on South Korea - Year-over-year growth 2025-2030 (%)
Data Table on South Korea - Year-over-year growth 2025-2030 (%)

12.3.5 Australia - Market size and forecast 2025-2030

Chart on Australia - Market size and forecast 2025-2030 ($ million)
Data Table on Australia - Market size and forecast 2025-2030 ($ million)
Chart on Australia - Year-over-year growth 2025-2030 (%)
Data Table on Australia - Year-over-year growth 2025-2030 (%)

12.3.6 Indonesia - Market size and forecast 2025-2030

Chart on Indonesia - Market size and forecast 2025-2030 ($ million)
Data Table on Indonesia - Market size and forecast 2025-2030 ($ million)
Chart on Indonesia - Year-over-year growth 2025-2030 (%)
Data Table on Indonesia - Year-over-year growth 2025-2030 (%)

12.4 Europe - Market size and forecast 2025-2030

Chart on Europe - Market size and forecast 2025-2030 ($ million)
Data Table on Europe - Market size and forecast 2025-2030 ($ million)
Chart on Europe - Year-over-year growth 2025-2030 (%)
Data Table on Europe - Year-over-year growth 2025-2030 (%)
Chart on Regional Comparison - Europe
Data Table on Regional Comparison - Europe

12.4.1 Germany - Market size and forecast 2025-2030

Chart on Germany - Market size and forecast 2025-2030 ($ million)
Data Table on Germany - Market size and forecast 2025-2030 ($ million)
Chart on Germany - Year-over-year growth 2025-2030 (%)
Data Table on Germany - Year-over-year growth 2025-2030 (%)

12.4.2 UK - Market size and forecast 2025-2030

Chart on UK - Market size and forecast 2025-2030 ($ million)
Data Table on UK - Market size and forecast 2025-2030 ($ million)
Chart on UK - Year-over-year growth 2025-2030 (%)
Data Table on UK - Year-over-year growth 2025-2030 (%)

12.4.3 France - Market size and forecast 2025-2030

Chart on France - Market size and forecast 2025-2030 ($ million)
Data Table on France - Market size and forecast 2025-2030 ($ million)
Chart on France - Year-over-year growth 2025-2030 (%)
Data Table on France - Year-over-year growth 2025-2030 (%)

12.4.4 Italy - Market size and forecast 2025-2030

Chart on Italy - Market size and forecast 2025-2030 ($ million)
Data Table on Italy - Market size and forecast 2025-2030 ($ million)
Chart on Italy - Year-over-year growth 2025-2030 (%)
Data Table on Italy - Year-over-year growth 2025-2030 (%)

12.4.5 Spain - Market size and forecast 2025-2030

Chart on Spain - Market size and forecast 2025-2030 ($ million)
Data Table on Spain - Market size and forecast 2025-2030 ($ million)
Chart on Spain - Year-over-year growth 2025-2030 (%)
Data Table on Spain - Year-over-year growth 2025-2030 (%)

12.4.6 The Netherlands - Market size and forecast 2025-2030

Chart on The Netherlands - Market size and forecast 2025-2030 ($ million)
Data Table on The Netherlands - Market size and forecast 2025-2030 ($ million)
Chart on The Netherlands - Year-over-year growth 2025-2030 (%)
Data Table on The Netherlands - Year-over-year growth 2025-2030 (%)

12.5 North America - Market size and forecast 2025-2030

Chart on North America - Market size and forecast 2025-2030 ($ million)
Data Table on North America - Market size and forecast 2025-2030 ($ million)
Chart on North America - Year-over-year growth 2025-2030 (%)
Data Table on North America - Year-over-year growth 2025-2030 (%)
Chart on Regional Comparison - North America
Data Table on Regional Comparison - North America

12.5.1 US - Market size and forecast 2025-2030

Chart on US - Market size and forecast 2025-2030 ($ million)
Data Table on US - Market size and forecast 2025-2030 ($ million)
Chart on US - Year-over-year growth 2025-2030 (%)
Data Table on US - Year-over-year growth 2025-2030 (%)

12.5.2 Canada - Market size and forecast 2025-2030

Chart on Canada - Market size and forecast 2025-2030 ($ million)
Data Table on Canada - Market size and forecast 2025-2030 ($ million)
Chart on Canada - Year-over-year growth 2025-2030 (%)
Data Table on Canada - Year-over-year growth 2025-2030 (%)

12.5.3 Mexico - Market size and forecast 2025-2030

Chart on Mexico - Market size and forecast 2025-2030 ($ million)
Data Table on Mexico - Market size and forecast 2025-2030 ($ million)
Chart on Mexico - Year-over-year growth 2025-2030 (%)
Data Table on Mexico - Year-over-year growth 2025-2030 (%)

12.6 South America - Market size and forecast 2025-2030

Chart on South America - Market size and forecast 2025-2030 ($ million)
Data Table on South America - Market size and forecast 2025-2030 ($ million)
Chart on South America - Year-over-year growth 2025-2030 (%)
Data Table on South America - Year-over-year growth 2025-2030 (%)
Chart on Regional Comparison - South America
Data Table on Regional Comparison - South America

12.6.1 Brazil - Market size and forecast 2025-2030

Chart on Brazil - Market size and forecast 2025-2030 ($ million)
Data Table on Brazil - Market size and forecast 2025-2030 ($ million)
Chart on Brazil - Year-over-year growth 2025-2030 (%)
Data Table on Brazil - Year-over-year growth 2025-2030 (%)

12.6.2 Argentina - Market size and forecast 2025-2030

Chart on Argentina - Market size and forecast 2025-2030 ($ million)
Data Table on Argentina - Market size and forecast 2025-2030 ($ million)
Chart on Argentina - Year-over-year growth 2025-2030 (%)
Data Table on Argentina - Year-over-year growth 2025-2030 (%)

12.6.3 Chile - Market size and forecast 2025-2030

Chart on Chile - Market size and forecast 2025-2030 ($ million)
Data Table on Chile - Market size and forecast 2025-2030 ($ million)
Chart on Chile - Year-over-year growth 2025-2030 (%)
Data Table on Chile - Year-over-year growth 2025-2030 (%)

12.7 Middle East and Africa - Market size and forecast 2025-2030

Chart on Middle East and Africa - Market size and forecast 2025-2030 ($ million)
Data Table on Middle East and Africa - Market size and forecast 2025-2030 ($ million)
Chart on Middle East and Africa - Year-over-year growth 2025-2030 (%)
Data Table on Middle East and Africa - Year-over-year growth 2025-2030 (%)
Chart on Regional Comparison - Middle East and Africa
Data Table on Regional Comparison - Middle East and Africa

12.7.1 UAE - Market size and forecast 2025-2030

Chart on UAE - Market size and forecast 2025-2030 ($ million)
Data Table on UAE - Market size and forecast 2025-2030 ($ million)
Chart on UAE - Year-over-year growth 2025-2030 (%)
Data Table on UAE - Year-over-year growth 2025-2030 (%)

12.7.2 Saudi Arabia - Market size and forecast 2025-2030

Chart on Saudi Arabia - Market size and forecast 2025-2030 ($ million)
Data Table on Saudi Arabia - Market size and forecast 2025-2030 ($ million)
Chart on Saudi Arabia - Year-over-year growth 2025-2030 (%)
Data Table on Saudi Arabia - Year-over-year growth 2025-2030 (%)

12.7.3 South Africa - Market size and forecast 2025-2030

Chart on South Africa - Market size and forecast 2025-2030 ($ million)
Data Table on South Africa - Market size and forecast 2025-2030 ($ million)
Chart on South Africa - Year-over-year growth 2025-2030 (%)
Data Table on South Africa - Year-over-year growth 2025-2030 (%)

12.7.4 Israel - Market size and forecast 2025-2030

Chart on Israel - Market size and forecast 2025-2030 ($ million)
Data Table on Israel - Market size and forecast 2025-2030 ($ million)
Chart on Israel - Year-over-year growth 2025-2030 (%)
Data Table on Israel - Year-over-year growth 2025-2030 (%)

12.7.5 Turkey - Market size and forecast 2025-2030

Chart on Turkey - Market size and forecast 2025-2030 ($ million)
Data Table on Turkey - Market size and forecast 2025-2030 ($ million)
Chart on Turkey - Year-over-year growth 2025-2030 (%)
Data Table on Turkey - Year-over-year growth 2025-2030 (%)

12.8 Market opportunity by geography

Market opportunity by geography ($ million)
Data Tables on Market opportunity by geography ($ million)

13. Drivers, Challenges, and Opportunity

13.1 Market drivers

Global expansion of remote and hybrid work models
Increasing adoption of bring your own device policies in enterprise
Escalation of cybersecurity threats and regulatory compliance requirements

13.2 Market challenges

Technical complexity of multi-platform integration and hardware fragmentation
Balancing act between corporate security rigor and individual privacy rights
High capital requirements and technical resource scarcity for small enterprises

13.3 Impact of drivers and challenges

Impact of drivers and challenges in 2025 and 2030

13.4 Market opportunities

Evolution of AI and machine learning in automated device remediation
Global paradigm shift toward zero trust architecture and conditional access protocols
Convergence of unified endpoint management with industrial IoT ecosystems

14. Competitive Landscape

14.1 Overview

14.2

Overview on criticality of inputs and factors of differentiation

14.3 Landscape disruption

Overview on factors of disruption

14.4 Industry risks

Impact of key risks on business

15. Competitive Analysis

15.1 Companies profiled

Companies covered

15.2 Company ranking index

15.3 Market positioning of companies

Matrix on companies position and classification

15.4 baramundi software GmbH

baramundi software GmbH - Overview
baramundi software GmbH - Product / Service
baramundi software GmbH - Key offerings
SWOT

15.5 BlackBerry Ltd.

BlackBerry Ltd. - Overview
BlackBerry Ltd. - Business segments
BlackBerry Ltd. - Key offerings
BlackBerry Ltd. - Segment focus
SWOT

15.6 Cisco Systems Inc.

Cisco Systems Inc. - Overview
Cisco Systems Inc. - Business segments
Cisco Systems Inc. - Key news
Cisco Systems Inc. - Key offerings
Cisco Systems Inc. - Segment focus
SWOT

15.7 Citrix Systems Inc.

Citrix Systems Inc. - Overview
Citrix Systems Inc. - Product / Service
Citrix Systems Inc. - Key offerings
SWOT

15.8 IBM Corp.

IBM Corp. - Overview
IBM Corp. - Business segments
IBM Corp. - Key news
IBM Corp. - Key offerings
IBM Corp. - Segment focus
SWOT

15.9 Ivanti Software Inc.

Ivanti Software Inc. - Overview
Ivanti Software Inc. - Product / Service
Ivanti Software Inc. - Key offerings
SWOT

15.10 JAMF Holding Corp.

JAMF Holding Corp. - Overview
JAMF Holding Corp. - Product / Service
JAMF Holding Corp. - Key offerings
SWOT

15.11 ManageEngine

ManageEngine - Overview
ManageEngine - Product / Service
ManageEngine - Key offerings
SWOT

15.12 Matrix42 GmbH

Matrix42 GmbH - Overview
Matrix42 GmbH - Product / Service
Matrix42 GmbH - Key offerings
SWOT

15.13 Microsoft Corp.

Microsoft Corp. - Overview
Microsoft Corp. - Business segments
Microsoft Corp. - Key news
Microsoft Corp. - Key offerings
Microsoft Corp. - Segment focus
SWOT

15.14 NinjaOne LLC

NinjaOne LLC - Overview
NinjaOne LLC - Product / Service
NinjaOne LLC - Key offerings
SWOT

15.15 Omnissa Inc.

Omnissa Inc. - Overview
Omnissa Inc. - Product / Service
Omnissa Inc. - Key offerings
SWOT

15.16 Scalefusion

Scalefusion - Overview
Scalefusion - Product / Service
Scalefusion - Key offerings
SWOT

15.17 Sophos Group Ltd.

Sophos Group Ltd. - Overview
Sophos Group Ltd. - Product / Service
Sophos Group Ltd. - Key offerings
SWOT

15.18 SOTI Inc.

SOTI Inc. - Overview
SOTI Inc. - Product / Service
SOTI Inc. - Key offerings
SWOT

16. Appendix

16.1 Scope of the report

Market definition
Objectives
Notes and caveats

16.2 Inclusions and exclusions checklist

Inclusions checklist
Exclusions checklist

16.3 Currency conversion rates for US$

16.4 Research methodology

16.5 Data procurement

Information sources

16.6 Data validation

16.7 Validation techniques employed for market sizing

16.8 Data synthesis

16.9 360 degree market analysis

16.10 List of abbreviations

Research Methodology

Technavio presents a detailed picture of the market by way of study, synthesis, and summation of data from multiple sources. The analysts have presented the various facets of the market with a particular focus on identifying the key industry influencers. The data thus presented is comprehensive, reliable, and the result of extensive research, both primary and secondary.

INFORMATION SOURCES

Primary sources

  • Manufacturers and suppliers
  • Channel partners
  • Industry experts
  • Strategic decision makers

Secondary sources

  • Industry journals and periodicals
  • Government data
  • Financial reports of key industry players
  • Historical data
  • Press releases

DATA ANALYSIS

Data Synthesis

  • Collation of data
  • Estimation of key figures
  • Analysis of derived insights

Data Validation

  • Triangulation with data models
  • Reference against proprietary databases
  • Corroboration with industry experts

REPORT WRITING

Qualitative

  • Market drivers
  • Market challenges
  • Market trends
  • Five forces analysis

Quantitative

  • Market size and forecast
  • Market segmentation
  • Geographical insights
  • Competitive landscape

Interested in this report?

Get your sample now to see our research methodology and insights!

Download Now

Frequently Asked Questions

Mobile Device Management (Mdm) market growth will increase by USD 32261.7 million during 2026-2030.

The Mobile Device Management (Mdm) market is expected to grow at a CAGR of 28.7% during 2026-2030.

Mobile Device Management (Mdm) market is segmented by End-user (Large enterprises, SMEs) Deployment (On premise, Cloud based) Component (Solutions, Services)

42Gears Mobility Systems Ltd., AppTec360 AG, baramundi software GmbH, BlackBerry Ltd., Cisco Systems Inc., Citrix Systems Inc., Esper.io Inc., IBM Corp., Ivanti Software Inc., JAMF Holding Corp., ManageEngine, Matrix42 GmbH, Microsoft Corp., Miradore Oy, Mitsogo Inc., NinjaOne LLC, Omnissa Inc., Scalefusion, Sophos Group Ltd., SOTI Inc. are a few of the key vendors in the Mobile Device Management (Mdm) market.

APAC will register the highest growth rate of 54.4% among the other regions. Therefore, the Mobile Device Management (Mdm) market in APAC is expected to garner significant business opportunities for the vendors during the forecast period.

China, Japan, India, South Korea, Australia, Indonesia, Germany, UK, France, Italy, Spain, The Netherlands, US, Canada, Mexico, Brazil, Argentina, Chile, UAE, Saudi Arabia, South Africa, Israel, Turkey

  • Global expansion of remote and hybrid work models is the driving factor this market.

The Mobile Device Management (Mdm) market vendors should focus on grabbing business opportunities from the End-user segment as it accounted for the largest market share in the base year.
RIA - Research AI Assistant
Ask RIA