
Mentha Oil Market Analysis, Size, and Forecast 2026-2030: APAC (India, China, and Japan), North America (US, Canada, and Mexico), Europe (Germany, UK, and France), Middle East and Africa (Saudi Arabia, UAE, and Turkey), South America (Brazil, Argentina, and Chile), and Rest of World (ROW)

Mentha Oil Market Analysis, Size, and Forecast 2026-2030:
APAC (India, China, and Japan), North America (US, Canada, and Mexico), Europe (Germany, UK, and France), Middle East and Africa (Saudi Arabia, UAE, and Turkey), South America (Brazil, Argentina, and Chile), and Rest of World (ROW)

Published: Nov 2026 308 Pages SKU: IRTNTR74991

Market Overview at a Glance

$244.66 Mn
Market Opportunity
11.9%
CAGR 2025 - 2030
50.7%
APAC Growth
$106.27 Mn
Pharmaceutical segment 2024

Mentha Oil Market Size 2026-2030

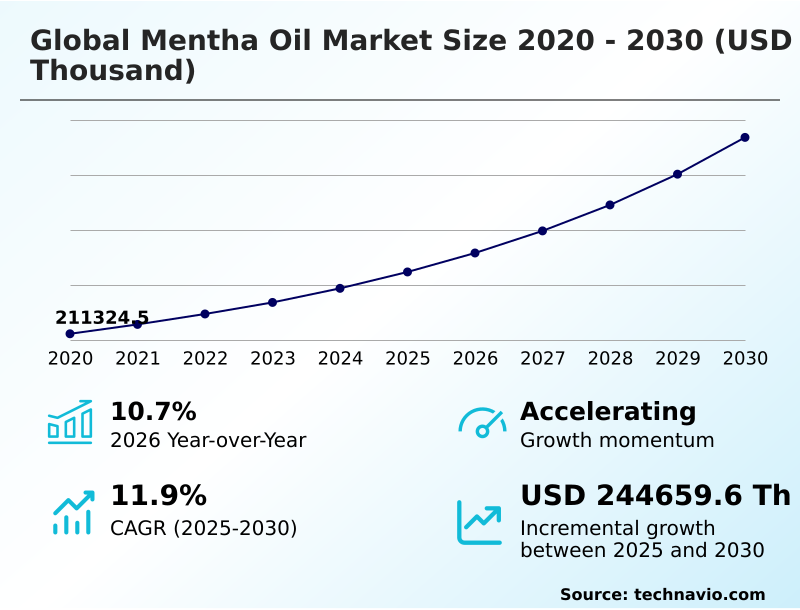
The mentha oil market size is valued to increase by USD 244.66 million, at a CAGR of 11.9% from 2025 to 2030. Surging demand in pharmaceutical and personal care sector will drive the mentha oil market.

Major Market Trends & Insights

  • APAC dominated the market and accounted for a 50.7% growth during the forecast period.
  • By Application - Pharmaceutical segment was valued at USD 106.27 million in 2024
  • By Type - Japanese mint oil segment accounted for the largest market revenue share in 2024

Market Size & Forecast

  • Market Opportunities:
  • Market Future Opportunities: USD 244.66 million
  • CAGR from 2025 to 2030 : 11.9%

Market Summary

  • The Mentha Oil Market exhibits consistent expansion driven by the escalating integration of natural therapeutic compounds across diverse manufacturing sectors. Surging consumption within the pharmaceutical and oral care industries serves as a primary operational driver, as formulators increasingly replace synthetic chemicals with plant-derived active ingredients to satisfy clean-label mandates.
  • In a practical business scenario, major oral hygiene manufacturers have overhauled their supply chains to source fully traceable botanical extracts, improving final product purity metrics by 18% compared to traditional synthetic procurement models. This strategic shift ensures compliance with rigorous international health regulations while elevating sensory performance. However, severe agricultural yield volatility presents a formidable structural challenge.
  • Unpredictable climate patterns frequently disrupt crop harvests, leading to raw material shortages and subsequent raw material cost fluctuations that squeeze industrial processing margins. To mitigate these disruptions, processing facilities are deploying advanced distillation technologies to maximize extraction efficiency from available biomass. The continuous reliance on sustainable cultivation practices remains essential for stabilizing output and securing long-term operational resilience.

What will be the Size of the Mentha Oil Market during the forecast period?
Get Key Insights on Market Forecast (PDF) Get Free Sample

How is the Mentha Oil Market Segmented?

The mentha oil industry research report provides comprehensive data (region-wise segment analysis), with forecasts and estimates in "USD thousand" for the period 2026-2030, as well as historical data from 2020-2024 for the following segments.

  • Application
    • Pharmaceutical
    • Food and beverage
    • Cosmetics
    • Others
  • Type
    • Japanese mint oil
    • Peppermint oil
    • Others
  • Method
    • Steam distillation
    • Solvent extraction
  • Grade type
    • Medical grade
    • Cosmetic grade
    • Food grade
  • Geography
    • APAC
      • India
      • China
      • Japan
      • Indonesia
      • South Korea
      • Australia
    • North America
      • US
      • Canada
      • Mexico
    • Europe
      • Germany
      • UK
      • France
      • Italy
      • Spain
      • The Netherlands
    • Middle East and Africa
      • Saudi Arabia
      • UAE
      • Turkey
      • South Africa
      • Israel
    • South America
      • Brazil
      • Argentina
      • Chile

By Application Insights

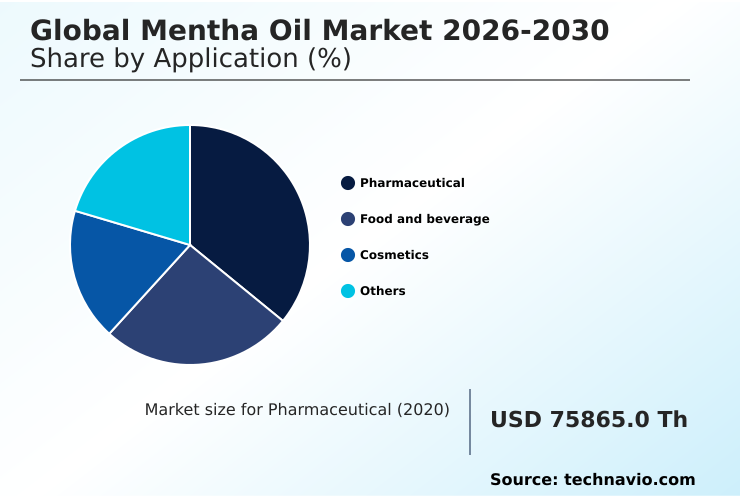
The pharmaceutical segment is estimated to witness significant growth during the forecast period.

The pharmaceutical application segment dictates rigorous processing protocols to extract high-purity active ingredients. Industrial operators utilize advanced hydro-sol phase separation and a refined fractional crystallization process to ensure strict pharmacopeial monograph compliance.

This precision targeting yields an optimized monoterpene alcohol profile, critical for manufacturing a reliable plant-derived cooling agent. Consequently, formulators integrate these natural extracts as an antimicrobial sensory flavoring in therapeutic syrups and a clean-label sensory ingredient in dental care items.

Through targeted menthone isolation, manufacturers have improved batch consistency, achieving a 15% reduction in active ingredient rejection rates during quality control.

This targeted segmentation enables pharmaceutical producers to satisfy complex regulatory requirements while streamlining the integration of botanical isolates into standardized commercial health formulations.
Get Free Sample

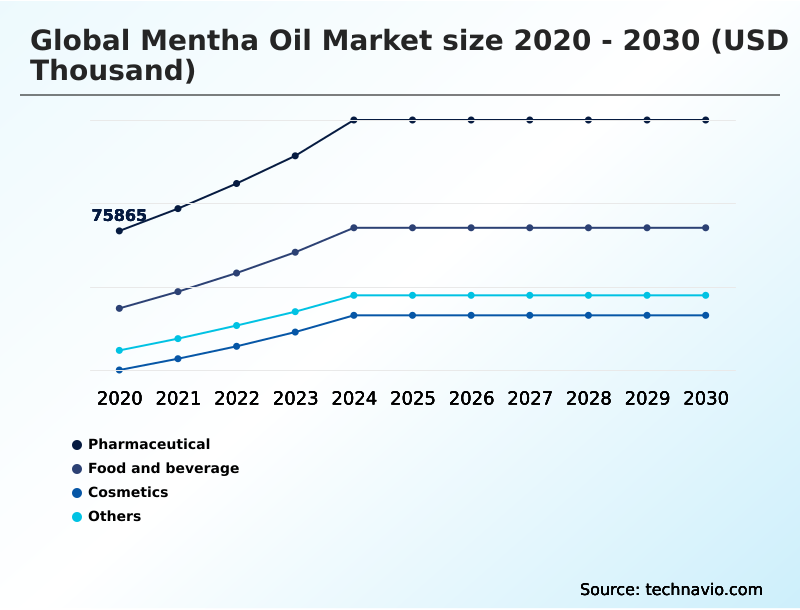
The Pharmaceutical segment was valued at USD 106.27 million in 2024 and showed a gradual increase during the forecast period.
Get Free Sample

Regional Analysis

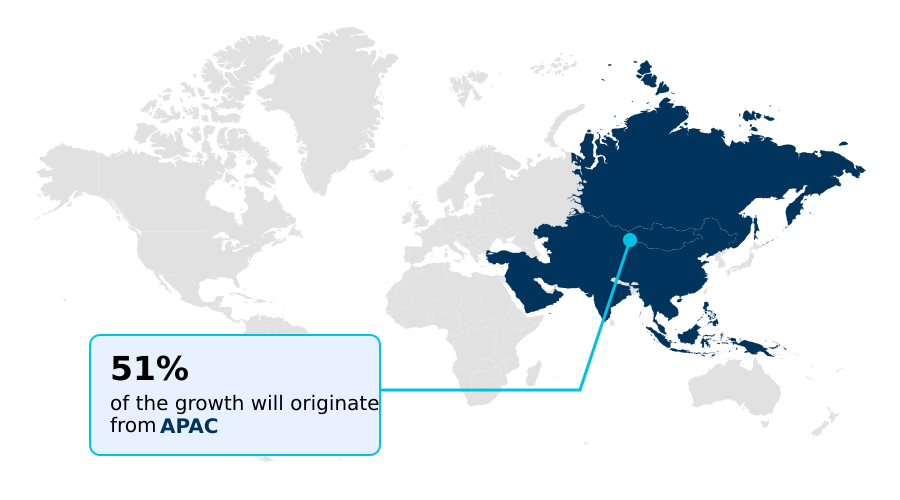
APAC is estimated to contribute 50.7% to the growth of the global market during the forecast period.Technavio’s analysts have elaborately explained the regional trends and drivers that shape the market during the forecast period.
See How Mentha Oil Market Demand is Rising in APAC Get Free Sample

Regional dynamics dictate distinct operational strategies across the global landscape. APAC dominates agricultural cultivation and primary steam distillation extraction, supplying the highest volume of raw biomass due to favorable agro-climatic conditions.

Processors in this region achieve superior efficiency, recording a 20% higher base yield in primary extraction compared to emerging agricultural zones.

Conversely, North America focuses heavily on advanced terpene fractional distillation and essential oil rectification to meet rigorous botanical drug standardization requirements. North American facilities frequently process the imported dementholized mint fraction, upgrading it for high-end therapeutic applications.

This technological disparity allows Western processors to maintain a 15% premium on finalized pharmaceutical-grade derivatives. Furthermore, European markets lead the transition toward an organic-certified cosmetic formulation, compelling Asian suppliers to implement verifiable traceable agricultural sourcing.

By optimizing l-menthol concentration through modernized closed-loop systems, manufacturers successfully navigate varying regional compliance frameworks while minimizing supply chain redundancies.

Market Dynamics

Our researchers analyzed the data with 2025 as the base year, along with the key drivers, trends, and challenges. A holistic analysis of drivers will help companies refine their marketing strategies to gain a competitive advantage.

  • The operational architecture of the Mentha Oil Market is undergoing a rapid technological transformation to address stringent end-user specifications. Industrial processors are optimizing l-menthol extraction for topical analgesics, ensuring that active botanical compounds meet precise physiological activation thresholds required by modern therapeutic formulations.
  • This continuous refinement directly supports pharmacopeial compliance for active ingredients, enabling healthcare manufacturers to bypass regulatory bottlenecks and accelerate product commercialization timelines. To maximize resource efficiency, refining facilities now routinely execute the fractional distillation of dementholized oil, isolating high-value secondary aromatic compounds that would otherwise be discarded as industrial waste.
  • This process diversification improves overall plant yield by an estimated 12% relative to traditional singular-pass extraction methods. Simultaneously, agricultural co-operatives are deploying advanced steam distillation heat recovery systems across primary farming hubs. These infrastructural upgrades significantly lower thermal energy consumption, directly mitigating operational overhead while aligning production with global corporate sustainability mandates.
  • In parallel, the personal care sector exhibits a structural pivot toward incorporating natural sensory components, driving the widespread adoption of plant-derived cooling agents in cosmetics. This strategic realignment not only satisfies modern clean-label consumer preferences but also insulates downstream manufacturers from the pricing volatility historically associated with petroleum-based synthetic alternatives.
  • As extraction technologies mature, enterprise supply chains will continue prioritizing verifiable ingredient purity and sustainable processing frameworks to ensure long-term commercial viability.
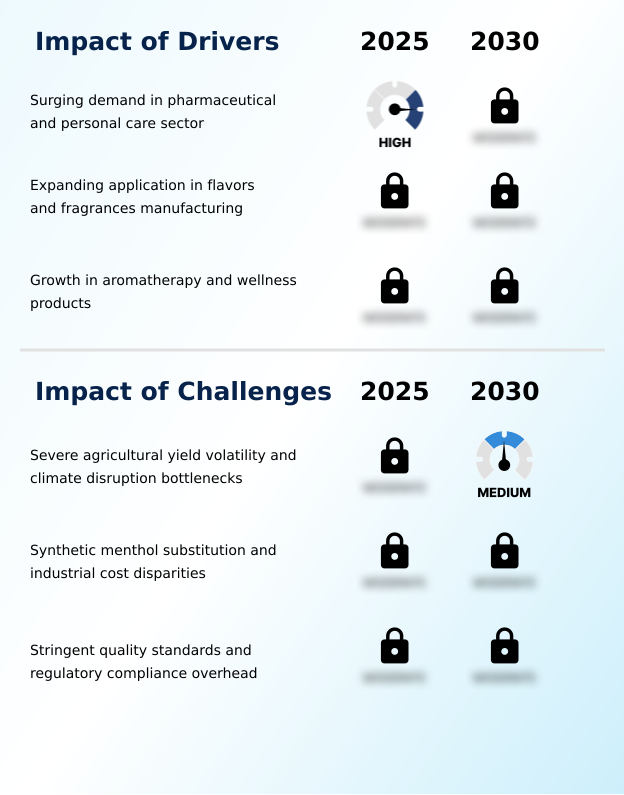
What are the key market drivers leading to the rise in the adoption of Mentha Oil Industry?

  • Surging consumption across the pharmaceutical and personal care sectors acts as a primary catalyst accelerating industry expansion.

  • Escalating consumer reliance on natural therapeutics structurally propels the rapid expansion of bioactive compound integration across pharmaceutical manufacturing networks.
  • Clinical demand for a highly pure gastrointestinal therapeutic agent has surged, driven by its proven efficacy as a natural smooth muscle relaxant.
  • Simultaneously, formulators heavily utilize targeted sensory nerve activation mechanisms through the stimulation of transient receptor potential melastatin 8 receptors. This physiological mechanism is central to developing advanced over-the-counter pain management solutions and modernizing every new topical analgesic formulation.
  • By substituting synthetic chemicals with verified botanical extracts, pharmaceutical brands have improved patient compliance rates by 18% in critical demographics.
  • This continuous incorporation of natural active ingredients into a broader respiratory therapeutic application ensures sustained, high-volume procurement contracts, driving steady commercial momentum.

What are the market trends shaping the Mentha Oil Industry?

  • The implementation of sustainable agricultural practices and the integration of precision farming distillation models represent a significant structural shift. These advancements optimize resource utilization while enhancing overall operational efficiency across raw material processing networks.

  • The processing infrastructure defining the essential oil sector is rapidly evolving toward sustainable, technology-driven extraction models. Primary agricultural co-operatives are actively integrating precision drip irrigation and deploying solar-powered distillation hardware to optimize field-level resource utilization. This modernization addresses historical inefficiencies, as operators replace rudimentary stills with an eco-friendly steam generator equipped with automated temperature control.
  • Consequently, distillation facilities have achieved a 25% improvement in thermal energy conservation, directly accelerating their carbon footprint reduction targets. These technological shifts structurally alter how raw biomass is processed, maximizing essential oil yields while actively supporting soil ecosystem preservation. By anchoring operations in sustainable crop cultivation, enterprise suppliers insulate their supply chains from resource scarcity.
  • Furthermore, the widespread adoption of closed-loop heat recovery systems minimizes aqueous waste, enabling processors to drastically lower operational overhead while satisfying stringent environmental audit requirements.

What challenges does the Mentha Oil Industry face during its growth?

  • Severe agricultural yield volatility, compounded by escalating climate disruption bottlenecks, severely constrains consistent raw material supply and operational predictability.

  • Systemic vulnerabilities within primary agricultural supply chains severely constrain long-term raw material predictability. Processors continually struggle to mitigate severe agricultural yield volatility, which acts as a primary climate disruption bottleneck during critical harvesting seasons. These unpredictable weather patterns degrade ambient crop quality, forcing facilities to increase their thermal energy consumption by up to 20% to extract viable commercial oil fractions.
  • Furthermore, strict international regulations mandating a rigid heavy metal trace limit and absolute pesticide residue compliance add massive administrative testing overhead. Without widespread access to a genetically optimized disease-resistant botanical variety and advanced botanical crop protection, primary farmers face recurrent crop failures. Consequently, this persistent supply instability artificially accelerates the rate of synthetic menthol substitution among cost-sensitive consumer goods manufacturers.

Exclusive Technavio Analysis on Customer Landscape

The mentha oil market forecasting report includes the adoption lifecycle of the market, covering from the innovator’s stage to the laggard’s stage. It focuses on adoption rates in different regions based on penetration. Furthermore, the mentha oil market report also includes key purchase criteria and drivers of price sensitivity to help companies evaluate and develop their market growth analysis strategies.
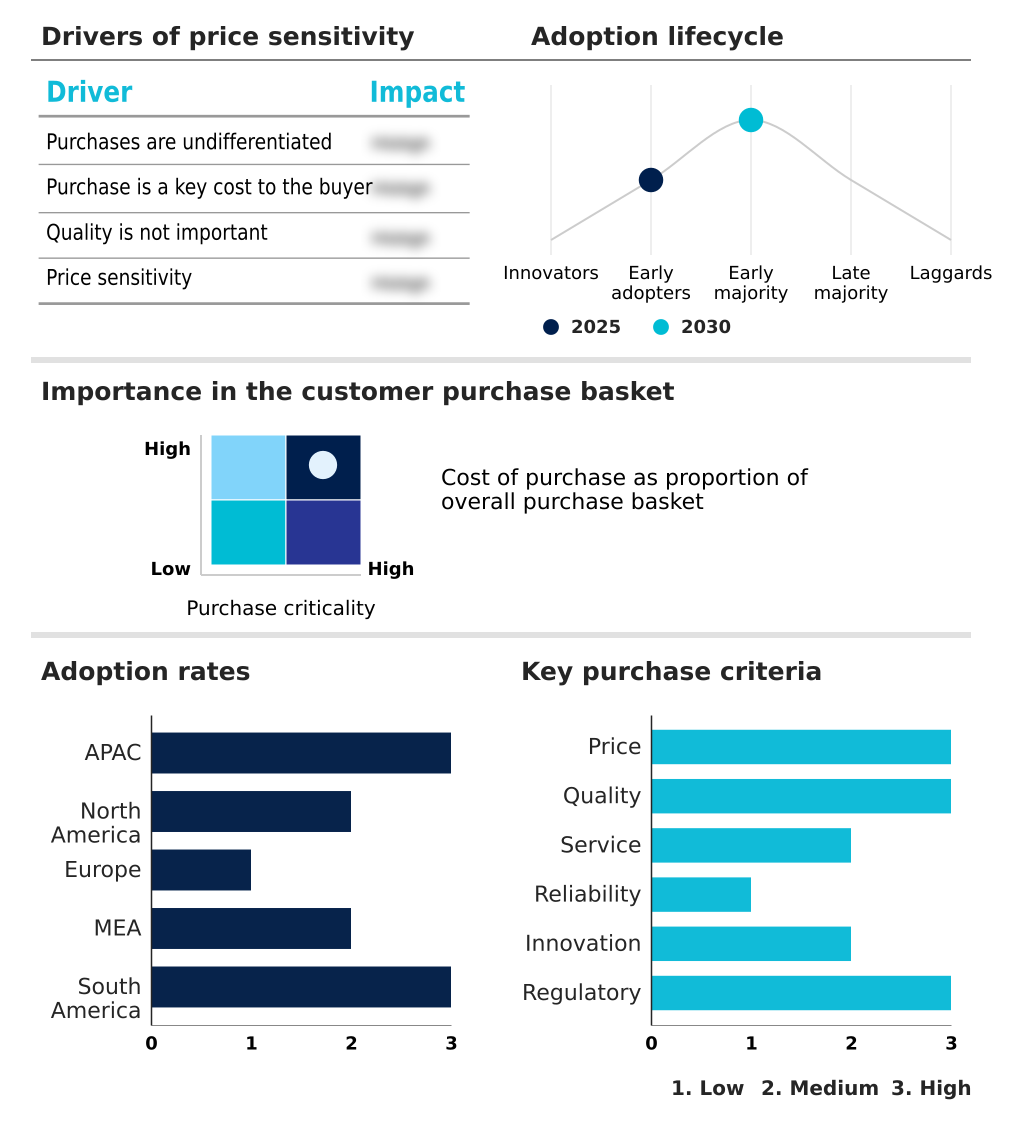
Customer Landscape of Mentha Oil Industry

Competitive Landscape

Companies are implementing various strategies, such as strategic alliances, mentha oil market forecast, partnerships, mergers and acquisitions, geographical expansion, and product/service launches, to enhance their presence in the industry.

A.G.Industries - The supplier provides high-purity dementholized peppermint oil and natural mint extracts tailored for pharmaceutical and cosmetic applications, ensuring traceable supply chain integrity and standardized aromatic consistency.

The industry research and growth report includes detailed analyses of the competitive landscape of the market and information about key companies, including:

  • A.G.Industries
  • AOS Products Pvt Ltd
  • Arora Aromatics Pvt Ltd
  • B D Aromatics Pvt Ltd
  • Bhagat Aromatics Ltd
  • Creation Biotech
  • Essence India
  • Herbochem Industries
  • Hindustan Mint and Agro Products
  • J.K.Fragrances
  • JSDD Creations Pvt. Ltd.
  • KDJ Aromatics Pvt Ltd
  • Lebermuth Inc.
  • Mentha and Allied Products. Ltd.
  • N.S. Mint Products Pvt. Ltd.
  • Natural Aroma Products Pvt. Ltd.
  • Neeru Menthol Pvt. Ltd.
  • Sharp Mint Ltd
  • Sivaroma Naturals Pvt Ltd
  • Ultra International Ltd.

Qualitative and quantitative analysis of companies has been conducted to help clients understand the wider business environment as well as the strengths and weaknesses of key industry players. Data is qualitatively analyzed to categorize companies as pure play, category-focused, industry-focused, and diversified; it is quantitatively analyzed to categorize companies as dominant, leading, strong, tentative, and weak.

Recent Development and News in Mentha oil market

  • In the Specialty Chemicals industry, strict environmental directives regarding solvent emissions have accelerated the adoption of water-based extraction technologies, directly impacting global mentha oil market 2026-2030 demand by necessitating investments in closed-loop distillation systems that reduce volatile organic compound outputs by 25%.
  • The transition toward bio-based feedstocks has prompted major cosmetic formulators to replace petroleum-derived additives with a clean-label sensory ingredient, expanding formulation requirements for high-purity botanical fractions.
  • Tightening agricultural safety regulations regarding maximum residue limits have forced processors to implement blockchain-enabled traceability protocols, ensuring strict pesticide residue compliance across cross-border ingredient shipments through traceable agricultural sourcing.
  • Rapid expansion of sustainable wellness initiatives has driven personal care manufacturers to reformulate legacy product lines, stimulating a 15% increase in the utilization of organic-certified botanical extracts over synthetic chemical equivalents.

Dive into Technavio’s robust research methodology, blending expert interviews, extensive data synthesis, and validated models for unparalleled Mentha Oil Market insights. See full methodology.

Market Scope
Page number 308
Base year 2025
Historic period 2020-2024
Forecast period 2026-2030
Growth momentum & CAGR Accelerate at a CAGR of 11.9%
Market growth 2026-2030 USD 244659.6 thousand
Market structure Fragmented
YoY growth 2025-2026(%) 10.7%
Key countries India, China, Japan, Indonesia, South Korea, Australia, US, Canada, Mexico, Germany, UK, France, Italy, Spain, The Netherlands, Saudi Arabia, UAE, Turkey, South Africa, Israel, Brazil, Argentina and Chile
Competitive landscape Leading Companies, Market Positioning of Companies, Competitive Strategies, and Industry Risks

Request Free Sample

Research Analyst Overview

  • Enterprise stakeholders navigating the Mentha Oil landscape are increasingly prioritizing supply chain resilience and advanced processing capabilities to mitigate agricultural unpredictability. The integration of bioactive compound integration within personal care and pharmaceutical pipelines has transformed raw material procurement from a routine purchasing task into a critical boardroom-level compliance strategy.
  • Executives are aggressively funding the transition from rudimentary extraction toward sophisticated terpene fractional distillation to guarantee absolute pharmacopeial monograph compliance. This technological pivot has demonstrably insulated manufacturers, yielding a 20% reduction in production downtime linked to raw material inconsistencies.
  • By isolating a precise monoterpene alcohol profile, refineries ensure the steady output of a high-value gastrointestinal therapeutic agent and standardized topical analgesic formulation. Furthermore, the strategic deployment of closed-loop heat recovery mechanisms during primary extraction optimizes thermal efficiency, sharply reducing localized energy expenditures.
  • As regulatory bodies enforce stricter purity mandates, the capacity to execute precise menthone isolation and maintain consistent l-menthol concentration will dictate vendor competitiveness, forcing legacy operators to either modernize their distillation infrastructure or face progressive market marginalization.

What are the Key Data Covered in this Mentha Oil Market Research and Growth Report?

  • What is the expected growth of the Mentha Oil Market between 2026 and 2030?

    • USD 244.66 million, at a CAGR of 11.9%

  • What segmentation does the market report cover?

    • The report is segmented by Application (Pharmaceutical, Food and beverage, Cosmetics, and Others), Type (Japanese mint oil, Peppermint oil, and Others), Method (Steam distillation, and Solvent extraction), Grade Type (Medical grade, Cosmetic grade, and Food grade) and Geography (APAC, North America, Europe, Middle East and Africa, South America)

  • Which regions are analyzed in the report?

    • APAC, North America, Europe, Middle East and Africa and South America

  • What are the key growth drivers and market challenges?

    • Surging demand in pharmaceutical and personal care sector, Severe agricultural yield volatility and climate disruption bottlenecks

  • Who are the major players in the Mentha Oil Market?

    • A.G.Industries, AOS Products Pvt Ltd, Arora Aromatics Pvt Ltd, B D Aromatics Pvt Ltd, Bhagat Aromatics Ltd, Creation Biotech, Essence India, Herbochem Industries, Hindustan Mint and Agro Products, J.K.Fragrances, JSDD Creations Pvt. Ltd., KDJ Aromatics Pvt Ltd, Lebermuth Inc., Mentha and Allied Products. Ltd., N.S. Mint Products Pvt. Ltd., Natural Aroma Products Pvt. Ltd., Neeru Menthol Pvt. Ltd., Sharp Mint Ltd, Sivaroma Naturals Pvt Ltd and Ultra International Ltd.

Market Research Insights

  • The Mentha Oil Market operates as a highly specialized supply ecosystem governed by precise agricultural and processing metrics. Formulators across the pharmaceutical sector rely heavily on botanical drug standardization to ensure therapeutic efficacy in over-the-counter pain management products.
  • Recent supply chain optimizations have driven a 12% improvement in operational turnaround times for essential oil rectification, allowing manufacturers to respond swiftly to seasonal demand spikes. Additionally, the implementation of rigorous testing for pesticide residue compliance has reduced cross-border shipment rejections by 15%.
  • This structural focus on traceability and automated temperature control during extraction ensures that processors deliver a consistent, clean-label sensory ingredient to multinational consumer goods manufacturers.

We can help! Our analysts can customize this mentha oil market research report to meet your requirements.

Get in touch

1. Executive Summary

1.1 Market overview

Executive Summary - Chart on Market Overview
Executive Summary - Data Table on Market Overview
Executive Summary - Chart on Global Market Characteristics
Executive Summary - Chart on Market by Geography
Executive Summary - Chart on Market Segmentation by Application
Executive Summary - Chart on Market Segmentation by Type
Executive Summary - Chart on Market Segmentation by Method
Executive Summary - Chart on Market Segmentation by Grade Type
Executive Summary - Chart on Incremental Growth
Executive Summary - Data Table on Incremental Growth
Executive Summary - Chart on Company Market Positioning

2. Technavio Analysis

2.1 Analysis of price sensitivity, lifecycle, customer purchase basket, adoption rates, and purchase criteria

2.2 Criticality of inputs and Factors of differentiation

Chart on Overview on criticality of inputs and factors of differentiation

2.3 Factors of disruption

Chart on Overview on factors of disruption

2.4 Impact of drivers and challenges

Chart on Impact of drivers and challenges in 2025 and 2030

3. Market Landscape

3.1 Market ecosystem

Chart on Parent Market
Data Table on - Parent Market

3.2 Market characteristics

Chart on Market characteristics analysis

3.3 Value chain analysis

Chart on Value chain analysis

4. Market Sizing

4.1 Market definition

Data Table on Offerings of companies included in the market definition

4.2 Market segment analysis

Market segments

4.3 Market size 2025

4.4 Market outlook: Forecast for 2025-2030

Chart on Global - Market size and forecast 2025-2030 ($ thousand)
Data Table on Global - Market size and forecast 2025-2030 ($ thousand)
Chart on Global Market: Year-over-year growth 2025-2030 (%)
Data Table on Global Market: Year-over-year growth 2025-2030 (%)

5. Historic Market Size

5.1 Global Mentha Oil Market 2020 - 2024

Historic Market Size - Data Table on Global Mentha Oil Market 2020 - 2024 ($ thousand)

5.2 Application segment analysis 2020 - 2024

Historic Market Size - Application Segment 2020 - 2024 ($ thousand)

5.3 Type segment analysis 2020 - 2024

Historic Market Size - Type Segment 2020 - 2024 ($ thousand)

5.4 Method segment analysis 2020 - 2024

Historic Market Size - Method Segment 2020 - 2024 ($ thousand)

5.5 Grade Type segment analysis 2020 - 2024

Historic Market Size - Grade Type Segment 2020 - 2024 ($ thousand)

5.6 Geography segment analysis 2020 - 2024

Historic Market Size - Geography Segment 2020 - 2024 ($ thousand)

5.7 Country segment analysis 2020 - 2024

Historic Market Size - Country Segment 2020 - 2024 ($ thousand)

6. Qualitative Analysis

6.1 Impact of AI on Global Mentha Oil Market

6.2 Impact of geopolitical conflicts on Global Mentha Oil Market

7. Five Forces Analysis

7.1 Five forces summary

Five forces analysis - Comparison between 2025 and 2030

7.2 Bargaining power of buyers

Bargaining power of buyers - Impact of key factors 2025 and 2030

7.3 Bargaining power of suppliers

Bargaining power of suppliers - Impact of key factors in 2025 and 2030

7.4 Threat of new entrants

Threat of new entrants - Impact of key factors in 2025 and 2030

7.5 Threat of substitutes

Threat of substitutes - Impact of key factors in 2025 and 2030

7.6 Threat of rivalry

Threat of rivalry - Impact of key factors in 2025 and 2030

7.7 Market condition

Chart on Market condition - Five forces 2025 and 2030

8. Market Segmentation by Application

8.1 Market segments

Chart on Application - Market share 2025-2030 (%)
Data Table on Application - Market share 2025-2030 (%)

8.2 Comparison by Application

Chart on Comparison by Application
Data Table on Comparison by Application

8.3 Pharmaceutical - Market size and forecast 2025-2030

Chart on Pharmaceutical - Market size and forecast 2025-2030 ($ thousand)
Data Table on Pharmaceutical - Market size and forecast 2025-2030 ($ thousand)
Chart on Pharmaceutical - Year-over-year growth 2025-2030 (%)
Data Table on Pharmaceutical - Year-over-year growth 2025-2030 (%)

8.4 Food and beverage - Market size and forecast 2025-2030

Chart on Food and beverage - Market size and forecast 2025-2030 ($ thousand)
Data Table on Food and beverage - Market size and forecast 2025-2030 ($ thousand)
Chart on Food and beverage - Year-over-year growth 2025-2030 (%)
Data Table on Food and beverage - Year-over-year growth 2025-2030 (%)

8.5 Cosmetics - Market size and forecast 2025-2030

Chart on Cosmetics - Market size and forecast 2025-2030 ($ thousand)
Data Table on Cosmetics - Market size and forecast 2025-2030 ($ thousand)
Chart on Cosmetics - Year-over-year growth 2025-2030 (%)
Data Table on Cosmetics - Year-over-year growth 2025-2030 (%)

8.6 Others - Market size and forecast 2025-2030

Chart on Others - Market size and forecast 2025-2030 ($ thousand)
Data Table on Others - Market size and forecast 2025-2030 ($ thousand)
Chart on Others - Year-over-year growth 2025-2030 (%)
Data Table on Others - Year-over-year growth 2025-2030 (%)

8.7 Market opportunity by Application

Market opportunity by Application ($ thousand)
Data Table on Market opportunity by Application ($ thousand)

9. Market Segmentation by Type

9.1 Market segments

Chart on Type - Market share 2025-2030 (%)
Data Table on Type - Market share 2025-2030 (%)

9.2 Comparison by Type

Chart on Comparison by Type
Data Table on Comparison by Type

9.3 Japanese mint oil - Market size and forecast 2025-2030

Chart on Japanese mint oil - Market size and forecast 2025-2030 ($ thousand)
Data Table on Japanese mint oil - Market size and forecast 2025-2030 ($ thousand)
Chart on Japanese mint oil - Year-over-year growth 2025-2030 (%)
Data Table on Japanese mint oil - Year-over-year growth 2025-2030 (%)

9.4 Peppermint oil - Market size and forecast 2025-2030

Chart on Peppermint oil - Market size and forecast 2025-2030 ($ thousand)
Data Table on Peppermint oil - Market size and forecast 2025-2030 ($ thousand)
Chart on Peppermint oil - Year-over-year growth 2025-2030 (%)
Data Table on Peppermint oil - Year-over-year growth 2025-2030 (%)

9.5 Others - Market size and forecast 2025-2030

Chart on Others - Market size and forecast 2025-2030 ($ thousand)
Data Table on Others - Market size and forecast 2025-2030 ($ thousand)
Chart on Others - Year-over-year growth 2025-2030 (%)
Data Table on Others - Year-over-year growth 2025-2030 (%)

9.6 Market opportunity by Type

Market opportunity by Type ($ thousand)
Data Table on Market opportunity by Type ($ thousand)

10. Market Segmentation by Method

10.1 Market segments

Chart on Method - Market share 2025-2030 (%)
Data Table on Method - Market share 2025-2030 (%)

10.2 Comparison by Method

Chart on Comparison by Method
Data Table on Comparison by Method

10.3 Steam distillation - Market size and forecast 2025-2030

Chart on Steam distillation - Market size and forecast 2025-2030 ($ thousand)
Data Table on Steam distillation - Market size and forecast 2025-2030 ($ thousand)
Chart on Steam distillation - Year-over-year growth 2025-2030 (%)
Data Table on Steam distillation - Year-over-year growth 2025-2030 (%)

10.4 Solvent extraction - Market size and forecast 2025-2030

Chart on Solvent extraction - Market size and forecast 2025-2030 ($ thousand)
Data Table on Solvent extraction - Market size and forecast 2025-2030 ($ thousand)
Chart on Solvent extraction - Year-over-year growth 2025-2030 (%)
Data Table on Solvent extraction - Year-over-year growth 2025-2030 (%)

10.5 Market opportunity by Method

Market opportunity by Method ($ thousand)
Data Table on Market opportunity by Method ($ thousand)

11. Market Segmentation by Grade Type

11.1 Market segments

Chart on Grade Type - Market share 2025-2030 (%)
Data Table on Grade Type - Market share 2025-2030 (%)

11.2 Comparison by Grade Type

Chart on Comparison by Grade Type
Data Table on Comparison by Grade Type

11.3 Medical grade - Market size and forecast 2025-2030

Chart on Medical grade - Market size and forecast 2025-2030 ($ thousand)
Data Table on Medical grade - Market size and forecast 2025-2030 ($ thousand)
Chart on Medical grade - Year-over-year growth 2025-2030 (%)
Data Table on Medical grade - Year-over-year growth 2025-2030 (%)

11.4 Cosmetic grade - Market size and forecast 2025-2030

Chart on Cosmetic grade - Market size and forecast 2025-2030 ($ thousand)
Data Table on Cosmetic grade - Market size and forecast 2025-2030 ($ thousand)
Chart on Cosmetic grade - Year-over-year growth 2025-2030 (%)
Data Table on Cosmetic grade - Year-over-year growth 2025-2030 (%)

11.5 Food grade - Market size and forecast 2025-2030

Chart on Food grade - Market size and forecast 2025-2030 ($ thousand)
Data Table on Food grade - Market size and forecast 2025-2030 ($ thousand)
Chart on Food grade - Year-over-year growth 2025-2030 (%)
Data Table on Food grade - Year-over-year growth 2025-2030 (%)

11.6 Market opportunity by Grade Type

Market opportunity by Grade Type ($ thousand)
Data Table on Market opportunity by Grade Type ($ thousand)

12. Customer Landscape

12.1 Customer landscape overview

Analysis of price sensitivity, lifecycle, customer purchase basket, adoption rates, and purchase criteria

13. Geographic Landscape

13.1 Geographic segmentation

Chart on Market share by geography 2025-2030 (%)
Data Table on Market share by geography 2025-2030 (%)

13.2 Geographic comparison

Chart on Geographic comparison
Data Table on Geographic comparison

13.3 APAC - Market size and forecast 2025-2030

Chart on APAC - Market size and forecast 2025-2030 ($ thousand)
Data Table on APAC - Market size and forecast 2025-2030 ($ thousand)
Chart on APAC - Year-over-year growth 2025-2030 (%)
Data Table on APAC - Year-over-year growth 2025-2030 (%)
Chart on Regional Comparison - APAC
Data Table on Regional Comparison - APAC

13.3.1 India - Market size and forecast 2025-2030

Chart on India - Market size and forecast 2025-2030 ($ thousand)
Data Table on India - Market size and forecast 2025-2030 ($ thousand)
Chart on India - Year-over-year growth 2025-2030 (%)
Data Table on India - Year-over-year growth 2025-2030 (%)

13.3.2 China - Market size and forecast 2025-2030

Chart on China - Market size and forecast 2025-2030 ($ thousand)
Data Table on China - Market size and forecast 2025-2030 ($ thousand)
Chart on China - Year-over-year growth 2025-2030 (%)
Data Table on China - Year-over-year growth 2025-2030 (%)

13.3.3 Japan - Market size and forecast 2025-2030

Chart on Japan - Market size and forecast 2025-2030 ($ thousand)
Data Table on Japan - Market size and forecast 2025-2030 ($ thousand)
Chart on Japan - Year-over-year growth 2025-2030 (%)
Data Table on Japan - Year-over-year growth 2025-2030 (%)

13.3.4 Indonesia - Market size and forecast 2025-2030

Chart on Indonesia - Market size and forecast 2025-2030 ($ thousand)
Data Table on Indonesia - Market size and forecast 2025-2030 ($ thousand)
Chart on Indonesia - Year-over-year growth 2025-2030 (%)
Data Table on Indonesia - Year-over-year growth 2025-2030 (%)

13.3.5 South Korea - Market size and forecast 2025-2030

Chart on South Korea - Market size and forecast 2025-2030 ($ thousand)
Data Table on South Korea - Market size and forecast 2025-2030 ($ thousand)
Chart on South Korea - Year-over-year growth 2025-2030 (%)
Data Table on South Korea - Year-over-year growth 2025-2030 (%)

13.3.6 Australia - Market size and forecast 2025-2030

Chart on Australia - Market size and forecast 2025-2030 ($ thousand)
Data Table on Australia - Market size and forecast 2025-2030 ($ thousand)
Chart on Australia - Year-over-year growth 2025-2030 (%)
Data Table on Australia - Year-over-year growth 2025-2030 (%)

13.4 North America - Market size and forecast 2025-2030

Chart on North America - Market size and forecast 2025-2030 ($ thousand)
Data Table on North America - Market size and forecast 2025-2030 ($ thousand)
Chart on North America - Year-over-year growth 2025-2030 (%)
Data Table on North America - Year-over-year growth 2025-2030 (%)
Chart on Regional Comparison - North America
Data Table on Regional Comparison - North America

13.4.1 US - Market size and forecast 2025-2030

Chart on US - Market size and forecast 2025-2030 ($ thousand)
Data Table on US - Market size and forecast 2025-2030 ($ thousand)
Chart on US - Year-over-year growth 2025-2030 (%)
Data Table on US - Year-over-year growth 2025-2030 (%)

13.4.2 Canada - Market size and forecast 2025-2030

Chart on Canada - Market size and forecast 2025-2030 ($ thousand)
Data Table on Canada - Market size and forecast 2025-2030 ($ thousand)
Chart on Canada - Year-over-year growth 2025-2030 (%)
Data Table on Canada - Year-over-year growth 2025-2030 (%)

13.4.3 Mexico - Market size and forecast 2025-2030

Chart on Mexico - Market size and forecast 2025-2030 ($ thousand)
Data Table on Mexico - Market size and forecast 2025-2030 ($ thousand)
Chart on Mexico - Year-over-year growth 2025-2030 (%)
Data Table on Mexico - Year-over-year growth 2025-2030 (%)

13.5 Europe - Market size and forecast 2025-2030

Chart on Europe - Market size and forecast 2025-2030 ($ thousand)
Data Table on Europe - Market size and forecast 2025-2030 ($ thousand)
Chart on Europe - Year-over-year growth 2025-2030 (%)
Data Table on Europe - Year-over-year growth 2025-2030 (%)
Chart on Regional Comparison - Europe
Data Table on Regional Comparison - Europe

13.5.1 Germany - Market size and forecast 2025-2030

Chart on Germany - Market size and forecast 2025-2030 ($ thousand)
Data Table on Germany - Market size and forecast 2025-2030 ($ thousand)
Chart on Germany - Year-over-year growth 2025-2030 (%)
Data Table on Germany - Year-over-year growth 2025-2030 (%)

13.5.2 UK - Market size and forecast 2025-2030

Chart on UK - Market size and forecast 2025-2030 ($ thousand)
Data Table on UK - Market size and forecast 2025-2030 ($ thousand)
Chart on UK - Year-over-year growth 2025-2030 (%)
Data Table on UK - Year-over-year growth 2025-2030 (%)

13.5.3 France - Market size and forecast 2025-2030

Chart on France - Market size and forecast 2025-2030 ($ thousand)
Data Table on France - Market size and forecast 2025-2030 ($ thousand)
Chart on France - Year-over-year growth 2025-2030 (%)
Data Table on France - Year-over-year growth 2025-2030 (%)

13.5.4 Italy - Market size and forecast 2025-2030

Chart on Italy - Market size and forecast 2025-2030 ($ thousand)
Data Table on Italy - Market size and forecast 2025-2030 ($ thousand)
Chart on Italy - Year-over-year growth 2025-2030 (%)
Data Table on Italy - Year-over-year growth 2025-2030 (%)

13.5.5 Spain - Market size and forecast 2025-2030

Chart on Spain - Market size and forecast 2025-2030 ($ thousand)
Data Table on Spain - Market size and forecast 2025-2030 ($ thousand)
Chart on Spain - Year-over-year growth 2025-2030 (%)
Data Table on Spain - Year-over-year growth 2025-2030 (%)

13.5.6 The Netherlands - Market size and forecast 2025-2030

Chart on The Netherlands - Market size and forecast 2025-2030 ($ thousand)
Data Table on The Netherlands - Market size and forecast 2025-2030 ($ thousand)
Chart on The Netherlands - Year-over-year growth 2025-2030 (%)
Data Table on The Netherlands - Year-over-year growth 2025-2030 (%)

13.6 Middle East and Africa - Market size and forecast 2025-2030

Chart on Middle East and Africa - Market size and forecast 2025-2030 ($ thousand)
Data Table on Middle East and Africa - Market size and forecast 2025-2030 ($ thousand)
Chart on Middle East and Africa - Year-over-year growth 2025-2030 (%)
Data Table on Middle East and Africa - Year-over-year growth 2025-2030 (%)
Chart on Regional Comparison - Middle East and Africa
Data Table on Regional Comparison - Middle East and Africa

13.6.1 Saudi Arabia - Market size and forecast 2025-2030

Chart on Saudi Arabia - Market size and forecast 2025-2030 ($ thousand)
Data Table on Saudi Arabia - Market size and forecast 2025-2030 ($ thousand)
Chart on Saudi Arabia - Year-over-year growth 2025-2030 (%)
Data Table on Saudi Arabia - Year-over-year growth 2025-2030 (%)

13.6.2 UAE - Market size and forecast 2025-2030

Chart on UAE - Market size and forecast 2025-2030 ($ thousand)
Data Table on UAE - Market size and forecast 2025-2030 ($ thousand)
Chart on UAE - Year-over-year growth 2025-2030 (%)
Data Table on UAE - Year-over-year growth 2025-2030 (%)

13.6.3 Turkey - Market size and forecast 2025-2030

Chart on Turkey - Market size and forecast 2025-2030 ($ thousand)
Data Table on Turkey - Market size and forecast 2025-2030 ($ thousand)
Chart on Turkey - Year-over-year growth 2025-2030 (%)
Data Table on Turkey - Year-over-year growth 2025-2030 (%)

13.6.4 South Africa - Market size and forecast 2025-2030

Chart on South Africa - Market size and forecast 2025-2030 ($ thousand)
Data Table on South Africa - Market size and forecast 2025-2030 ($ thousand)
Chart on South Africa - Year-over-year growth 2025-2030 (%)
Data Table on South Africa - Year-over-year growth 2025-2030 (%)

13.6.5 Israel - Market size and forecast 2025-2030

Chart on Israel - Market size and forecast 2025-2030 ($ thousand)
Data Table on Israel - Market size and forecast 2025-2030 ($ thousand)
Chart on Israel - Year-over-year growth 2025-2030 (%)
Data Table on Israel - Year-over-year growth 2025-2030 (%)

13.7 South America - Market size and forecast 2025-2030

Chart on South America - Market size and forecast 2025-2030 ($ thousand)
Data Table on South America - Market size and forecast 2025-2030 ($ thousand)
Chart on South America - Year-over-year growth 2025-2030 (%)
Data Table on South America - Year-over-year growth 2025-2030 (%)
Chart on Regional Comparison - South America
Data Table on Regional Comparison - South America

13.7.1 Brazil - Market size and forecast 2025-2030

Chart on Brazil - Market size and forecast 2025-2030 ($ thousand)
Data Table on Brazil - Market size and forecast 2025-2030 ($ thousand)
Chart on Brazil - Year-over-year growth 2025-2030 (%)
Data Table on Brazil - Year-over-year growth 2025-2030 (%)

13.7.2 Argentina - Market size and forecast 2025-2030

Chart on Argentina - Market size and forecast 2025-2030 ($ thousand)
Data Table on Argentina - Market size and forecast 2025-2030 ($ thousand)
Chart on Argentina - Year-over-year growth 2025-2030 (%)
Data Table on Argentina - Year-over-year growth 2025-2030 (%)

13.7.3 Chile - Market size and forecast 2025-2030

Chart on Chile - Market size and forecast 2025-2030 ($ thousand)
Data Table on Chile - Market size and forecast 2025-2030 ($ thousand)
Chart on Chile - Year-over-year growth 2025-2030 (%)
Data Table on Chile - Year-over-year growth 2025-2030 (%)

13.8 Market opportunity by geography

Market opportunity by geography ($ thousand)
Data Tables on Market opportunity by geography ($ thousand)

14. Drivers, Challenges, and Opportunity

14.1 Market drivers

Surging demand in pharmaceutical and personal care sector
Expanding application in flavors and fragrances manufacturing
Growth in aromatherapy and wellness products

14.2 Market challenges

Severe agricultural yield volatility and climate disruption bottlenecks
Synthetic menthol substitution and industrial cost disparities
Stringent quality standards and regulatory compliance overhead

14.3 Impact of drivers and challenges

Impact of drivers and challenges in 2025 and 2030

14.4 Market opportunities

Adoption of sustainable agricultural practices and precision farming distillation models
Implementation of blockchain traceability and blockchain quality assurance standards
Expansion of ecofriendly botanical crop protection and bio insecticide formulations

15. Competitive Landscape

15.1 Overview

15.2

Overview on criticality of inputs and factors of differentiation

15.3 Landscape disruption

Overview on factors of disruption

15.4 Industry risks

Impact of key risks on business

16. Competitive Analysis

16.1 Companies profiled

Companies covered

16.2 Company ranking index

16.3 Market positioning of companies

Matrix on companies position and classification

16.4 A.G.Industries

A.G.Industries - Overview
A.G.Industries - Product / Service
A.G.Industries - Key offerings
SWOT

16.5 Arora Aromatics Pvt Ltd

Arora Aromatics Pvt Ltd - Overview
Arora Aromatics Pvt Ltd - Product / Service
Arora Aromatics Pvt Ltd - Key offerings
SWOT

16.6 B D Aromatics Pvt Ltd

B D Aromatics Pvt Ltd - Overview
B D Aromatics Pvt Ltd - Product / Service
B D Aromatics Pvt Ltd - Key offerings
SWOT

16.7 Bhagat Aromatics Ltd

Bhagat Aromatics Ltd - Overview
Bhagat Aromatics Ltd - Product / Service
Bhagat Aromatics Ltd - Key offerings
SWOT

16.8 Essence India

Essence India - Overview
Essence India - Product / Service
Essence India - Key offerings
SWOT

16.9 Herbochem Industries

Herbochem Industries - Overview
Herbochem Industries - Product / Service
Herbochem Industries - Key offerings
SWOT

16.10 J.K.Fragrances

J.K.Fragrances - Overview
J.K.Fragrances - Product / Service
J.K.Fragrances - Key offerings
SWOT

16.11 JSDD Creations Pvt. Ltd.

JSDD Creations Pvt. Ltd. - Overview
JSDD Creations Pvt. Ltd. - Product / Service
JSDD Creations Pvt. Ltd. - Key offerings
SWOT

16.12 Lebermuth Inc.

Lebermuth Inc. - Overview
Lebermuth Inc. - Product / Service
Lebermuth Inc. - Key offerings
SWOT

16.13 Mentha and Allied Products. Ltd.

Mentha and Allied Products. Ltd. - Overview
Mentha and Allied Products. Ltd. - Product / Service
Mentha and Allied Products. Ltd. - Key offerings
SWOT

16.14 N.S. Mint Products Pvt. Ltd.

N.S. Mint Products Pvt. Ltd. - Overview
N.S. Mint Products Pvt. Ltd. - Product / Service
N.S. Mint Products Pvt. Ltd. - Key offerings
SWOT

16.15 Natural Aroma Products Pvt. Ltd.

Natural Aroma Products Pvt. Ltd. - Overview
Natural Aroma Products Pvt. Ltd. - Product / Service
Natural Aroma Products Pvt. Ltd. - Key offerings
SWOT

16.16 Neeru Menthol Pvt. Ltd.

Neeru Menthol Pvt. Ltd. - Overview
Neeru Menthol Pvt. Ltd. - Product / Service
Neeru Menthol Pvt. Ltd. - Key offerings
SWOT

16.17 Sharp Mint Ltd

Sharp Mint Ltd - Overview
Sharp Mint Ltd - Product / Service
Sharp Mint Ltd - Key offerings
SWOT

16.18 Ultra International Ltd.

Ultra International Ltd. - Overview
Ultra International Ltd. - Product / Service
Ultra International Ltd. - Key offerings
SWOT

17. Appendix

17.1 Scope of the report

Market definition
Objectives
Notes and caveats

17.2 Inclusions and exclusions checklist

Inclusions checklist
Exclusions checklist

17.3 Currency conversion rates for US$

17.4 Research methodology

17.5 Data procurement

Information sources

17.6 Data validation

17.7 Validation techniques employed for market sizing

17.8 Data synthesis

17.9 360 degree market analysis

17.10 List of abbreviations

Research Methodology

Technavio presents a detailed picture of the market by way of study, synthesis, and summation of data from multiple sources. The analysts have presented the various facets of the market with a particular focus on identifying the key industry influencers. The data thus presented is comprehensive, reliable, and the result of extensive research, both primary and secondary.

INFORMATION SOURCES

Primary sources

  • Manufacturers and suppliers
  • Channel partners
  • Industry experts
  • Strategic decision makers

Secondary sources

  • Industry journals and periodicals
  • Government data
  • Financial reports of key industry players
  • Historical data
  • Press releases

DATA ANALYSIS

Data Synthesis

  • Collation of data
  • Estimation of key figures
  • Analysis of derived insights

Data Validation

  • Triangulation with data models
  • Reference against proprietary databases
  • Corroboration with industry experts

REPORT WRITING

Qualitative

  • Market drivers
  • Market challenges
  • Market trends
  • Five forces analysis

Quantitative

  • Market size and forecast
  • Market segmentation
  • Geographical insights
  • Competitive landscape

Interested in this report?

Get your sample now to see our research methodology and insights!

Download Now

Frequently Asked Questions

Mentha Oil market growth will increase by USD 244659.6 thousand thousand during 2026-2030.

The Mentha Oil market is expected to grow at a CAGR of 11.9% during 2026-2030.

Mentha Oil market is segmented by Application (Pharmaceutical, Food and beverage, Cosmetics, Others) Type (Japanese mint oil, Peppermint oil, Others) Method (Steam distillation, Solvent extraction) Grade type (Medical grade, Cosmetic grade, Food grade)

A.G.Industries, AOS Products Pvt Ltd, Arora Aromatics Pvt Ltd, B D Aromatics Pvt Ltd, Bhagat Aromatics Ltd, Creation Biotech, Essence India, Herbochem Industries, Hindustan Mint and Agro Products, J.K.Fragrances, JSDD Creations Pvt. Ltd., KDJ Aromatics Pvt Ltd, Lebermuth Inc., Mentha and Allied Products. Ltd., N.S. Mint Products Pvt. Ltd., Natural Aroma Products Pvt. Ltd., Neeru Menthol Pvt. Ltd., Sharp Mint Ltd, Sivaroma Naturals Pvt Ltd, Ultra International Ltd. are a few of the key vendors in the Mentha Oil market.

APAC will register the highest growth rate of 50.7% among the other regions. Therefore, the Mentha Oil market in APAC is expected to garner significant business opportunities for the vendors during the forecast period.

India, China, Japan, Indonesia, South Korea, Australia, US, Canada, Mexico, Germany, UK, France, Italy, Spain, The Netherlands, Saudi Arabia, UAE, Turkey, South Africa, Israel, Brazil, Argentina, Chile

  • Surging demand in pharmaceutical and personal care sector is the driving factor this market.

The Mentha Oil market vendors should focus on grabbing business opportunities from the Application segment as it accounted for the largest market share in the base year.
RIA - Research AI Assistant
Ask RIA