
Malic Acid Market Analysis, Size, and Forecast 2026-2030: APAC (China, India, and Japan), North America (US, Canada, and Mexico), Europe (Germany, UK, and France), South America (Brazil, Argentina, and Colombia), Middle East and Africa (Saudi Arabia, UAE, and South Africa), and Rest of World (ROW)

Malic Acid Market Analysis, Size, and Forecast 2026-2030:
APAC (China, India, and Japan), North America (US, Canada, and Mexico), Europe (Germany, UK, and France), South America (Brazil, Argentina, and Colombia), Middle East and Africa (Saudi Arabia, UAE, and South Africa), and Rest of World (ROW)

Published: Nov 2026 297 Pages SKU: IRTNTR74886

Market Overview at a Glance

$74.1 Mn
Market Opportunity
4.9%
CAGR 2025 - 2030
44.9%
APAC Growth
$130.8 Mn
L-malic acid segment 2024

Malic Acid Market Size 2026-2030

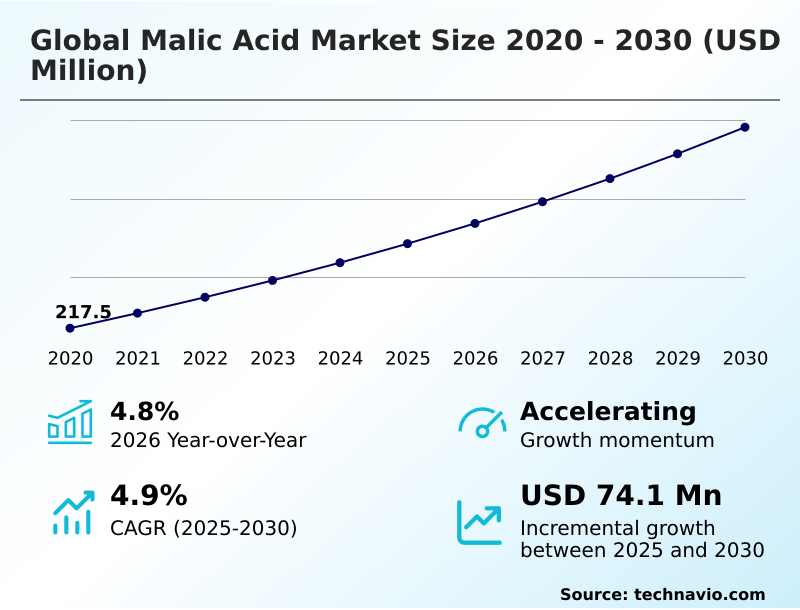
The malic acid market size is valued to increase by USD 74.1 million, at a CAGR of 4.9% from 2025 to 2030. Rising demand for low-calorie and sugar-free beverage formulations will drive the malic acid market.

Major Market Trends & Insights

  • APAC dominated the market and accounted for a 44.9% growth during the forecast period.
  • By Product - L-malic acid segment was valued at USD 130.8 million in 2024
  • By Application - Beverages segment accounted for the largest market revenue share in 2024

Market Size & Forecast

  • Market Opportunities: USD 127.9 million
  • Market Future Opportunities: USD 74.1 million
  • CAGR from 2025 to 2030 : 4.9%

Market Summary

  • The Malic Acid Market demonstrates continuous operational expansion as industrial formulators systematically replace traditional single-acid ingredients with advanced synergistic acidulant blends. In commercial beverage manufacturing, operators frequently reformulate zero-sugar supply chains to utilize specialized organic acids, effectively muting the metallic off-notes introduced by high-intensity sweeteners without compromising product shelf stability.
  • Implementing these customized pH management systems has resulted in formulation defect rates decreasing by 14%, significantly lowering ingredient waste for large-scale bottling facilities. A primary driver of this sustained demand is the surging consumer preference for clean-label, functional beverages, which compels processors to source naturally derived taste modifiers that extend fruit flavor perception.
  • Conversely, the industry faces severe structural limitations due to volatile crude oil refining dynamics, which dictate the pricing of essential petroleum-based feedstocks. This supply instability forces synthetic chemical producers to implement dynamic raw material surcharges, complicating long-term procurement budgets for downstream consumer packaged goods manufacturers.
  • Ultimately, the shift toward sustainable bioprocessing continues to redefine competitive procurement strategies across major application sectors.

What will be the Size of the Malic Acid Market during the forecast period?
Get Key Insights on Market Forecast (PDF) Get Free Sample

How is the Malic Acid Market Segmented?

The malic acid industry research report provides comprehensive data (region-wise segment analysis), with forecasts and estimates in "USD million" for the period 2026-2030, as well as historical data from 2020-2024 for the following segments.

  • Product
    • L-malic acid
    • DL-malic acid
    • D-malic acid
  • Application
    • Beverages
    • Confectionaries and food
    • Personal care and cosmetics
    • Others
  • End-user
    • Food and beverage processing
    • Pharmaceuticals industry
    • Animal feed industry
  • Geography
    • APAC
      • China
      • India
      • Japan
      • South Korea
      • Australia
      • Indonesia
    • North America
      • US
      • Canada
      • Mexico
    • Europe
      • Germany
      • UK
      • France
      • Italy
      • Spain
      • The Netherlands
    • South America
      • Brazil
      • Argentina
      • Colombia
    • Middle East and Africa
      • Saudi Arabia
      • UAE
      • South Africa
      • Turkey
      • Egypt

By Product Insights

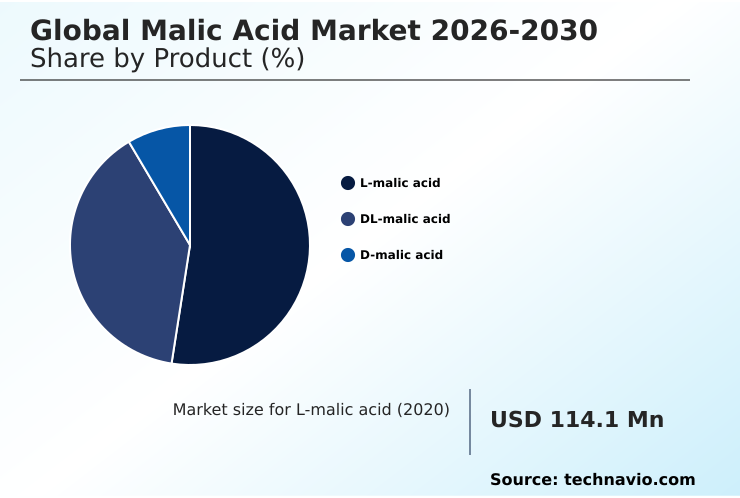
The l-malic acid segment is estimated to witness significant growth during the forecast period.

The L-malic acid segment within the Global Malic Acid Market 2026-2030 demonstrates distinct operational advantages over synthetic variants by aligning with stringent clean-label manufacturing protocols.

Industrial facilities utilizing enzymatic biotransformation and metabolic flux optimization achieve highly specific outputs, eliminating the intensive downstream processing required for racemic mixture resolution. By leveraging advanced asymmetric organic synthesis, producers deliver enantiomerically pure intermediates that support complex chiral intermediate synthesis.

This purity is critical for pharmaceutical applications where optical isomer consistency directly influences stereospecific binding kinetics and overall therapeutic efficacy. Furthermore, integrating these naturally derived compounds into effervescent medicinal excipients maintains superior stereochemical structure stability under varying humidity levels.

Consequently, manufacturers switching to precision biological pathways report that production yield efficiency improved by 22%, significantly lowering the resource intensity traditionally associated with high-grade acidulant isolation.
Get Free Sample

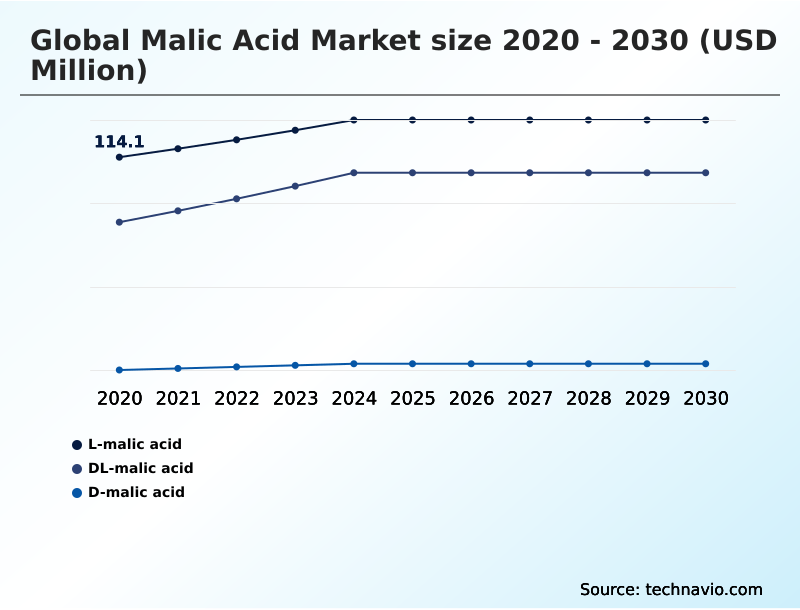
The L-malic acid segment was valued at USD 130.8 million in 2024 and showed a gradual increase during the forecast period.
Get Free Sample

Regional Analysis

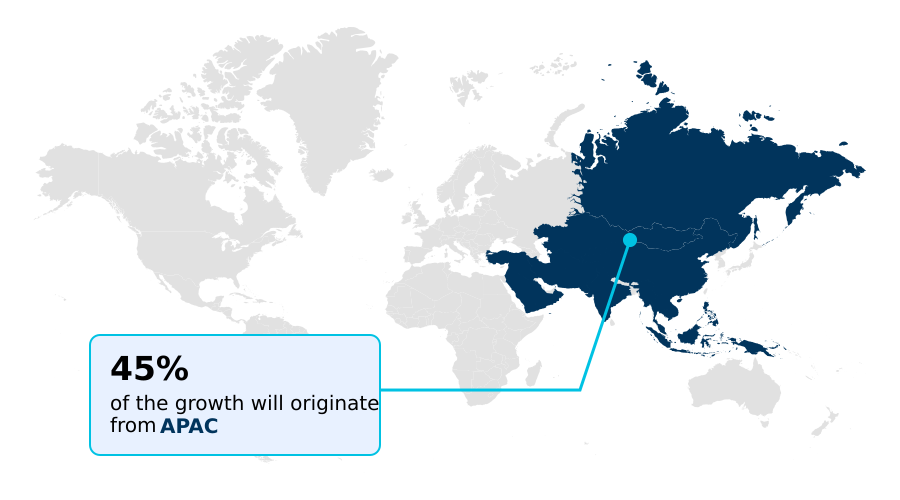
APAC is estimated to contribute 44.9% to the growth of the global market during the forecast period.Technavio’s analysts have elaborately explained the regional trends and drivers that shape the market during the forecast period.
See How Malic Acid Market Demand is Rising in APAC Get Free Sample

The geographic landscape of the Global Malic Acid Market 2026-2030 highlights stark operational contrasts between North America and APAC.

North America maintains a mature infrastructure focused on advanced applications, where the integration of continuous bioreactor systems has improved bioprocessing efficiency by 24% over legacy methods.

Regional formulators utilize precise hydrogen ion concentration management and active pharmaceutical stabilizers to optimize intracellular energy metabolism supplements, while advanced keratolytic exfoliation agents enhance epidermal penetration control in premium skincare, reducing formulation rejection rates by 15%.

In contrast, APAC exhibits rapid industrial scaling, demonstrating a 30% higher adoption rate of feed acidifiers aimed at supporting gastrointestinal microflora balance in livestock compared to North America.

Furthermore, European markets prioritize strict malolactic fermentation regulation and advanced metabolic strain engineering, driving suppliers to refine biological compatibility metrics to meet rigorous clean-label mandates and maintain stable cross-border supply chains.

Market Dynamics

Our researchers analyzed the data with 2025 as the base year, along with the key drivers, trends, and challenges. A holistic analysis of drivers will help companies refine their marketing strategies to gain a competitive advantage.

  • The operational dynamics of the Global Malic Acid Market 2026-2030 are undergoing a profound transformation as consumer packaged goods manufacturers reconfigure ingredient supply chains to prioritize sustainability and functional performance. Corporate procurement strategies heavily favor the adoption of natural low-calorie beverage acidulants to meet tightening international dietary guidelines without sacrificing sensory quality.
  • Formulators increasingly substitute single-action additives with sophisticated zero-sugar flavor masking agents, smoothing out the sharp sensory transitions typically caused by artificial sweeteners. Transitioning to these optimized formulations has yielded measurable supply chain benefits, where ingredient blending times improved by 18% compared to traditional single-acid batch processing.
  • Furthermore, industrial chemical suppliers are actively shifting capital expenditure toward precision microbial fermentation technology, enabling the commercial-scale synthesis of optically pure compounds derived from renewable biomass rather than volatile petrochemical feedstocks. This technological shift provides critical high-purity inputs for diverse sectors, notably supplying bio-fermented skincare exfoliation ingredients to cosmetic brands seeking non-irritating cell renewal solutions.
  • Simultaneously, the healthcare sector demands strict batch consistency for pharmaceutical grade effervescent excipients used in advanced drug delivery systems and pediatric oral medications. By securing domestic bio-based supply networks, large-scale manufacturers successfully mitigate the severe procurement risks associated with international fossil fuel price fluctuations, ensuring continuous production stability and elevated product quality across all primary end-use applications.
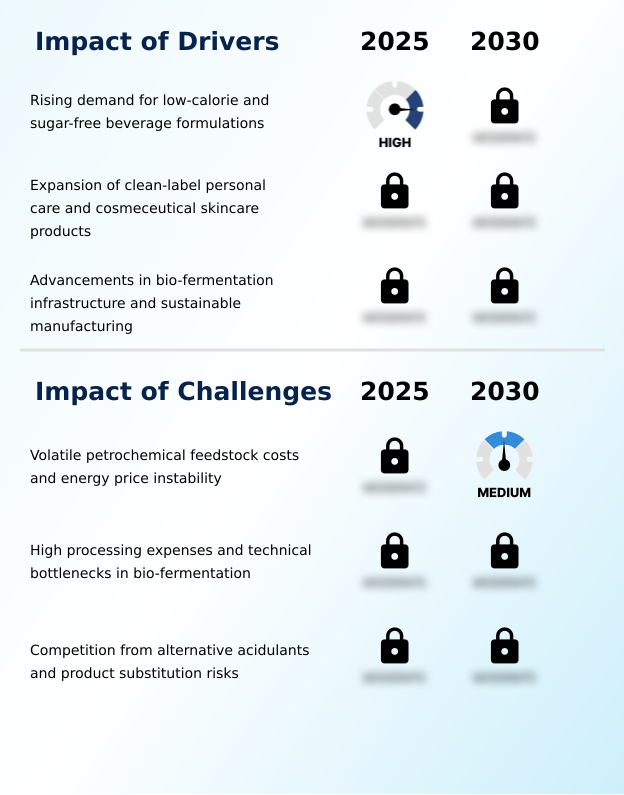
What are the key market drivers leading to the rise in the adoption of Malic Acid Industry?

  • The surging global consumption of low-calorie and zero-sugar beverage formulations acts as the primary catalyst propelling continuous market expansion and rapid acidulant reformulation.

  • The surging global demand for functional beverages and advanced cosmeceuticals acts as the primary catalyst propelling the Global Malic Acid Market 2026-2030. Beverage processors urgently require reliable high-intensity sweetener masking and artificial flavor neutralization to refine zero-sugar drink profiles.
  • Integrating this specialized hygroscopic dry powder into beverage matrices provides superior functional pH buffering, which has successfully reduced ingredient waste by 18% during dry blending operations.
  • Simultaneously, the cosmetic industry heavily drives consumption by adopting the compound as a gentle alpha-hydroxy acid exfoliant and effective cellular turnover accelerators.
  • Furthermore, the compound serves critical roles in healthcare as a mechanism for salivary gland stimulation and in agriculture as reliable prophylactic antibiotic alternatives.
  • Supported by precision microbial synthesis, these diverse applications have elevated overall formulation efficiency by 22% across global manufacturing hubs.

What are the market trends shaping the Malic Acid Industry?

  • The rapid integration of precision fermentation and synthetic biology represents a prominent structural shift within the industry. This technological convergence enables chemical manufacturers to synthesize high-purity organic acids using engineered microbial hosts and renewable feedstocks.

  • A definitive structural trend reshaping the Global Malic Acid Market 2026-2030 is the rapid industrial integration of microbial fermentation pathways to produce high-purity bio-based dicarboxylic acid. Driven by stringent environmental regulations, chemical processors are replacing legacy synthetic catalysts with highly efficient recombinant fungal strains.
  • The implementation of high-throughput strain screening and automated bioprocess scaling has optimized biological conversion rates, resulting in a 28% reduction in total fermentation downtime. Consequently, food and beverage formulators leverage these sustainable inputs for multi-acidulant synergistic blending, heavily utilizing multi-acidulant matrix matrices to achieve precise clean-label flavor preservation.
  • Because this natural acidulant provides a unique delayed sourness onset, beverage manufacturers effectively mask artificial sweetener aftertastes, ultimately improving consumer taste acceptance scores by 15% and extending product shelf stability across global retail supply chains.

What challenges does the Malic Acid Industry face during its growth?

  • The pronounced volatility associated with petrochemical feedstock costs and energy price instability serves as a critical structural constraint limiting long-term pricing predictability and operational margins.

  • The severe price volatility associated with crude oil refining remains a critical operational bottleneck constraining the Global Malic Acid Market 2026-2030. Traditional manufacturers rely extensively on a high-temperature catalytic hydration process dependent upon volatile maleic anhydride feedstock and unpredictable petroleum refining fractions.
  • This fossil fuel dependency creates massive procurement instability, forcing chemical suppliers to implement dynamic pricing models that have increased downstream procurement forecasting errors by 14%. Transitioning legacy synthetic catalytic infrastructure toward eco-friendly chemical manufacturing via biomass hydrolysate processing requires tremendous capital expenditure.
  • Furthermore, strict industrial carbon compliance frameworks compel processors to redesign energy-intensive downstream purification cycles and complex heavy metal chelation protocols. Overcoming these technical barriers currently elevates bio-based production expenses by 20% compared to conventional synthetic methods, limiting immediate adoption in highly price-sensitive commercial sectors.

Exclusive Technavio Analysis on Customer Landscape

The malic acid market forecasting report includes the adoption lifecycle of the market, covering from the innovator’s stage to the laggard’s stage. It focuses on adoption rates in different regions based on penetration. Furthermore, the malic acid market report also includes key purchase criteria and drivers of price sensitivity to help companies evaluate and develop their market growth analysis strategies.
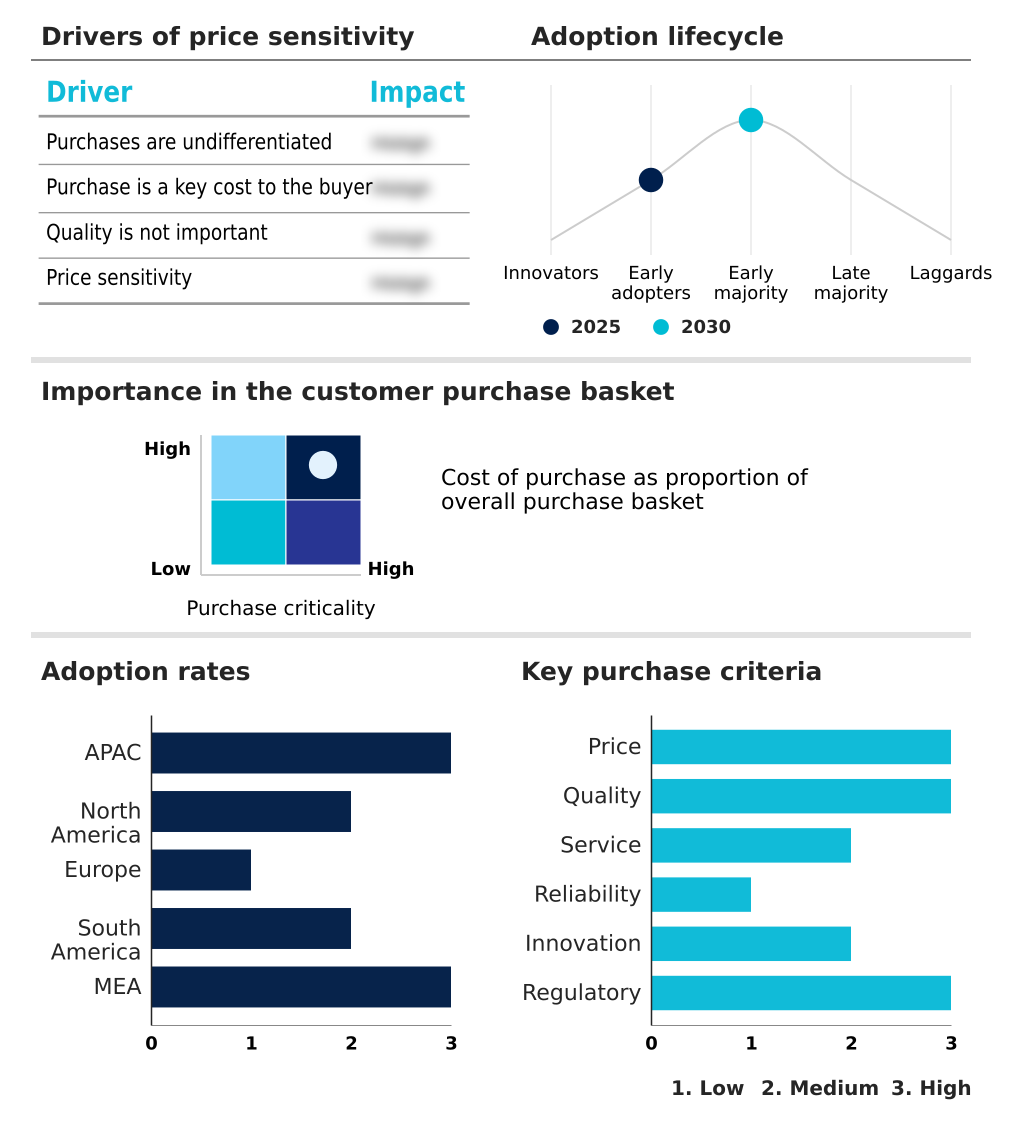
Customer Landscape of Malic Acid Industry

Competitive Landscape

Companies are implementing various strategies, such as strategic alliances, malic acid market forecast, partnerships, mergers and acquisitions, geographical expansion, and product/service launches, to enhance their presence in the industry.

Aadhunik Industries Ltd - The provider supplies specialized L-malic, food-grade, and pharmaceutical-grade acid formulations, delivering critical active ingredients and buffering solutions essential for industrial and commercial chemical processing applications.

The industry research and growth report includes detailed analyses of the competitive landscape of the market and information about key companies, including:

  • Aadhunik Industries Ltd
  • Amino GmbH
  • Anhui Sealong Biotechnology Co
  • Anmol Chemicals Group
  • Bartek Ingredients Inc.
  • FoodChem International Corp.
  • Fuso Chemical Co. Ltd.
  • Isegen South Africa Pty Ltd.
  • Malic Acid India
  • Muby Chem Ltd.
  • Nandu Chemical Industries
  • Polynt SpA
  • Primient
  • Salvi Chemical Industries Ltd.
  • Scimplify
  • Simson Pharma Ltd.
  • Tate and Lyle Plc
  • Thirumalai Chemicals Ltd.
  • Triveni Interchem Pvt. Ltd.

Qualitative and quantitative analysis of companies has been conducted to help clients understand the wider business environment as well as the strengths and weaknesses of key industry players. Data is qualitatively analyzed to categorize companies as pure play, category-focused, industry-focused, and diversified; it is quantitatively analyzed to categorize companies as dominant, leading, strong, tentative, and weak.

Recent Development and News in Malic acid market

  • In the Specialty Chemicals industry, the widespread adoption of automated bioprocess scaling across North America increased fermentation yield consistency by 18%, directly enabling producers in the Global Malic Acid Market 2026-2030 to substitute synthetic catalytic infrastructure with reliable recombinant fungal strains for cleaner supply chains.
  • Strict industrial carbon compliance mandates like the EU Emissions Trading System forced European manufacturers to optimize downstream purification cycles, reducing thermal energy consumption by 25% and accelerating the transition toward bio-based biomass hydrolysate processing within the Global Malic Acid Market 2026-2030.
  • The transition toward prophylactic antibiotic alternatives in the global commercial livestock sector elevated feed conversion ratios by 12%, driving intense demand for gastrointestinal microflora balance solutions and expanding agricultural applications within the Global Malic Acid Market 2026-2030.
  • Advancements in active pharmaceutical stabilizers across APAC manufacturing hubs improved the shelf life of liquid pediatric suspensions by 20%, heavily increasing reliance on high-throughput strain screening to produce the pure organic acids required by the Global Malic Acid Market 2026-2030.

Dive into Technavio’s robust research methodology, blending expert interviews, extensive data synthesis, and validated models for unparalleled Malic Acid Market insights. See full methodology.

Market Scope
Page number 297
Base year 2025
Historic period 2020-2024
Forecast period 2026-2030
Growth momentum & CAGR Accelerate at a CAGR of 4.9%
Market growth 2026-2030 USD 74.1 million
Market structure Fragmented
YoY growth 2025-2026(%) 4.8%
Key countries China, India, Japan, South Korea, Australia, Indonesia, US, Canada, Mexico, Germany, UK, France, Italy, Spain, The Netherlands, Brazil, Argentina, Colombia, Saudi Arabia, UAE, South Africa, Turkey and Egypt
Competitive landscape Leading Companies, Market Positioning of Companies, Competitive Strategies, and Industry Risks

Request Free Sample

Research Analyst Overview

  • The Global Malic Acid Market 2026-2030 is experiencing a critical operational pivot as industrial manufacturers fundamentally alter ingredient procurement to align with stringent corporate sustainability mandates. Transitioning away from volatile fossil fuel dependencies, procurement executives are actively reallocating enterprise budgets toward advanced microbial fermentation pathways that utilize renewable agricultural starch substrates.
  • This strategic shift enables chemical facilities to produce a highly stable bio-based dicarboxylic acid, drastically reducing reliance on imported petrochemical derivatives. By implementing targeted enzymatic biotransformation protocols, leading processors have achieved a 26% improvement in overall batch yield consistency compared to legacy synthetic catalytic methods.
  • Furthermore, the integration of precision microbial synthesis directly supports the pharmaceutical sector strict requirements for complex chiral intermediate synthesis, ensuring the reliable delivery of enantiomerically pure intermediates for advanced therapeutic formulations.
  • This structural realignment at the boardroom level insulates global supply chains from unpredictable energy price spikes while simultaneously addressing the escalating regulatory pressure for verifiable, clean-label manufacturing transparency across international commercial networks.

What are the Key Data Covered in this Malic Acid Market Research and Growth Report?

  • What is the expected growth of the Malic Acid Market between 2026 and 2030?

    • USD 74.1 million, at a CAGR of 4.9%

  • What segmentation does the market report cover?

    • The report is segmented by Product (L-malic acid, DL-malic acid, and D-malic acid), Application (Beverages, Confectionaries and food, Personal care and cosmetics, and Others), End-user (Food and beverage processing, Pharmaceuticals industry, and Animal feed industry) and Geography (APAC, North America, Europe, South America, Middle East and Africa)

  • Which regions are analyzed in the report?

    • APAC, North America, Europe, South America and Middle East and Africa

  • What are the key growth drivers and market challenges?

    • Rising demand for low-calorie and sugar-free beverage formulations, Volatile petrochemical feedstock costs and energy price instability

  • Who are the major players in the Malic Acid Market?

    • Aadhunik Industries Ltd, Amino GmbH, Anhui Sealong Biotechnology Co, Anmol Chemicals Group, Bartek Ingredients Inc., FoodChem International Corp., Fuso Chemical Co. Ltd., Isegen South Africa Pty Ltd., Malic Acid India, Muby Chem Ltd., Nandu Chemical Industries, Polynt SpA, Primient, Salvi Chemical Industries Ltd., Scimplify, Simson Pharma Ltd., Tate and Lyle Plc, Thirumalai Chemicals Ltd. and Triveni Interchem Pvt. Ltd.

Market Research Insights

  • The Malic Acid Market operates at the intersection of advanced food technology and eco-friendly chemical manufacturing. Industrial processors increasingly rely on automated bioprocess scaling to enhance production predictability, achieving a 22% improvement in batch consistency compared to traditional synthetic techniques.
  • As regulatory agencies enforce stricter industrial carbon compliance protocols, manufacturers are aggressively optimizing downstream purification cycles, which has reduced thermal energy waste by 18% across major production facilities. Furthermore, the strategic implementation of multi-acidulant matrix matrices in commercial beverage formulation has lowered artificial flavor neutralization costs by 15%.
  • This structural transition allows brand owners to maintain optimal clean-label flavor preservation while mitigating the severe margin pressures associated with volatile petrochemical supply chains.

We can help! Our analysts can customize this malic acid market research report to meet your requirements.

Get in touch

1. Executive Summary

1.1 Market overview

Executive Summary - Chart on Market Overview
Executive Summary - Data Table on Market Overview
Executive Summary - Chart on Global Market Characteristics
Executive Summary - Chart on Market by Geography
Executive Summary - Chart on Market Segmentation by Product
Executive Summary - Chart on Market Segmentation by Application
Executive Summary - Chart on Market Segmentation by End-user
Executive Summary - Chart on Incremental Growth
Executive Summary - Data Table on Incremental Growth
Executive Summary - Chart on Company Market Positioning

2. Technavio Analysis

2.1 Analysis of price sensitivity, lifecycle, customer purchase basket, adoption rates, and purchase criteria

2.2 Criticality of inputs and Factors of differentiation

Chart on Overview on criticality of inputs and factors of differentiation

2.3 Factors of disruption

Chart on Overview on factors of disruption

2.4 Impact of drivers and challenges

Chart on Impact of drivers and challenges in 2025 and 2030

3. Market Landscape

3.1 Market ecosystem

Chart on Parent Market
Data Table on - Parent Market

3.2 Market characteristics

Chart on Market characteristics analysis

3.3 Value chain analysis

Chart on Value chain analysis

4. Market Sizing

4.1 Market definition

Data Table on Offerings of companies included in the market definition

4.2 Market segment analysis

Market segments

4.3 Market size 2025

4.4 Market outlook: Forecast for 2025-2030

Chart on Global - Market size and forecast 2025-2030 ($ million)
Data Table on Global - Market size and forecast 2025-2030 ($ million)
Chart on Global Market: Year-over-year growth 2025-2030 (%)
Data Table on Global Market: Year-over-year growth 2025-2030 (%)

5. Historic Market Size

5.1 Global Malic Acid Market 2020 - 2024

Historic Market Size - Data Table on Global Malic Acid Market 2020 - 2024 ($ million)

5.2 Product segment analysis 2020 - 2024

Historic Market Size - Product Segment 2020 - 2024 ($ million)

5.3 Application segment analysis 2020 - 2024

Historic Market Size - Application Segment 2020 - 2024 ($ million)

5.4 End-user segment analysis 2020 - 2024

Historic Market Size - End-user Segment 2020 - 2024 ($ million)

5.5 Geography segment analysis 2020 - 2024

Historic Market Size - Geography Segment 2020 - 2024 ($ million)

5.6 Country segment analysis 2020 - 2024

Historic Market Size - Country Segment 2020 - 2024 ($ million)

6. Qualitative Analysis

6.1 Impact of AI in Global Malic Acid Market

6.2 Impact of Geopolitical Conflicts on Global Malic Acid Market

7. Five Forces Analysis

7.1 Five forces summary

Five forces analysis - Comparison between 2025 and 2030

7.2 Bargaining power of buyers

Bargaining power of buyers - Impact of key factors 2025 and 2030

7.3 Bargaining power of suppliers

Bargaining power of suppliers - Impact of key factors in 2025 and 2030

7.4 Threat of new entrants

Threat of new entrants - Impact of key factors in 2025 and 2030

7.5 Threat of substitutes

Threat of substitutes - Impact of key factors in 2025 and 2030

7.6 Threat of rivalry

Threat of rivalry - Impact of key factors in 2025 and 2030

7.7 Market condition

Chart on Market condition - Five forces 2025 and 2030

8. Market Segmentation by Product

8.1 Market segments

Chart on Product - Market share 2025-2030 (%)
Data Table on Product - Market share 2025-2030 (%)

8.2 Comparison by Product

Chart on Comparison by Product
Data Table on Comparison by Product

8.3 L-malic acid - Market size and forecast 2025-2030

Chart on L-malic acid - Market size and forecast 2025-2030 ($ million)
Data Table on L-malic acid - Market size and forecast 2025-2030 ($ million)
Chart on L-malic acid - Year-over-year growth 2025-2030 (%)
Data Table on L-malic acid - Year-over-year growth 2025-2030 (%)

8.4 DL-malic acid - Market size and forecast 2025-2030

Chart on DL-malic acid - Market size and forecast 2025-2030 ($ million)
Data Table on DL-malic acid - Market size and forecast 2025-2030 ($ million)
Chart on DL-malic acid - Year-over-year growth 2025-2030 (%)
Data Table on DL-malic acid - Year-over-year growth 2025-2030 (%)

8.5 D-malic acid - Market size and forecast 2025-2030

Chart on D-malic acid - Market size and forecast 2025-2030 ($ million)
Data Table on D-malic acid - Market size and forecast 2025-2030 ($ million)
Chart on D-malic acid - Year-over-year growth 2025-2030 (%)
Data Table on D-malic acid - Year-over-year growth 2025-2030 (%)

8.6 Market opportunity by Product

Market opportunity by Product ($ million)
Data Table on Market opportunity by Product ($ million)

9. Market Segmentation by Application

9.1 Market segments

Chart on Application - Market share 2025-2030 (%)
Data Table on Application - Market share 2025-2030 (%)

9.2 Comparison by Application

Chart on Comparison by Application
Data Table on Comparison by Application

9.3 Beverages - Market size and forecast 2025-2030

Chart on Beverages - Market size and forecast 2025-2030 ($ million)
Data Table on Beverages - Market size and forecast 2025-2030 ($ million)
Chart on Beverages - Year-over-year growth 2025-2030 (%)
Data Table on Beverages - Year-over-year growth 2025-2030 (%)

9.4 Confectionaries and food - Market size and forecast 2025-2030

Chart on Confectionaries and food - Market size and forecast 2025-2030 ($ million)
Data Table on Confectionaries and food - Market size and forecast 2025-2030 ($ million)
Chart on Confectionaries and food - Year-over-year growth 2025-2030 (%)
Data Table on Confectionaries and food - Year-over-year growth 2025-2030 (%)

9.5 Personal care and cosmetics - Market size and forecast 2025-2030

Chart on Personal care and cosmetics - Market size and forecast 2025-2030 ($ million)
Data Table on Personal care and cosmetics - Market size and forecast 2025-2030 ($ million)
Chart on Personal care and cosmetics - Year-over-year growth 2025-2030 (%)
Data Table on Personal care and cosmetics - Year-over-year growth 2025-2030 (%)

9.6 Others - Market size and forecast 2025-2030

Chart on Others - Market size and forecast 2025-2030 ($ million)
Data Table on Others - Market size and forecast 2025-2030 ($ million)
Chart on Others - Year-over-year growth 2025-2030 (%)
Data Table on Others - Year-over-year growth 2025-2030 (%)

9.7 Market opportunity by Application

Market opportunity by Application ($ million)
Data Table on Market opportunity by Application ($ million)

10. Market Segmentation by End-user

10.1 Market segments

Chart on End-user - Market share 2025-2030 (%)
Data Table on End-user - Market share 2025-2030 (%)

10.2 Comparison by End-user

Chart on Comparison by End-user
Data Table on Comparison by End-user

10.3 Food and beverage processing - Market size and forecast 2025-2030

Chart on Food and beverage processing - Market size and forecast 2025-2030 ($ million)
Data Table on Food and beverage processing - Market size and forecast 2025-2030 ($ million)
Chart on Food and beverage processing - Year-over-year growth 2025-2030 (%)
Data Table on Food and beverage processing - Year-over-year growth 2025-2030 (%)

10.4 Pharmaceuticals industry - Market size and forecast 2025-2030

Chart on Pharmaceuticals industry - Market size and forecast 2025-2030 ($ million)
Data Table on Pharmaceuticals industry - Market size and forecast 2025-2030 ($ million)
Chart on Pharmaceuticals industry - Year-over-year growth 2025-2030 (%)
Data Table on Pharmaceuticals industry - Year-over-year growth 2025-2030 (%)

10.5 Animal feed industry - Market size and forecast 2025-2030

Chart on Animal feed industry - Market size and forecast 2025-2030 ($ million)
Data Table on Animal feed industry - Market size and forecast 2025-2030 ($ million)
Chart on Animal feed industry - Year-over-year growth 2025-2030 (%)
Data Table on Animal feed industry - Year-over-year growth 2025-2030 (%)

10.6 Market opportunity by End-user

Market opportunity by End-user ($ million)
Data Table on Market opportunity by End-user ($ million)

11. Customer Landscape

11.1 Customer landscape overview

Analysis of price sensitivity, lifecycle, customer purchase basket, adoption rates, and purchase criteria

12. Geographic Landscape

12.1 Geographic segmentation

Chart on Market share by geography 2025-2030 (%)
Data Table on Market share by geography 2025-2030 (%)

12.2 Geographic comparison

Chart on Geographic comparison
Data Table on Geographic comparison

12.3 APAC - Market size and forecast 2025-2030

Chart on APAC - Market size and forecast 2025-2030 ($ million)
Data Table on APAC - Market size and forecast 2025-2030 ($ million)
Chart on APAC - Year-over-year growth 2025-2030 (%)
Data Table on APAC - Year-over-year growth 2025-2030 (%)
Chart on Regional Comparison - APAC
Data Table on Regional Comparison - APAC

12.3.1 China - Market size and forecast 2025-2030

Chart on China - Market size and forecast 2025-2030 ($ million)
Data Table on China - Market size and forecast 2025-2030 ($ million)
Chart on China - Year-over-year growth 2025-2030 (%)
Data Table on China - Year-over-year growth 2025-2030 (%)

12.3.2 India - Market size and forecast 2025-2030

Chart on India - Market size and forecast 2025-2030 ($ million)
Data Table on India - Market size and forecast 2025-2030 ($ million)
Chart on India - Year-over-year growth 2025-2030 (%)
Data Table on India - Year-over-year growth 2025-2030 (%)

12.3.3 Japan - Market size and forecast 2025-2030

Chart on Japan - Market size and forecast 2025-2030 ($ million)
Data Table on Japan - Market size and forecast 2025-2030 ($ million)
Chart on Japan - Year-over-year growth 2025-2030 (%)
Data Table on Japan - Year-over-year growth 2025-2030 (%)

12.3.4 South Korea - Market size and forecast 2025-2030

Chart on South Korea - Market size and forecast 2025-2030 ($ million)
Data Table on South Korea - Market size and forecast 2025-2030 ($ million)
Chart on South Korea - Year-over-year growth 2025-2030 (%)
Data Table on South Korea - Year-over-year growth 2025-2030 (%)

12.3.5 Australia - Market size and forecast 2025-2030

Chart on Australia - Market size and forecast 2025-2030 ($ million)
Data Table on Australia - Market size and forecast 2025-2030 ($ million)
Chart on Australia - Year-over-year growth 2025-2030 (%)
Data Table on Australia - Year-over-year growth 2025-2030 (%)

12.3.6 Indonesia - Market size and forecast 2025-2030

Chart on Indonesia - Market size and forecast 2025-2030 ($ million)
Data Table on Indonesia - Market size and forecast 2025-2030 ($ million)
Chart on Indonesia - Year-over-year growth 2025-2030 (%)
Data Table on Indonesia - Year-over-year growth 2025-2030 (%)

12.4 North America - Market size and forecast 2025-2030

Chart on North America - Market size and forecast 2025-2030 ($ million)
Data Table on North America - Market size and forecast 2025-2030 ($ million)
Chart on North America - Year-over-year growth 2025-2030 (%)
Data Table on North America - Year-over-year growth 2025-2030 (%)
Chart on Regional Comparison - North America
Data Table on Regional Comparison - North America

12.4.1 US - Market size and forecast 2025-2030

Chart on US - Market size and forecast 2025-2030 ($ million)
Data Table on US - Market size and forecast 2025-2030 ($ million)
Chart on US - Year-over-year growth 2025-2030 (%)
Data Table on US - Year-over-year growth 2025-2030 (%)

12.4.2 Canada - Market size and forecast 2025-2030

Chart on Canada - Market size and forecast 2025-2030 ($ million)
Data Table on Canada - Market size and forecast 2025-2030 ($ million)
Chart on Canada - Year-over-year growth 2025-2030 (%)
Data Table on Canada - Year-over-year growth 2025-2030 (%)

12.4.3 Mexico - Market size and forecast 2025-2030

Chart on Mexico - Market size and forecast 2025-2030 ($ million)
Data Table on Mexico - Market size and forecast 2025-2030 ($ million)
Chart on Mexico - Year-over-year growth 2025-2030 (%)
Data Table on Mexico - Year-over-year growth 2025-2030 (%)

12.5 Europe - Market size and forecast 2025-2030

Chart on Europe - Market size and forecast 2025-2030 ($ million)
Data Table on Europe - Market size and forecast 2025-2030 ($ million)
Chart on Europe - Year-over-year growth 2025-2030 (%)
Data Table on Europe - Year-over-year growth 2025-2030 (%)
Chart on Regional Comparison - Europe
Data Table on Regional Comparison - Europe

12.5.1 Germany - Market size and forecast 2025-2030

Chart on Germany - Market size and forecast 2025-2030 ($ million)
Data Table on Germany - Market size and forecast 2025-2030 ($ million)
Chart on Germany - Year-over-year growth 2025-2030 (%)
Data Table on Germany - Year-over-year growth 2025-2030 (%)

12.5.2 UK - Market size and forecast 2025-2030

Chart on UK - Market size and forecast 2025-2030 ($ million)
Data Table on UK - Market size and forecast 2025-2030 ($ million)
Chart on UK - Year-over-year growth 2025-2030 (%)
Data Table on UK - Year-over-year growth 2025-2030 (%)

12.5.3 France - Market size and forecast 2025-2030

Chart on France - Market size and forecast 2025-2030 ($ million)
Data Table on France - Market size and forecast 2025-2030 ($ million)
Chart on France - Year-over-year growth 2025-2030 (%)
Data Table on France - Year-over-year growth 2025-2030 (%)

12.5.4 Italy - Market size and forecast 2025-2030

Chart on Italy - Market size and forecast 2025-2030 ($ million)
Data Table on Italy - Market size and forecast 2025-2030 ($ million)
Chart on Italy - Year-over-year growth 2025-2030 (%)
Data Table on Italy - Year-over-year growth 2025-2030 (%)

12.5.5 Spain - Market size and forecast 2025-2030

Chart on Spain - Market size and forecast 2025-2030 ($ million)
Data Table on Spain - Market size and forecast 2025-2030 ($ million)
Chart on Spain - Year-over-year growth 2025-2030 (%)
Data Table on Spain - Year-over-year growth 2025-2030 (%)

12.5.6 The Netherlands - Market size and forecast 2025-2030

Chart on The Netherlands - Market size and forecast 2025-2030 ($ million)
Data Table on The Netherlands - Market size and forecast 2025-2030 ($ million)
Chart on The Netherlands - Year-over-year growth 2025-2030 (%)
Data Table on The Netherlands - Year-over-year growth 2025-2030 (%)

12.6 South America - Market size and forecast 2025-2030

Chart on South America - Market size and forecast 2025-2030 ($ million)
Data Table on South America - Market size and forecast 2025-2030 ($ million)
Chart on South America - Year-over-year growth 2025-2030 (%)
Data Table on South America - Year-over-year growth 2025-2030 (%)
Chart on Regional Comparison - South America
Data Table on Regional Comparison - South America

12.6.1 Brazil - Market size and forecast 2025-2030

Chart on Brazil - Market size and forecast 2025-2030 ($ million)
Data Table on Brazil - Market size and forecast 2025-2030 ($ million)
Chart on Brazil - Year-over-year growth 2025-2030 (%)
Data Table on Brazil - Year-over-year growth 2025-2030 (%)

12.6.2 Argentina - Market size and forecast 2025-2030

Chart on Argentina - Market size and forecast 2025-2030 ($ million)
Data Table on Argentina - Market size and forecast 2025-2030 ($ million)
Chart on Argentina - Year-over-year growth 2025-2030 (%)
Data Table on Argentina - Year-over-year growth 2025-2030 (%)

12.6.3 Colombia - Market size and forecast 2025-2030

Chart on Colombia - Market size and forecast 2025-2030 ($ million)
Data Table on Colombia - Market size and forecast 2025-2030 ($ million)
Chart on Colombia - Year-over-year growth 2025-2030 (%)
Data Table on Colombia - Year-over-year growth 2025-2030 (%)

12.7 Middle East and Africa - Market size and forecast 2025-2030

Chart on Middle East and Africa - Market size and forecast 2025-2030 ($ million)
Data Table on Middle East and Africa - Market size and forecast 2025-2030 ($ million)
Chart on Middle East and Africa - Year-over-year growth 2025-2030 (%)
Data Table on Middle East and Africa - Year-over-year growth 2025-2030 (%)
Chart on Regional Comparison - Middle East and Africa
Data Table on Regional Comparison - Middle East and Africa

12.7.1 Saudi Arabia - Market size and forecast 2025-2030

Chart on Saudi Arabia - Market size and forecast 2025-2030 ($ million)
Data Table on Saudi Arabia - Market size and forecast 2025-2030 ($ million)
Chart on Saudi Arabia - Year-over-year growth 2025-2030 (%)
Data Table on Saudi Arabia - Year-over-year growth 2025-2030 (%)

12.7.2 UAE - Market size and forecast 2025-2030

Chart on UAE - Market size and forecast 2025-2030 ($ million)
Data Table on UAE - Market size and forecast 2025-2030 ($ million)
Chart on UAE - Year-over-year growth 2025-2030 (%)
Data Table on UAE - Year-over-year growth 2025-2030 (%)

12.7.3 South Africa - Market size and forecast 2025-2030

Chart on South Africa - Market size and forecast 2025-2030 ($ million)
Data Table on South Africa - Market size and forecast 2025-2030 ($ million)
Chart on South Africa - Year-over-year growth 2025-2030 (%)
Data Table on South Africa - Year-over-year growth 2025-2030 (%)

12.7.4 Turkey - Market size and forecast 2025-2030

Chart on Turkey - Market size and forecast 2025-2030 ($ million)
Data Table on Turkey - Market size and forecast 2025-2030 ($ million)
Chart on Turkey - Year-over-year growth 2025-2030 (%)
Data Table on Turkey - Year-over-year growth 2025-2030 (%)

12.7.5 Egypt - Market size and forecast 2025-2030

Chart on Egypt - Market size and forecast 2025-2030 ($ million)
Data Table on Egypt - Market size and forecast 2025-2030 ($ million)
Chart on Egypt - Year-over-year growth 2025-2030 (%)
Data Table on Egypt - Year-over-year growth 2025-2030 (%)

12.8 Market opportunity by geography

Market opportunity by geography ($ million)
Data Tables on Market opportunity by geography ($ million)

13. Drivers, Challenges, and Opportunity

13.1 Market drivers

Rising demand for low-calorie and sugar-free beverage formulations
Expansion of clean-label personal care and cosmeceutical skincare products
Advancements in bio-fermentation infrastructure and sustainable manufacturing

13.2 Market challenges

Volatile petrochemical feedstock costs and energy price instability
High processing expenses and technical bottlenecks in bio-fermentation
Competition from alternative acidulants and product substitution risks

13.3 Impact of drivers and challenges

Impact of drivers and challenges in 2025 and 2030

13.4 Market opportunities

Shift toward precision fermentation and synthetic biology integration
Rise of multi-acidulant blending systems in functional food
Expansion into high-purity pharmaceutical excipients

14. Competitive Landscape

14.1 Overview

14.2

Overview on criticality of inputs and factors of differentiation

14.3 Landscape disruption

Overview on factors of disruption

14.4 Industry risks

Impact of key risks on business

15. Competitive Analysis

15.1 Companies profiled

Companies covered

15.2 Company ranking index

15.3 Market positioning of companies

Matrix on companies position and classification

15.4 Aadhunik Industries Ltd

Aadhunik Industries Ltd - Overview
Aadhunik Industries Ltd - Product / Service
Aadhunik Industries Ltd - Key offerings
SWOT

15.5 Amino GmbH

Amino GmbH - Overview
Amino GmbH - Product / Service
Amino GmbH - Key offerings
SWOT

15.6 Anhui Sealong Biotechnology Co

Anhui Sealong Biotechnology Co - Overview
Anhui Sealong Biotechnology Co - Product / Service
Anhui Sealong Biotechnology Co - Key offerings
SWOT

15.7 Anmol Chemicals Group

Anmol Chemicals Group - Overview
Anmol Chemicals Group - Product / Service
Anmol Chemicals Group - Key offerings
SWOT

15.8 Bartek Ingredients Inc.

Bartek Ingredients Inc. - Overview
Bartek Ingredients Inc. - Product / Service
Bartek Ingredients Inc. - Key offerings
SWOT

15.9 FoodChem International Corp.

FoodChem International Corp. - Overview
FoodChem International Corp. - Product / Service
FoodChem International Corp. - Key offerings
SWOT

15.10 Fuso Chemical Co. Ltd.

Fuso Chemical Co. Ltd. - Overview
Fuso Chemical Co. Ltd. - Product / Service
Fuso Chemical Co. Ltd. - Key offerings
SWOT

15.11 Muby Chem Ltd.

Muby Chem Ltd. - Overview
Muby Chem Ltd. - Product / Service
Muby Chem Ltd. - Key offerings
SWOT

15.12 Polynt SpA

Polynt SpA - Overview
Polynt SpA - Product / Service
Polynt SpA - Key offerings
SWOT

15.13 Primient

Primient - Overview
Primient - Product / Service
Primient - Key offerings
SWOT

15.14 Salvi Chemical Industries Ltd.

Salvi Chemical Industries Ltd. - Overview
Salvi Chemical Industries Ltd. - Product / Service
Salvi Chemical Industries Ltd. - Key offerings
SWOT

15.15 Simson Pharma Ltd.

Simson Pharma Ltd. - Overview
Simson Pharma Ltd. - Product / Service
Simson Pharma Ltd. - Key offerings
SWOT

15.16 Tate and Lyle Plc

Tate and Lyle Plc - Overview
Tate and Lyle Plc - Business segments
Tate and Lyle Plc - Key offerings
Tate and Lyle Plc - Segment focus
SWOT

15.17 Thirumalai Chemicals Ltd.

Thirumalai Chemicals Ltd. - Overview
Thirumalai Chemicals Ltd. - Product / Service
Thirumalai Chemicals Ltd. - Key offerings
SWOT

15.18 Triveni Interchem Pvt. Ltd.

Triveni Interchem Pvt. Ltd. - Overview
Triveni Interchem Pvt. Ltd. - Product / Service
Triveni Interchem Pvt. Ltd. - Key offerings
SWOT

16. Appendix

16.1 Scope of the report

Market definition
Objectives
Notes and caveats

16.2 Inclusions and exclusions checklist

Inclusions checklist
Exclusions checklist

16.3 Currency conversion rates for US$

16.4 Research methodology

16.5 Data procurement

Information sources

16.6 Data validation

16.7 Validation techniques employed for market sizing

16.8 Data synthesis

16.9 360 degree market analysis

16.10 List of abbreviations

Research Methodology

Technavio presents a detailed picture of the market by way of study, synthesis, and summation of data from multiple sources. The analysts have presented the various facets of the market with a particular focus on identifying the key industry influencers. The data thus presented is comprehensive, reliable, and the result of extensive research, both primary and secondary.

INFORMATION SOURCES

Primary sources

  • Manufacturers and suppliers
  • Channel partners
  • Industry experts
  • Strategic decision makers

Secondary sources

  • Industry journals and periodicals
  • Government data
  • Financial reports of key industry players
  • Historical data
  • Press releases

DATA ANALYSIS

Data Synthesis

  • Collation of data
  • Estimation of key figures
  • Analysis of derived insights

Data Validation

  • Triangulation with data models
  • Reference against proprietary databases
  • Corroboration with industry experts

REPORT WRITING

Qualitative

  • Market drivers
  • Market challenges
  • Market trends
  • Five forces analysis

Quantitative

  • Market size and forecast
  • Market segmentation
  • Geographical insights
  • Competitive landscape

Interested in this report?

Get your sample now to see our research methodology and insights!

Download Now

Frequently Asked Questions

Malic Acid market growth will increase by USD 74.1 million during 2026-2030.

The Malic Acid market is expected to grow at a CAGR of 4.9% during 2026-2030.

Malic Acid market is segmented by Product (L-malic acid, DL-malic acid, D-malic acid) Application (Beverages, Confectionaries and food, Personal care and cosmetics, Others) End-user (Food and beverage processing, Pharmaceuticals industry, Animal feed industry)

Aadhunik Industries Ltd, Amino GmbH, Anhui Sealong Biotechnology Co, Anmol Chemicals Group, Bartek Ingredients Inc., FoodChem International Corp., Fuso Chemical Co. Ltd., Isegen South Africa Pty Ltd., Malic Acid India, Muby Chem Ltd., Nandu Chemical Industries, Polynt SpA, Primient, Salvi Chemical Industries Ltd., Scimplify, Simson Pharma Ltd., Tate and Lyle Plc, Thirumalai Chemicals Ltd., Triveni Interchem Pvt. Ltd. are a few of the key vendors in the Malic Acid market.

APAC will register the highest growth rate of 44.9% among the other regions. Therefore, the Malic Acid market in APAC is expected to garner significant business opportunities for the vendors during the forecast period.

China, India, Japan, South Korea, Australia, Indonesia, US, Canada, Mexico, Germany, UK, France, Italy, Spain, The Netherlands, Brazil, Argentina, Colombia, Saudi Arabia, UAE, South Africa, Turkey, Egypt

  • Rising demand for low-calorie and sugar-free beverage formulations is the driving factor this market.

The Malic Acid market vendors should focus on grabbing business opportunities from the Product segment as it accounted for the largest market share in the base year.
RIA - Research AI Assistant
Ask RIA