
Linear Low-density Polyethylene (LLDPE) Market Analysis, Size, and Forecast 2026-2030: APAC (China, India, and Japan), North America (US, Mexico, and Canada), Europe (Germany, Italy, and France), Middle East and Africa (Turkey, Saudi Arabia, and UAE), South America (Brazil, Argentina, and Colombia), and Rest of World (ROW)

Linear Low-density Polyethylene (LLDPE) Market Analysis, Size, and Forecast 2026-2030:
APAC (China, India, and Japan), North America (US, Mexico, and Canada), Europe (Germany, Italy, and France), Middle East and Africa (Turkey, Saudi Arabia, and UAE), South America (Brazil, Argentina, and Colombia), and Rest of World (ROW)

Published: Nov 2026 313 Pages SKU: IRTNTR81851

Market Overview at a Glance

$12.92 B
Market Opportunity
4.9%
CAGR 2025 - 2030
57.7%
APAC Growth
$15.91 B
C4-LLDPE segment 2024

Linear Low-Density Polyethylene (Lldpe) Market Size 2026-2030

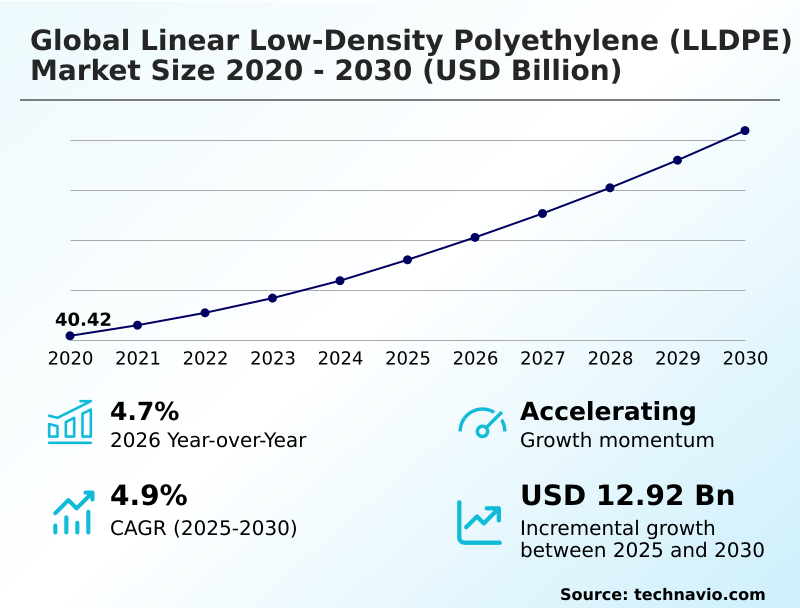
The linear low-density polyethylene (lldpe) market size is valued to increase by USD 12.92 billion, at a CAGR of 4.9% from 2025 to 2030. Surging global demand for flexible food packaging will drive the linear low-density polyethylene (lldpe) market.

Major Market Trends & Insights

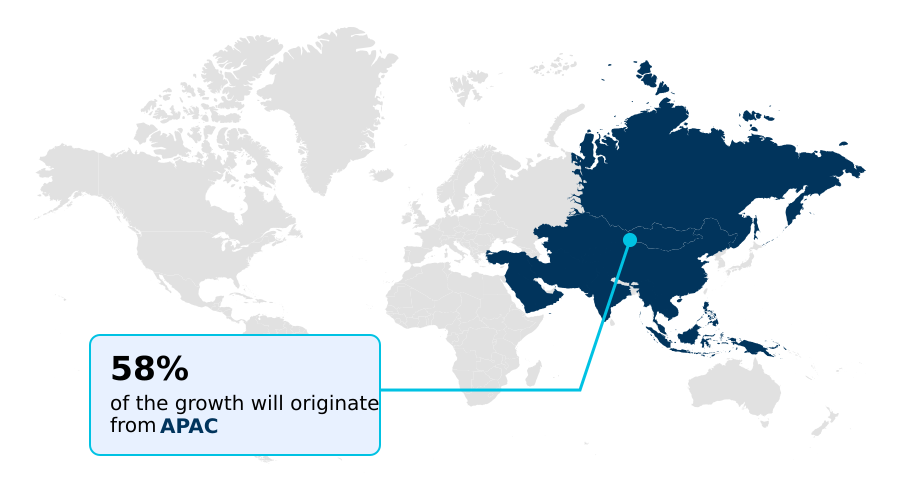
  • APAC dominated the market and accounted for a 57.7% growth during the forecast period.
  • By Type - C4-LLDPE segment was valued at USD 15.91 billion in 2024
  • By End-user - Packaging segment accounted for the largest market revenue share in 2024

Market Size & Forecast

  • Market Opportunities: USD 20.52 billion
  • Market Future Opportunities: USD 12.92 billion
  • CAGR from 2025 to 2030 : 4.9%

Market Summary

  • The Linear Low-density Polyethylene (LLDPE) Market exhibits robust structural expansion driven by the persistent requirement for high-performance polymer resins across flexible packaging and agricultural sectors. Businesses operating high-speed automated form-fill-seal machinery utilize these advanced copolymers to achieve a 15% reduction in packaging weight through aggressive downgauging without compromising structural integrity.
  • Surging demand for flexible food packaging serves as a primary driver, as changing consumer dietary habits and retail supply chains require lightweight, moisture-resistant containment solutions that preserve perishable goods. Conversely, structural feedstock disparities present a significant challenge, as naphtha-reliant manufacturing basins face compressed operating margins compared to ethane-advantaged regions, disrupting supply chain predictability.
  • Integrating machine direction orientation within multi-layer blown film extrusion lines allows converters to enhance barrier performance while supporting mono-material recyclability. The adoption of metallocene catalyst architecture fundamentally improves dart drop impact resistance and puncture toughness. Consequently, film fabricators achieve stable bubble formation and expanded processing windows, ensuring reliable fulfillment for downstream converters managing strict production timetables.

What will be the Size of the Linear Low-Density Polyethylene (Lldpe) Market during the forecast period?
Get Key Insights on Market Forecast (PDF) Get Free Sample

How is the Linear Low-Density Polyethylene (Lldpe) Market Segmented?

The linear low-density polyethylene (lldpe) industry research report provides comprehensive data (region-wise segment analysis), with forecasts and estimates in "USD million" for the period 2026-2030, as well as historical data from 2020-2024 for the following segments.

  • Type
    • C4-LLDPE
    • C6-LLDPE
    • mLLDPE
    • C8-LLDPE
  • End-user
    • Packaging
    • Agriculture
    • Construction
    • Automotive
    • Others
  • Distribution channel
    • Direct sale
    • Indirect sale
  • Geography
    • APAC
      • China
      • India
      • Japan
      • South Korea
      • Indonesia
      • Australia
    • North America
      • US
      • Mexico
      • Canada
    • Europe
      • Germany
      • Italy
      • France
      • Spain
      • UK
      • The Netherlands
    • Middle East and Africa
      • Turkey
      • Saudi Arabia
      • UAE
      • South Africa
      • Israel
    • South America
      • Brazil
      • Argentina
      • Colombia

By Type Insights

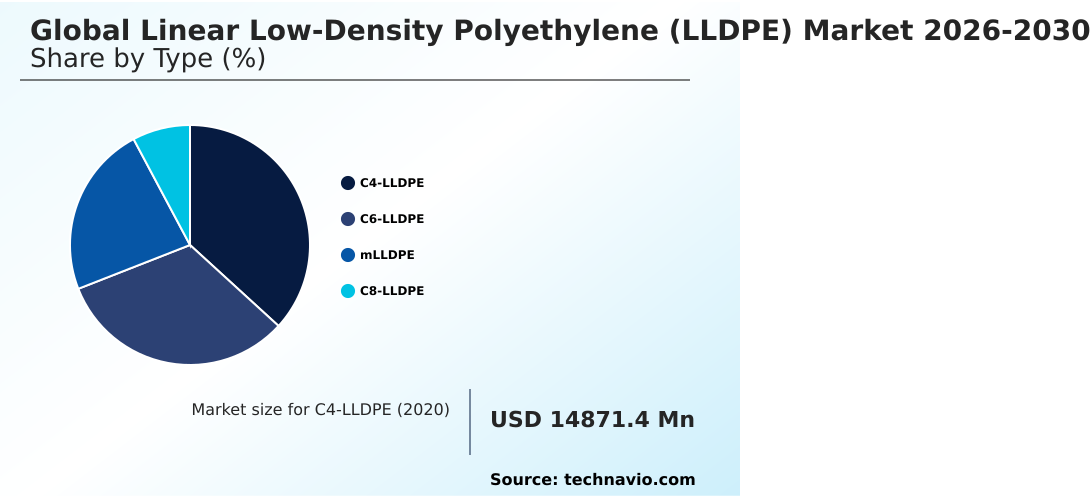
The c4-lldpe segment is estimated to witness significant growth during the forecast period.

The deployment of specific comonomer formulations fundamentally dictates the operational performance of flexible packaging applications. Resins engineered for high-capacity blown film extrusion utilizing standard alpha-olefin comonomer inputs deliver an optimal balance of affordability and processability.

By transitioning to a bimodal polyethylene grade featuring a multimodal molecular architecture, converters reduce processing energy consumption by 15% while maintaining critical mechanical strength.

This structural refinement significantly lowers the seal initiation temperature, allowing extrusion facilities to accelerate automated line speeds and increase overall throughput. Furthermore, these specific polymer architectures facilitate the creation of a durable mono-material flexible structure through a multi-layer co-extrusion die.

Precise tie layer encapsulation ensures reliable dielectric strength insulation and consistent flex-crack mitigation, empowering industrial fabricators to meet strict containment specifications without incurring the premium costs associated with higher-tier octene copolymers.
Get Free Sample

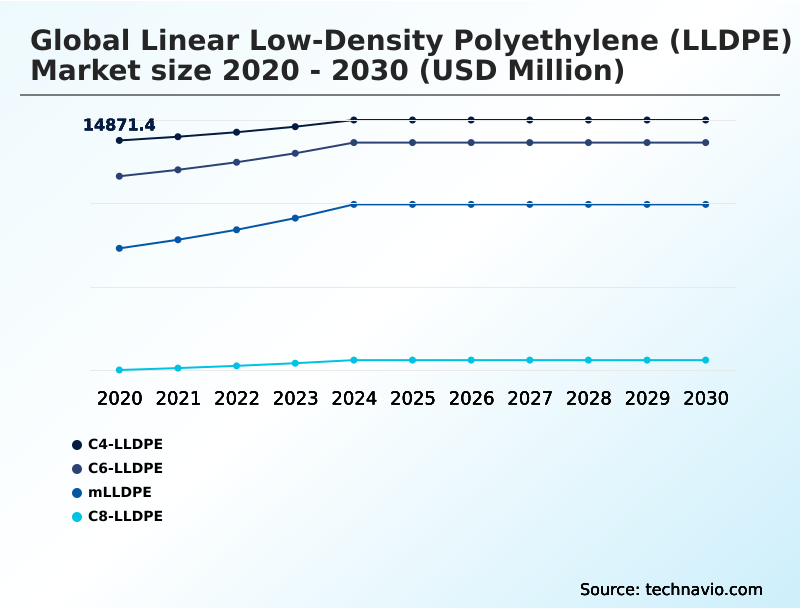
The C4-LLDPE segment was valued at USD 15.91 billion in 2024 and showed a gradual increase during the forecast period.
Get Free Sample

Regional Analysis

APAC is estimated to contribute 57.7% to the growth of the global market during the forecast period.Technavio’s analysts have elaborately explained the regional trends and drivers that shape the market during the forecast period.
See How Linear Low-Density Polyethylene (Lldpe) Market Demand is Rising in APAC Get Free Sample

The regional dynamics of the Linear Low-density Polyethylene (LLDPE) sector highlight a stark operational divergence between ethane-advantaged basins and naphtha-reliant manufacturing hubs.

Facilities in North America operating integrated petrochemical complexes achieve a 25% reduction in baseline conversion costs compared to legacy steam crackers in Europe.

This cost advantage accelerates the deployment of advanced metallocene catalyst architecture and Ziegler-Natta catalysis systems, enabling the high-volume production of resins with highly uniform short-chain branching.

Consequently, North American converters enhance dart drop impact resistance and puncture toughness, lowering material failure rates by 18% in heavy-duty shipping sack applications.

In contrast, European manufacturers heavily utilize advanced process telemetry to optimize energy efficiency by 15% across collation shrink packaging and industrial pallet hood extrusion lines.

The adoption of automated form-fill-seal machinery further mitigates high regional labor costs, illustrating how distinct geographic feedstock economies drive divergent technological investments.

Market Dynamics

Our researchers analyzed the data with 2025 as the base year, along with the key drivers, trends, and challenges. A holistic analysis of drivers will help companies refine their marketing strategies to gain a competitive advantage.

  • The transition toward sustainable and high-efficiency packaging continues to reshape the operational strategies of plastics converters globally. A primary focus involves the deployment of multi-layer blown film extrusion machinery, which enables extruders to engineer complex barrier profiles while optimizing raw material consumption.
  • By utilizing a metallocene catalyzed high-performance film, manufacturers achieve a remarkable 20% improvement in load retention stability compared to legacy monolayer configurations. This structural enhancement is particularly critical for logistics and supply chain managers seeking to minimize cargo damage during extensive intermodal transit.
  • Furthermore, as regulatory frameworks increasingly mandate circular economy practices, the mechanical recycling of secondary packaging has become a central compliance objective. To counteract the inherent loss of tensile strength associated with recycled content, fabricators are incorporating a specialized bimodal linear low-density resin into the core layers of their flexible structures.
  • This strategic blending restores essential tear resistance and prevents premature material fatigue under stress. Simultaneously, the consumer goods sector demands pristine optical clarity and rapid processing capabilities, driving the formulation of resins specifically optimized for low-temperature hermetic sealing applications.
  • By lowering the thermal threshold required to achieve a secure closure, packaging facilities can accelerate line speeds and reduce energy expenditure without compromising package integrity. These advanced polymer architectures ensure that businesses can simultaneously meet aggressive sustainability targets, optimize procurement costs, and maintain the rigorous performance standards demanded by modern automated distribution networks.
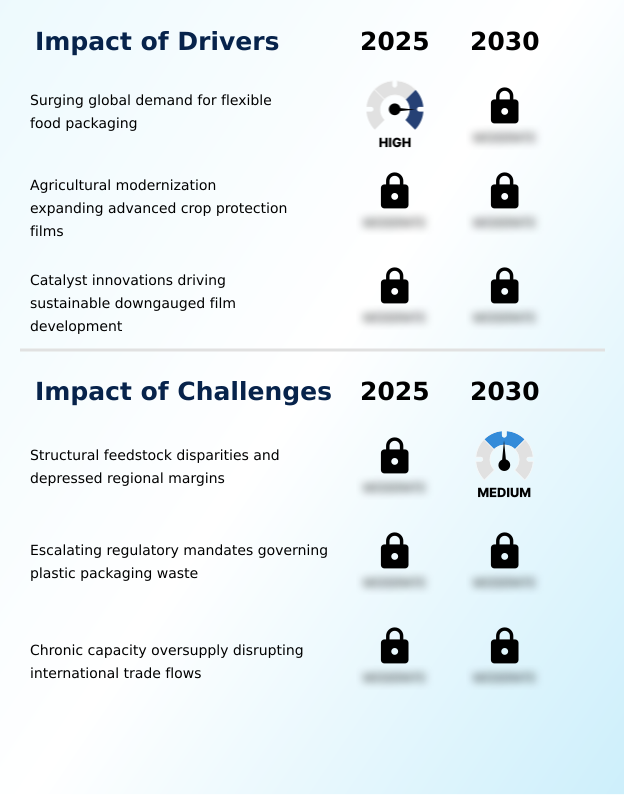
What are the key market drivers leading to the rise in the adoption of Linear Low-Density Polyethylene (Lldpe) Industry?

  • Surging global demand for flexible food packaging serves as the primary driver propelling expansion within the market.

  • The widespread adoption of modern plasticulture techniques serves as a powerful demand trigger for advanced Linear Low-density Polyethylene (LLDPE) formulations.
  • By utilizing precisely synthesized alpha-olefin comonomer blends in gas-phase fluidized bed and solution polymerization reactors, producers achieve a 35% improvement in tear propagation resistance.
  • This enhanced mechanical durability directly lowers crop spoilage rates by 18% for agribusinesses utilizing high-performance silage wrap and agricultural mulch sheet materials.
  • The superior environmental stress crack resistance of these polymers ensures the long-term viability of greenhouse cover membrane installations, reducing replacement frequency and lowering maintenance costs by 22%.
  • Furthermore, superior anaerobic fermentation preservation capabilities allow livestock operations to optimize feed quality over extended storage periods. The deployment of specialized cast stretch film secures bulk agricultural shipments, minimizing transit losses and driving continuous reliance on high-grade polyolefin solutions.

What are the market trends shaping the Linear Low-Density Polyethylene (Lldpe) Industry?

  • Acceleration of circular polyethylene mechanical recycling streams represents a prominent upcoming market trend. This development underscores the industry shift toward sustainable material management and closed-loop manufacturing systems.

  • The Linear Low-density Polyethylene (LLDPE) landscape is undergoing a structural shift driven by the acceleration of thermal pyrolysis recycling and the commercialization of mass-balance circular polymer feedstocks. This transition directly supports corporate sustainability mandates, enabling a 25% reduction in virgin material consumption across packaging portfolios.
  • Manufacturers leveraging machine direction orientation technology have improved film tensile modulus, resulting in a 20% decrease in material deformation during high-speed processing. The integration of advanced hexene copolymer resin and octene copolymer resin formulations significantly enhances the durability of downgauging film formulation applications.
  • Furthermore, the application of ultraviolet light stabilizer and thermal barrier additive compounds extends the operational lifespan of a geomembrane containment liner by 30% under intense solar radiation. These material innovations ensure superior flex-crack mitigation, allowing industrial converters to maximize operational yield while meeting aggressive environmental compliance targets.

What challenges does the Linear Low-Density Polyethylene (Lldpe) Industry face during its growth?

  • Structural feedstock disparities and depressed regional margins represent a critical challenge impeding long-term industry growth.

  • Escalating regulatory mandates governing plastic packaging waste present profound operational challenges for Linear Low-density Polyethylene (LLDPE) converters. Incorporating high proportions of secondary materials through post-consumer recyclate integration frequently induces severe rheological instability and melt fracture during thin-gauge extrusion. These processing defects cause a 40% variance in the melt flow index, drastically lowering production line efficiency.
  • Consequently, converters experience a 15% increase in material scrap rates due to compromised heat seal integrity and diminished hermetic barrier performance. Managing precise chain-transfer agent dosing and optimizing the comonomer injection ratio become increasingly complex when balancing virgin and recycled feedstocks.
  • This variability threatens the structural reliability of demanding applications, including the rotomolded fluid container and materials required for intermodal transit stabilization, forcing extruders to absorb elevated quality control overhead to maintain compliance.

Exclusive Technavio Analysis on Customer Landscape

The linear low-density polyethylene (lldpe) market forecasting report includes the adoption lifecycle of the market, covering from the innovator’s stage to the laggard’s stage. It focuses on adoption rates in different regions based on penetration. Furthermore, the linear low-density polyethylene (lldpe) market report also includes key purchase criteria and drivers of price sensitivity to help companies evaluate and develop their market growth analysis strategies.
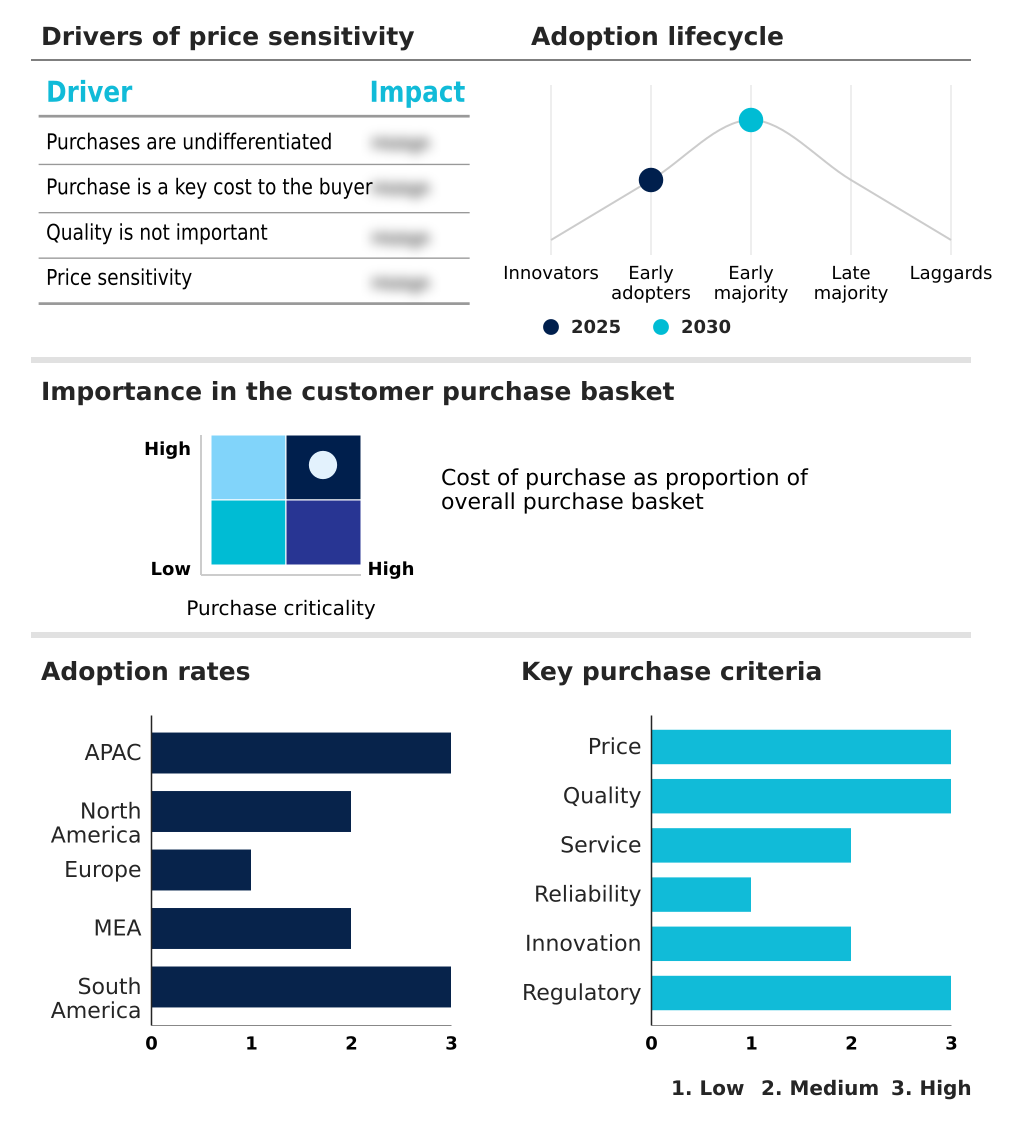
Customer Landscape of Linear Low-Density Polyethylene (Lldpe) Industry

Competitive Landscape

Companies are implementing various strategies, such as strategic alliances, linear low-density polyethylene (lldpe) market forecast, partnerships, mergers and acquisitions, geographical expansion, and product/service launches, to enhance their presence in the industry.

Borealis AG - Advanced polymer formulations including specialized resins are provided to enhance durability and performance across demanding agricultural, packaging, and infrastructure applications.

The industry research and growth report includes detailed analyses of the competitive landscape of the market and information about key companies, including:

  • Borealis AG
  • Borouge PLC
  • Chevron Phillips Chemical Co.
  • Dow Chemical Co.
  • Exxon Mobil Corp.
  • Formosa Plastics Corp.
  • Hanwha Group
  • INEOS Group Holdings S.A.
  • LG Chem Ltd.
  • Lotte Chemical Corp.
  • LyondellBasell Industries N.V.
  • Mitsui Chemicals Inc.
  • NOVA Chemicals Corp.
  • PTT Global Chemical Public Co.
  • Reliance Industries Ltd.
  • Sasol Ltd.
  • Saudi Basic Industries
  • Sumitomo Chemical Co. Ltd.
  • TotalEnergies SE
  • Westlake Corp.

Qualitative and quantitative analysis of companies has been conducted to help clients understand the wider business environment as well as the strengths and weaknesses of key industry players. Data is qualitatively analyzed to categorize companies as pure play, category-focused, industry-focused, and diversified; it is quantitatively analyzed to categorize companies as dominant, leading, strong, tentative, and weak.

Recent Development and News in Linear low-density polyethylene (lldpe) market

  • In the Commodity Chemicals industry, the shift toward sustainable resource management has accelerated thermal pyrolysis recycling, directly impacting Linear Low-density Polyethylene (LLDPE) demand by enabling the production of mass-balance circular polymer for mono-material flexible structure and food-grade collation shrink packaging.
  • Stringent plastic waste mandates have spurred investments in post-consumer recyclate integration capabilities, forcing extruders to utilize high-performance silage wrap and heavy-duty shipping sack formulations blended with compatibilizers to maintain heat seal integrity and flex-crack mitigation.
  • Operational transformations driven by advanced process telemetry and automated form-fill-seal machinery optimization have improved chain-transfer agent dosing efficiency, boosting the production yield of agricultural mulch sheet and greenhouse cover membrane materials.
  • The transition toward high-barrier protection in transit logistics has escalated the adoption of multi-layer co-extrusion die technology, increasing the consumption of specialized resins for industrial pallet hood applications and rotomolded fluid container systems while ensuring intermodal transit stabilization.

Dive into Technavio’s robust research methodology, blending expert interviews, extensive data synthesis, and validated models for unparalleled Linear Low-Density Polyethylene (Lldpe) Market insights. See full methodology.

Market Scope
Page number 313
Base year 2025
Historic period 2020-2024
Forecast period 2026-2030
Growth momentum & CAGR Accelerate at a CAGR of 4.9%
Market growth 2026-2030 USD 12920.1 million
Market structure Fragmented
YoY growth 2025-2026(%) 4.7%
Key countries China, India, Japan, South Korea, Indonesia, Australia, US, Mexico, Canada, Germany, Italy, France, Spain, UK, The Netherlands, Turkey, Saudi Arabia, UAE, South Africa, Israel, Brazil, Argentina and Colombia
Competitive landscape Leading Companies, Market Positioning of Companies, Competitive Strategies, and Industry Risks

Request Free Sample

Research Analyst Overview

  • The continuous evolution of the Linear Low-density Polyethylene (LLDPE) landscape highlights a decisive shift toward precision-engineered polymer architectures designed to support aggressive package downgauging and mono-material recyclability. Advancements in metallocene catalyst architecture impart precise control over molecular structures, producing narrow molecular weight distributions and highly uniform short-chain branching.
  • This chemical consistency translates directly into a 30% improvement in dart drop impact resistance and puncture toughness compared to legacy resin formulations. Converters increasingly utilize these multimodal molecular architecture resins to mitigate rheological instability and melt fracture during high-throughput blown film extrusion.
  • In boardroom strategy, transitioning to these high-performance bimodal polyethylene grade materials allows manufacturers to comply with stringent statutory circularity criteria while preserving essential heat seal integrity. Furthermore, optimizing the melt flow index and seal initiation temperature enables faster processing speeds on automated packaging lines, lowering overall operational energy expenditure.
  • This strategic alignment of advanced Ziegler-Natta catalysis and environmental stress crack resistance ensures robust material performance across demanding industrial and consumer flexible packaging applications.

What are the Key Data Covered in this Linear Low-Density Polyethylene (Lldpe) Market Research and Growth Report?

  • What is the expected growth of the Linear Low-Density Polyethylene (Lldpe) Market between 2026 and 2030?

    • USD 12.92 billion, at a CAGR of 4.9%

  • What segmentation does the market report cover?

    • The report is segmented by Type (C4-LLDPE, C6-LLDPE, mLLDPE, and C8-LLDPE), End-user (Packaging, Agriculture, Construction, Automotive, and Others), Distribution Channel (Direct sale, and Indirect sale) and Geography (APAC, North America, Europe, Middle East and Africa, South America)

  • Which regions are analyzed in the report?

    • APAC, North America, Europe, Middle East and Africa and South America

  • What are the key growth drivers and market challenges?

    • Surging global demand for flexible food packaging, Structural feedstock disparities and depressed regional margins

  • Who are the major players in the Linear Low-Density Polyethylene (Lldpe) Market?

    • Borealis AG, Borouge PLC, Chevron Phillips Chemical Co., Dow Chemical Co., Exxon Mobil Corp., Formosa Plastics Corp., Hanwha Group, INEOS Group Holdings S.A., LG Chem Ltd., Lotte Chemical Corp., LyondellBasell Industries N.V., Mitsui Chemicals Inc., NOVA Chemicals Corp., PTT Global Chemical Public Co., Reliance Industries Ltd., Sasol Ltd., Saudi Basic Industries, Sumitomo Chemical Co. Ltd., TotalEnergies SE and Westlake Corp.

Market Research Insights

  • The Linear Low-density Polyethylene (LLDPE) Market demonstrates resilient operational expansion as converters transition toward high-performance mono-material flexible structure designs. Manufacturers deploying advanced process telemetry achieve a 20% improvement in reactor thermodynamic stability, minimizing unreacted monomer waste. Furthermore, incorporating post-consumer recyclate integration within heavy-duty shipping sack production has lowered raw material carbon footprints by 25% while maintaining critical tear resistance.
  • Upgrading to multi-layer co-extrusion die configurations allows industrial packaging facilities to reduce tie layer encapsulation thickness by 15%, directly lowering variable costs. This systemic optimization enables fabricators to produce superior collation shrink packaging and industrial pallet hood films that satisfy stringent circular economy mandates without sacrificing essential mechanical strength.

We can help! Our analysts can customize this linear low-density polyethylene (lldpe) market research report to meet your requirements.

Get in touch

1. Executive Summary

1.1 Market overview

Executive Summary - Chart on Market Overview
Executive Summary - Data Table on Market Overview
Executive Summary - Chart on Global Market Characteristics
Executive Summary - Chart on Market by Geography
Executive Summary - Chart on Market Segmentation by Type
Executive Summary - Chart on Market Segmentation by End-user
Executive Summary - Chart on Market Segmentation by Distribution Channel
Executive Summary - Chart on Incremental Growth
Executive Summary - Data Table on Incremental Growth
Executive Summary - Chart on Company Market Positioning

2. Technavio Analysis

2.1 Analysis of price sensitivity, lifecycle, customer purchase basket, adoption rates, and purchase criteria

2.2 Criticality of inputs and Factors of differentiation

Chart on Overview on criticality of inputs and factors of differentiation

2.3 Factors of disruption

Chart on Overview on factors of disruption

2.4 Impact of drivers and challenges

Chart on Impact of drivers and challenges in 2025 and 2030

3. Market Landscape

3.1 Market ecosystem

Chart on Parent Market
Data Table on - Parent Market

3.2 Market characteristics

Chart on Market characteristics analysis

3.3 Value chain analysis

Chart on Value chain analysis

4. Market Sizing

4.1 Market definition

Data Table on Offerings of companies included in the market definition

4.2 Market segment analysis

Market segments

4.3 Market size 2025

4.4 Market outlook: Forecast for 2025-2030

Chart on Global - Market size and forecast 2025-2030 ($ million)
Data Table on Global - Market size and forecast 2025-2030 ($ million)
Chart on Global Market: Year-over-year growth 2025-2030 (%)
Data Table on Global Market: Year-over-year growth 2025-2030 (%)

5. Historic Market Size

5.1 Global Linear Low-Density Polyethylene (LLDPE) Market 2020 - 2024

Historic Market Size - Data Table on Global Linear Low-Density Polyethylene (LLDPE) Market 2020 - 2024 ($ million)

5.2 Type segment analysis 2020 - 2024

Historic Market Size - Type Segment 2020 - 2024 ($ million)

5.3 End-user segment analysis 2020 - 2024

Historic Market Size - End-user Segment 2020 - 2024 ($ million)

5.4 Distribution Channel segment analysis 2020 - 2024

Historic Market Size - Distribution Channel Segment 2020 - 2024 ($ million)

5.5 Geography segment analysis 2020 - 2024

Historic Market Size - Geography Segment 2020 - 2024 ($ million)

5.6 Country segment analysis 2020 - 2024

Historic Market Size - Country Segment 2020 - 2024 ($ million)

6. Qualitative Analysis

6.1 Impact of AI on Global Linear Low-Density Polyethylene (LLDPE) Market

6.2 Impact of geopolitical conflicts on Global Linear Low-Density Polyethylene (LLDPE) Market

7. Five Forces Analysis

7.1 Five forces summary

Five forces analysis - Comparison between 2025 and 2030

7.2 Bargaining power of buyers

Bargaining power of buyers - Impact of key factors 2025 and 2030

7.3 Bargaining power of suppliers

Bargaining power of suppliers - Impact of key factors in 2025 and 2030

7.4 Threat of new entrants

Threat of new entrants - Impact of key factors in 2025 and 2030

7.5 Threat of substitutes

Threat of substitutes - Impact of key factors in 2025 and 2030

7.6 Threat of rivalry

Threat of rivalry - Impact of key factors in 2025 and 2030

7.7 Market condition

Chart on Market condition - Five forces 2025 and 2030

8. Market Segmentation by Type

8.1 Market segments

Chart on Type - Market share 2025-2030 (%)
Data Table on Type - Market share 2025-2030 (%)

8.2 Comparison by Type

Chart on Comparison by Type
Data Table on Comparison by Type

8.3 C4-LLDPE - Market size and forecast 2025-2030

Chart on C4-LLDPE - Market size and forecast 2025-2030 ($ million)
Data Table on C4-LLDPE - Market size and forecast 2025-2030 ($ million)
Chart on C4-LLDPE - Year-over-year growth 2025-2030 (%)
Data Table on C4-LLDPE - Year-over-year growth 2025-2030 (%)

8.4 C6-LLDPE - Market size and forecast 2025-2030

Chart on C6-LLDPE - Market size and forecast 2025-2030 ($ million)
Data Table on C6-LLDPE - Market size and forecast 2025-2030 ($ million)
Chart on C6-LLDPE - Year-over-year growth 2025-2030 (%)
Data Table on C6-LLDPE - Year-over-year growth 2025-2030 (%)

8.5 mLLDPE - Market size and forecast 2025-2030

Chart on mLLDPE - Market size and forecast 2025-2030 ($ million)
Data Table on mLLDPE - Market size and forecast 2025-2030 ($ million)
Chart on mLLDPE - Year-over-year growth 2025-2030 (%)
Data Table on mLLDPE - Year-over-year growth 2025-2030 (%)

8.6 C8-LLDPE - Market size and forecast 2025-2030

Chart on C8-LLDPE - Market size and forecast 2025-2030 ($ million)
Data Table on C8-LLDPE - Market size and forecast 2025-2030 ($ million)
Chart on C8-LLDPE - Year-over-year growth 2025-2030 (%)
Data Table on C8-LLDPE - Year-over-year growth 2025-2030 (%)

8.7 Market opportunity by Type

Market opportunity by Type ($ million)
Data Table on Market opportunity by Type ($ million)

9. Market Segmentation by End-user

9.1 Market segments

Chart on End-user - Market share 2025-2030 (%)
Data Table on End-user - Market share 2025-2030 (%)

9.2 Comparison by End-user

Chart on Comparison by End-user
Data Table on Comparison by End-user

9.3 Packaging - Market size and forecast 2025-2030

Chart on Packaging - Market size and forecast 2025-2030 ($ million)
Data Table on Packaging - Market size and forecast 2025-2030 ($ million)
Chart on Packaging - Year-over-year growth 2025-2030 (%)
Data Table on Packaging - Year-over-year growth 2025-2030 (%)

9.4 Agriculture - Market size and forecast 2025-2030

Chart on Agriculture - Market size and forecast 2025-2030 ($ million)
Data Table on Agriculture - Market size and forecast 2025-2030 ($ million)
Chart on Agriculture - Year-over-year growth 2025-2030 (%)
Data Table on Agriculture - Year-over-year growth 2025-2030 (%)

9.5 Construction - Market size and forecast 2025-2030

Chart on Construction - Market size and forecast 2025-2030 ($ million)
Data Table on Construction - Market size and forecast 2025-2030 ($ million)
Chart on Construction - Year-over-year growth 2025-2030 (%)
Data Table on Construction - Year-over-year growth 2025-2030 (%)

9.6 Automotive - Market size and forecast 2025-2030

Chart on Automotive - Market size and forecast 2025-2030 ($ million)
Data Table on Automotive - Market size and forecast 2025-2030 ($ million)
Chart on Automotive - Year-over-year growth 2025-2030 (%)
Data Table on Automotive - Year-over-year growth 2025-2030 (%)

9.7 Others - Market size and forecast 2025-2030

Chart on Others - Market size and forecast 2025-2030 ($ million)
Data Table on Others - Market size and forecast 2025-2030 ($ million)
Chart on Others - Year-over-year growth 2025-2030 (%)
Data Table on Others - Year-over-year growth 2025-2030 (%)

9.8 Market opportunity by End-user

Market opportunity by End-user ($ million)
Data Table on Market opportunity by End-user ($ million)

10. Market Segmentation by Distribution Channel

10.1 Market segments

Chart on Distribution Channel - Market share 2025-2030 (%)
Data Table on Distribution Channel - Market share 2025-2030 (%)

10.2 Comparison by Distribution Channel

Chart on Comparison by Distribution Channel
Data Table on Comparison by Distribution Channel

10.3 Direct sale - Market size and forecast 2025-2030

Chart on Direct sale - Market size and forecast 2025-2030 ($ million)
Data Table on Direct sale - Market size and forecast 2025-2030 ($ million)
Chart on Direct sale - Year-over-year growth 2025-2030 (%)
Data Table on Direct sale - Year-over-year growth 2025-2030 (%)

10.4 Indirect sale - Market size and forecast 2025-2030

Chart on Indirect sale - Market size and forecast 2025-2030 ($ million)
Data Table on Indirect sale - Market size and forecast 2025-2030 ($ million)
Chart on Indirect sale - Year-over-year growth 2025-2030 (%)
Data Table on Indirect sale - Year-over-year growth 2025-2030 (%)

10.5 Market opportunity by Distribution Channel

Market opportunity by Distribution Channel ($ million)
Data Table on Market opportunity by Distribution Channel ($ million)

11. Customer Landscape

11.1 Customer landscape overview

Analysis of price sensitivity, lifecycle, customer purchase basket, adoption rates, and purchase criteria

12. Geographic Landscape

12.1 Geographic segmentation

Chart on Market share by geography 2025-2030 (%)
Data Table on Market share by geography 2025-2030 (%)

12.2 Geographic comparison

Chart on Geographic comparison
Data Table on Geographic comparison

12.3 APAC - Market size and forecast 2025-2030

Chart on APAC - Market size and forecast 2025-2030 ($ million)
Data Table on APAC - Market size and forecast 2025-2030 ($ million)
Chart on APAC - Year-over-year growth 2025-2030 (%)
Data Table on APAC - Year-over-year growth 2025-2030 (%)
Chart on Regional Comparison - APAC
Data Table on Regional Comparison - APAC

12.3.1 China - Market size and forecast 2025-2030

Chart on China - Market size and forecast 2025-2030 ($ million)
Data Table on China - Market size and forecast 2025-2030 ($ million)
Chart on China - Year-over-year growth 2025-2030 (%)
Data Table on China - Year-over-year growth 2025-2030 (%)

12.3.2 India - Market size and forecast 2025-2030

Chart on India - Market size and forecast 2025-2030 ($ million)
Data Table on India - Market size and forecast 2025-2030 ($ million)
Chart on India - Year-over-year growth 2025-2030 (%)
Data Table on India - Year-over-year growth 2025-2030 (%)

12.3.3 Japan - Market size and forecast 2025-2030

Chart on Japan - Market size and forecast 2025-2030 ($ million)
Data Table on Japan - Market size and forecast 2025-2030 ($ million)
Chart on Japan - Year-over-year growth 2025-2030 (%)
Data Table on Japan - Year-over-year growth 2025-2030 (%)

12.3.4 South Korea - Market size and forecast 2025-2030

Chart on South Korea - Market size and forecast 2025-2030 ($ million)
Data Table on South Korea - Market size and forecast 2025-2030 ($ million)
Chart on South Korea - Year-over-year growth 2025-2030 (%)
Data Table on South Korea - Year-over-year growth 2025-2030 (%)

12.3.5 Indonesia - Market size and forecast 2025-2030

Chart on Indonesia - Market size and forecast 2025-2030 ($ million)
Data Table on Indonesia - Market size and forecast 2025-2030 ($ million)
Chart on Indonesia - Year-over-year growth 2025-2030 (%)
Data Table on Indonesia - Year-over-year growth 2025-2030 (%)

12.3.6 Australia - Market size and forecast 2025-2030

Chart on Australia - Market size and forecast 2025-2030 ($ million)
Data Table on Australia - Market size and forecast 2025-2030 ($ million)
Chart on Australia - Year-over-year growth 2025-2030 (%)
Data Table on Australia - Year-over-year growth 2025-2030 (%)

12.4 North America - Market size and forecast 2025-2030

Chart on North America - Market size and forecast 2025-2030 ($ million)
Data Table on North America - Market size and forecast 2025-2030 ($ million)
Chart on North America - Year-over-year growth 2025-2030 (%)
Data Table on North America - Year-over-year growth 2025-2030 (%)
Chart on Regional Comparison - North America
Data Table on Regional Comparison - North America

12.4.1 US - Market size and forecast 2025-2030

Chart on US - Market size and forecast 2025-2030 ($ million)
Data Table on US - Market size and forecast 2025-2030 ($ million)
Chart on US - Year-over-year growth 2025-2030 (%)
Data Table on US - Year-over-year growth 2025-2030 (%)

12.4.2 Mexico - Market size and forecast 2025-2030

Chart on Mexico - Market size and forecast 2025-2030 ($ million)
Data Table on Mexico - Market size and forecast 2025-2030 ($ million)
Chart on Mexico - Year-over-year growth 2025-2030 (%)
Data Table on Mexico - Year-over-year growth 2025-2030 (%)

12.4.3 Canada - Market size and forecast 2025-2030

Chart on Canada - Market size and forecast 2025-2030 ($ million)
Data Table on Canada - Market size and forecast 2025-2030 ($ million)
Chart on Canada - Year-over-year growth 2025-2030 (%)
Data Table on Canada - Year-over-year growth 2025-2030 (%)

12.5 Europe - Market size and forecast 2025-2030

Chart on Europe - Market size and forecast 2025-2030 ($ million)
Data Table on Europe - Market size and forecast 2025-2030 ($ million)
Chart on Europe - Year-over-year growth 2025-2030 (%)
Data Table on Europe - Year-over-year growth 2025-2030 (%)
Chart on Regional Comparison - Europe
Data Table on Regional Comparison - Europe

12.5.1 Germany - Market size and forecast 2025-2030

Chart on Germany - Market size and forecast 2025-2030 ($ million)
Data Table on Germany - Market size and forecast 2025-2030 ($ million)
Chart on Germany - Year-over-year growth 2025-2030 (%)
Data Table on Germany - Year-over-year growth 2025-2030 (%)

12.5.2 Italy - Market size and forecast 2025-2030

Chart on Italy - Market size and forecast 2025-2030 ($ million)
Data Table on Italy - Market size and forecast 2025-2030 ($ million)
Chart on Italy - Year-over-year growth 2025-2030 (%)
Data Table on Italy - Year-over-year growth 2025-2030 (%)

12.5.3 France - Market size and forecast 2025-2030

Chart on France - Market size and forecast 2025-2030 ($ million)
Data Table on France - Market size and forecast 2025-2030 ($ million)
Chart on France - Year-over-year growth 2025-2030 (%)
Data Table on France - Year-over-year growth 2025-2030 (%)

12.5.4 Spain - Market size and forecast 2025-2030

Chart on Spain - Market size and forecast 2025-2030 ($ million)
Data Table on Spain - Market size and forecast 2025-2030 ($ million)
Chart on Spain - Year-over-year growth 2025-2030 (%)
Data Table on Spain - Year-over-year growth 2025-2030 (%)

12.5.5 UK - Market size and forecast 2025-2030

Chart on UK - Market size and forecast 2025-2030 ($ million)
Data Table on UK - Market size and forecast 2025-2030 ($ million)
Chart on UK - Year-over-year growth 2025-2030 (%)
Data Table on UK - Year-over-year growth 2025-2030 (%)

12.5.6 The Netherlands - Market size and forecast 2025-2030

Chart on The Netherlands - Market size and forecast 2025-2030 ($ million)
Data Table on The Netherlands - Market size and forecast 2025-2030 ($ million)
Chart on The Netherlands - Year-over-year growth 2025-2030 (%)
Data Table on The Netherlands - Year-over-year growth 2025-2030 (%)

12.6 Middle East and Africa - Market size and forecast 2025-2030

Chart on Middle East and Africa - Market size and forecast 2025-2030 ($ million)
Data Table on Middle East and Africa - Market size and forecast 2025-2030 ($ million)
Chart on Middle East and Africa - Year-over-year growth 2025-2030 (%)
Data Table on Middle East and Africa - Year-over-year growth 2025-2030 (%)
Chart on Regional Comparison - Middle East and Africa
Data Table on Regional Comparison - Middle East and Africa

12.6.1 Turkey - Market size and forecast 2025-2030

Chart on Turkey - Market size and forecast 2025-2030 ($ million)
Data Table on Turkey - Market size and forecast 2025-2030 ($ million)
Chart on Turkey - Year-over-year growth 2025-2030 (%)
Data Table on Turkey - Year-over-year growth 2025-2030 (%)

12.6.2 Saudi Arabia - Market size and forecast 2025-2030

Chart on Saudi Arabia - Market size and forecast 2025-2030 ($ million)
Data Table on Saudi Arabia - Market size and forecast 2025-2030 ($ million)
Chart on Saudi Arabia - Year-over-year growth 2025-2030 (%)
Data Table on Saudi Arabia - Year-over-year growth 2025-2030 (%)

12.6.3 UAE - Market size and forecast 2025-2030

Chart on UAE - Market size and forecast 2025-2030 ($ million)
Data Table on UAE - Market size and forecast 2025-2030 ($ million)
Chart on UAE - Year-over-year growth 2025-2030 (%)
Data Table on UAE - Year-over-year growth 2025-2030 (%)

12.6.4 South Africa - Market size and forecast 2025-2030

Chart on South Africa - Market size and forecast 2025-2030 ($ million)
Data Table on South Africa - Market size and forecast 2025-2030 ($ million)
Chart on South Africa - Year-over-year growth 2025-2030 (%)
Data Table on South Africa - Year-over-year growth 2025-2030 (%)

12.6.5 Israel - Market size and forecast 2025-2030

Chart on Israel - Market size and forecast 2025-2030 ($ million)
Data Table on Israel - Market size and forecast 2025-2030 ($ million)
Chart on Israel - Year-over-year growth 2025-2030 (%)
Data Table on Israel - Year-over-year growth 2025-2030 (%)

12.7 South America - Market size and forecast 2025-2030

Chart on South America - Market size and forecast 2025-2030 ($ million)
Data Table on South America - Market size and forecast 2025-2030 ($ million)
Chart on South America - Year-over-year growth 2025-2030 (%)
Data Table on South America - Year-over-year growth 2025-2030 (%)
Chart on Regional Comparison - South America
Data Table on Regional Comparison - South America

12.7.1 Brazil - Market size and forecast 2025-2030

Chart on Brazil - Market size and forecast 2025-2030 ($ million)
Data Table on Brazil - Market size and forecast 2025-2030 ($ million)
Chart on Brazil - Year-over-year growth 2025-2030 (%)
Data Table on Brazil - Year-over-year growth 2025-2030 (%)

12.7.2 Argentina - Market size and forecast 2025-2030

Chart on Argentina - Market size and forecast 2025-2030 ($ million)
Data Table on Argentina - Market size and forecast 2025-2030 ($ million)
Chart on Argentina - Year-over-year growth 2025-2030 (%)
Data Table on Argentina - Year-over-year growth 2025-2030 (%)

12.7.3 Colombia - Market size and forecast 2025-2030

Chart on Colombia - Market size and forecast 2025-2030 ($ million)
Data Table on Colombia - Market size and forecast 2025-2030 ($ million)
Chart on Colombia - Year-over-year growth 2025-2030 (%)
Data Table on Colombia - Year-over-year growth 2025-2030 (%)

12.8 Market opportunity by geography

Market opportunity by geography ($ million)
Data Tables on Market opportunity by geography ($ million)

13. Drivers, Challenges, and Opportunity

13.1 Market drivers

Surging global demand for flexible food packaging
Agricultural modernization expanding advanced crop protection films
Catalyst innovations driving sustainable downgauged film development

13.2 Market challenges

Structural feedstock disparities and depressed regional margins
Escalating regulatory mandates governing plastic packaging waste
Chronic capacity oversupply disrupting international trade flows

13.3 Impact of drivers and challenges

Impact of drivers and challenges in 2025 and 2030

13.4 Market opportunities

Acceleration of circular polyethylene mechanical recycling streams
Advanced metallocene catalysis facilitating systematic downgauging
Digital orchestration transforming continuous polymerization operations

14. Competitive Landscape

14.1 Overview

14.2

Overview on criticality of inputs and factors of differentiation

14.3 Landscape disruption

Overview on factors of disruption

14.4 Industry risks

Impact of key risks on business

15. Competitive Analysis

15.1 Companies profiled

Companies covered

15.2 Company ranking index

15.3 Market positioning of companies

Matrix on companies position and classification

15.4 Borealis AG

Borealis AG - Overview
Borealis AG - Product / Service
Borealis AG - Key offerings
SWOT

15.5 Borouge PLC

Borouge PLC - Overview
Borouge PLC - Product / Service
Borouge PLC - Key offerings
SWOT

15.6 Chevron Phillips Chemical Co.

Chevron Phillips Chemical Co. - Overview
Chevron Phillips Chemical Co. - Product / Service
Chevron Phillips Chemical Co. - Key offerings
SWOT

15.7 Dow Chemical Co.

Dow Chemical Co. - Overview
Dow Chemical Co. - Business segments
Dow Chemical Co. - Key news
Dow Chemical Co. - Key offerings
Dow Chemical Co. - Segment focus
SWOT

15.8 Formosa Plastics Corp.

Formosa Plastics Corp. - Overview
Formosa Plastics Corp. - Product / Service
Formosa Plastics Corp. - Key offerings
SWOT

15.9 Hanwha Group

Hanwha Group - Overview
Hanwha Group - Business segments
Hanwha Group - Key offerings
Hanwha Group - Segment focus
SWOT

15.10 LG Chem Ltd.

LG Chem Ltd. - Overview
LG Chem Ltd. - Business segments
LG Chem Ltd. - Key news
LG Chem Ltd. - Key offerings
LG Chem Ltd. - Segment focus
SWOT

15.11 Lotte Chemical Corp.

Lotte Chemical Corp. - Overview
Lotte Chemical Corp. - Business segments
Lotte Chemical Corp. - Key offerings
Lotte Chemical Corp. - Segment focus
SWOT

15.12 Mitsui Chemicals Inc.

Mitsui Chemicals Inc. - Overview
Mitsui Chemicals Inc. - Business segments
Mitsui Chemicals Inc. - Key offerings
Mitsui Chemicals Inc. - Segment focus
SWOT

15.13 NOVA Chemicals Corp.

NOVA Chemicals Corp. - Overview
NOVA Chemicals Corp. - Product / Service
NOVA Chemicals Corp. - Key offerings
SWOT

15.14 PTT Global Chemical Public Co.

PTT Global Chemical Public Co. - Overview
PTT Global Chemical Public Co. - Business segments
PTT Global Chemical Public Co. - Key offerings
PTT Global Chemical Public Co. - Segment focus
SWOT

15.15 Reliance Industries Ltd.

Reliance Industries Ltd. - Overview
Reliance Industries Ltd. - Business segments
Reliance Industries Ltd. - Key offerings
Reliance Industries Ltd. - Segment focus
SWOT

15.16 Saudi Basic Industries

Saudi Basic Industries - Overview
Saudi Basic Industries - Business segments
Saudi Basic Industries - Key offerings
Saudi Basic Industries - Segment focus
SWOT

15.17 TotalEnergies SE

TotalEnergies SE - Overview
TotalEnergies SE - Business segments
TotalEnergies SE - Key news
TotalEnergies SE - Key offerings
TotalEnergies SE - Segment focus
SWOT

15.18 Westlake Corp.

Westlake Corp. - Overview
Westlake Corp. - Business segments
Westlake Corp. - Key offerings
Westlake Corp. - Segment focus
SWOT

16. Appendix

16.1 Scope of the report

Market definition
Objectives
Notes and caveats

16.2 Inclusions and exclusions checklist

Inclusions checklist
Exclusions checklist

16.3 Currency conversion rates for US$

16.4 Research methodology

16.5 Data procurement

Information sources

16.6 Data validation

16.7 Validation techniques employed for market sizing

16.8 Data synthesis

16.9 360 degree market analysis

16.10 List of abbreviations

Research Methodology

Technavio presents a detailed picture of the market by way of study, synthesis, and summation of data from multiple sources. The analysts have presented the various facets of the market with a particular focus on identifying the key industry influencers. The data thus presented is comprehensive, reliable, and the result of extensive research, both primary and secondary.

INFORMATION SOURCES

Primary sources

  • Manufacturers and suppliers
  • Channel partners
  • Industry experts
  • Strategic decision makers

Secondary sources

  • Industry journals and periodicals
  • Government data
  • Financial reports of key industry players
  • Historical data
  • Press releases

DATA ANALYSIS

Data Synthesis

  • Collation of data
  • Estimation of key figures
  • Analysis of derived insights

Data Validation

  • Triangulation with data models
  • Reference against proprietary databases
  • Corroboration with industry experts

REPORT WRITING

Qualitative

  • Market drivers
  • Market challenges
  • Market trends
  • Five forces analysis

Quantitative

  • Market size and forecast
  • Market segmentation
  • Geographical insights
  • Competitive landscape

Interested in this report?

Get your sample now to see our research methodology and insights!

Download Now

Frequently Asked Questions

Linear Low-Density Polyethylene (Lldpe) market growth will increase by USD 12920.1 million during 2026-2030.

The Linear Low-Density Polyethylene (Lldpe) market is expected to grow at a CAGR of 4.9% during 2026-2030.

Linear Low-Density Polyethylene (Lldpe) market is segmented by Type (C4-LLDPE, C6-LLDPE, mLLDPE, C8-LLDPE) End-user (Packaging, Agriculture, Construction, Automotive, Others) Distribution channel (Direct sale, Indirect sale)

Borealis AG, Borouge PLC, Chevron Phillips Chemical Co., Dow Chemical Co., Exxon Mobil Corp., Formosa Plastics Corp., Hanwha Group, INEOS Group Holdings S.A., LG Chem Ltd., Lotte Chemical Corp., LyondellBasell Industries N.V., Mitsui Chemicals Inc., NOVA Chemicals Corp., PTT Global Chemical Public Co., Reliance Industries Ltd., Sasol Ltd., Saudi Basic Industries, Sumitomo Chemical Co. Ltd., TotalEnergies SE, Westlake Corp. are a few of the key vendors in the Linear Low-Density Polyethylene (Lldpe) market.

APAC will register the highest growth rate of 57.7% among the other regions. Therefore, the Linear Low-Density Polyethylene (Lldpe) market in APAC is expected to garner significant business opportunities for the vendors during the forecast period.

China, India, Japan, South Korea, Indonesia, Australia, US, Mexico, Canada, Germany, Italy, France, Spain, UK, The Netherlands, Turkey, Saudi Arabia, UAE, South Africa, Israel, Brazil, Argentina, Colombia

  • Surging global demand for flexible food packaging is the driving factor this market.

The Linear Low-Density Polyethylene (Lldpe) market vendors should focus on grabbing business opportunities from the Type segment as it accounted for the largest market share in the base year.
RIA - Research AI Assistant
Ask RIA