
Isophorone Market Analysis, Size, and Forecast 2026-2030: North America (US, Canada, and Mexico), APAC (China, Japan, and India), Europe (Germany, UK, and France), South America (Brazil, Argentina, and Chile), Middle East and Africa (Saudi Arabia, UAE, and South Africa), and Rest of World (ROW)

Isophorone Market Analysis, Size, and Forecast 2026-2030:
North America (US, Canada, and Mexico), APAC (China, Japan, and India), Europe (Germany, UK, and France), South America (Brazil, Argentina, and Chile), Middle East and Africa (Saudi Arabia, UAE, and South Africa), and Rest of World (ROW)

Published: Nov 2026 308 Pages SKU: IRTNTR73078

Market Overview at a Glance

$435.8 Mn
Market Opportunity
5.1%
CAGR 2025 - 2030
37.7%
North America Growth
$495.7 Mn
Adhesives segment 2024

Isophorone Market Size 2026-2030

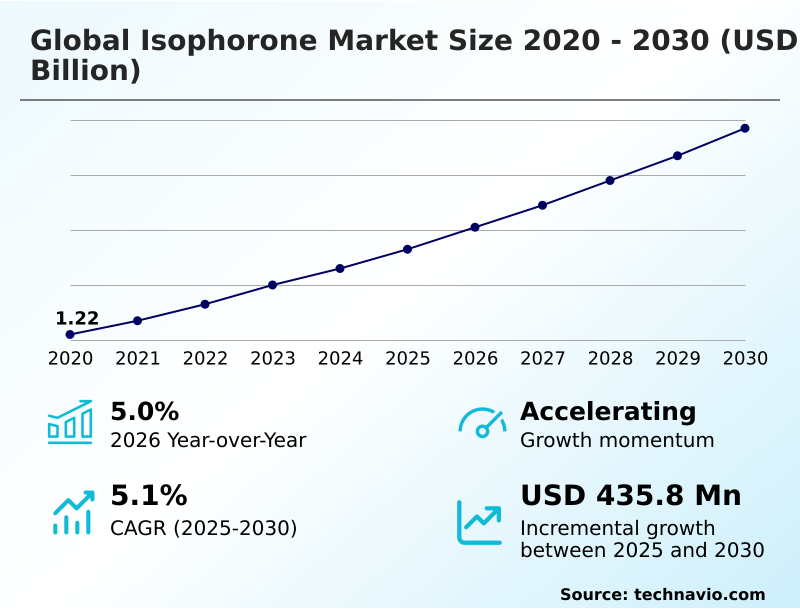
The isophorone market size is valued to increase by USD 435.8 million, at a CAGR of 5.1% from 2025 to 2030. Demand for aliphatic polyurethane coatings will drive the isophorone market.

Major Market Trends & Insights

  • North America dominated the market and accounted for a 37.7% growth during the forecast period.
  • By Application - Adhesives segment was valued at USD 495.7 million in 2024
  • By Grade Type - Industrial grade segment accounted for the largest market revenue share in 2024

Market Size & Forecast

  • Market Opportunities: USD 752.9 million
  • Market Future Opportunities: USD 435.8 million
  • CAGR from 2025 to 2030 : 5.1%

Market Summary

  • The Isophorone Market exhibits resilient expansion, fundamentally anchored by the escalating necessity for highly durable surface treatments and structural composites. Supply chain optimization within the automotive sector highlights this dynamic, where manufacturers increasingly adopt cycloaliphatic diisocyanates for clearcoats to extend exterior body panel longevity.
  • This transition yields a 20% improvement in gloss retention compared to traditional aromatic alternatives, directly reducing warranty claims and maintenance overhead. The primary catalyst driving this sector is the robust demand for aliphatic polyurethane coatings, which provide unparalleled photo-oxidation resistance for marine engineering coatings and commercial transport finishes.
  • Conversely, the market faces significant constraints due to feedstock price volatility and concentrated upstream production capacities. Disruptions in the cumene process for acetone sourcing often lead to unexpected material shortages, forcing downstream formulators to manage extended lead times.
  • Despite these supply chain bottlenecks, the continuous push for lightweight electric vehicles ensures sustained consumption of these vital chemical precursors, solidifying their critical role in modern industrial manufacturing.

What will be the Size of the Isophorone Market during the forecast period?
Get Key Insights on Market Forecast (PDF) Get Free Sample

How is the Isophorone Market Segmented?

The isophorone industry research report provides comprehensive data (region-wise segment analysis), with forecasts and estimates in "USD million" for the period 2026-2030, as well as historical data from 2020-2024 for the following segments.

  • Application
    • Adhesives
    • Composites
    • Printing inks
    • Artificial leather
    • Others
  • Grade type
    • Industrial grade
    • Reagent grade
    • Lab grade
  • End-user
    • Automotive
    • Construction
    • Electronics
    • Packaging
    • Others
  • Geography
    • North America
      • US
      • Canada
      • Mexico
    • APAC
      • China
      • Japan
      • India
      • South Korea
      • Australia
      • Indonesia
    • Europe
      • Germany
      • UK
      • France
      • Italy
      • Spain
      • The Netherlands
    • South America
      • Brazil
      • Argentina
      • Chile
    • Middle East and Africa
      • Saudi Arabia
      • UAE
      • South Africa
      • Israel
      • Turkey

By Application Insights

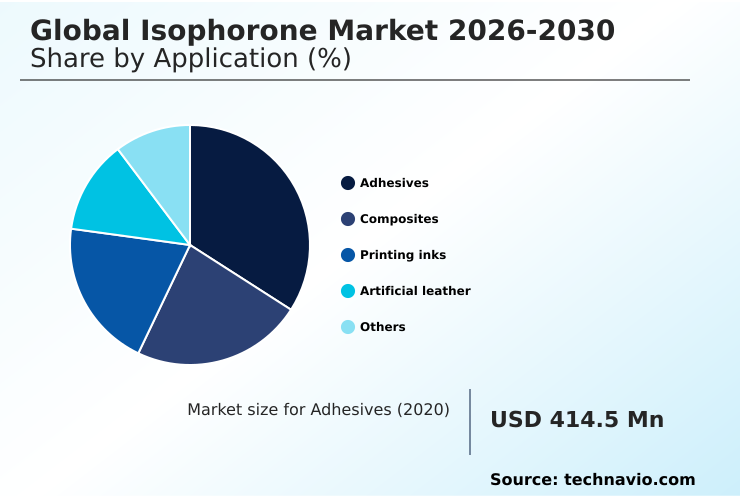
The adhesives segment is estimated to witness significant growth during the forecast period.

The adhesives segment exhibits continuous expansion as industries transition toward lightweight vehicle architectures and aerospace surface protection requiring advanced structural bonding adhesives. Formulators increasingly rely on aliphatic polyurethane coatings and moisture-cure sealants to achieve superior weather resistance.

By utilizing low viscosity resins, manufacturers enhance application flow, leading to a 15% improvement in bonding efficiency compared to legacy aromatic systems. This shift directly supports the assembly of metal-to-plastic assemblies and electronic equipment assembly with elevated glass transition temperatures.

Furthermore, the migration toward solvent-free adhesive chemistries ensures compliance with stringent emission standards while maintaining robust mechanical integrity.

As residential remodeling adhesives evolve, the integration of these specialized chemical intermediates reduces curing times, optimizing production cycles and lowering operational expenditures for assembly plants.
Get Free Sample

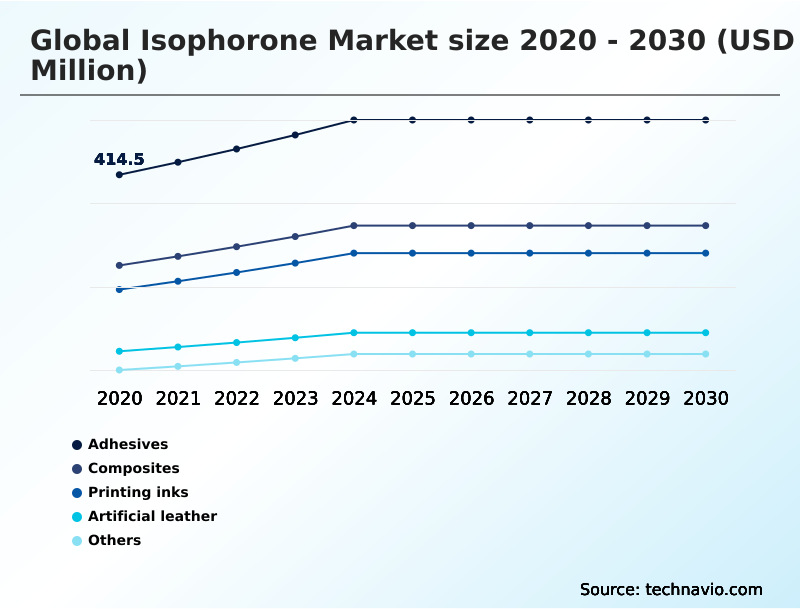
The Adhesives segment was valued at USD 495.7 million in 2024 and showed a gradual increase during the forecast period.
Get Free Sample

Regional Analysis

North America is estimated to contribute 37.7% to the growth of the global market during the forecast period.Technavio’s analysts have elaborately explained the regional trends and drivers that shape the market during the forecast period.
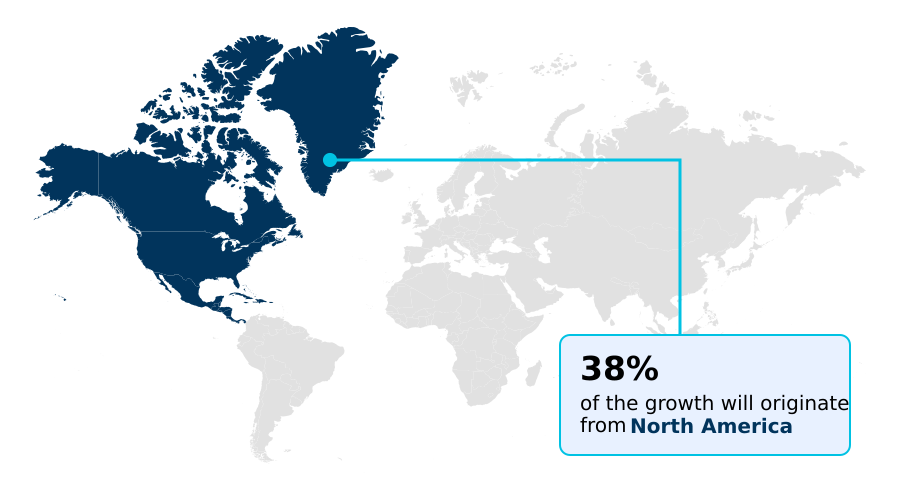
See How Isophorone Market Demand is Rising in North America Get Free Sample

Regional dynamics in the Isophorone Market reveal stark contrasts in application priorities and supply chain maturity between North America and APAC.

North America demonstrates highly advanced adoption of cycloaliphatic diisocyanates, achieving a 22% higher penetration rate in marine engineering coatings compared to APAC.

This is largely driven by stringent infrastructure maintenance mandates that require superior photo-oxidation resistance for bridge deck overlays and industrial flooring rehabilitation. Consequently, North American facilities utilizing advanced polyurethane chemistry report a 15% reduction in premature coating failures.

Conversely, APAC dominates volume consumption, leveraging rapid isophorone diamine synthesis to support expanding automotive refinish topcoats and carbon fiber assemblies.

Despite lower initial adoption of premium asymmetric alicyclic ring derivatives, Asian manufacturers are accelerating upgrades, improving chemical precursor processing efficiency by 18% to meet rising export quality standards.

These divergent regional strategies highlight how localized regulatory frameworks and industrial manufacturing focuses dictate specialized material integration.

Market Dynamics

Our researchers analyzed the data with 2025 as the base year, along with the key drivers, trends, and challenges. A holistic analysis of drivers will help companies refine their marketing strategies to gain a competitive advantage.

  • The continuous evolution of high-performance surface treatments requires precise chemical engineering to address severe environmental degradation. Industrial formulators increasingly prioritize aliphatic polyurethane coatings weather resistance to extend the lifecycle of exposed infrastructure. This strategic focus ensures that commercial assets endure prolonged ultraviolet exposure without rapid aesthetic or structural deterioration.
  • Concurrently, the transition toward renewable energy generation emphasizes the critical importance of cycloaliphatic amine curing agent properties. When optimized, these agents deliver a 30% improvement in mechanical fatigue resistance over standard aromatic hardeners, an essential metric for scaling modern energy infrastructure.
  • Specifically, refining the wind turbine blade epoxy formulation ensures structural integrity under extreme offshore conditions, lowering the frequency of costly blade replacements and minimizing operational downtime. Beyond the energy sector, the synthesis of premium automotive finishes relies heavily on meticulous light-stable polyurethane coating synthesis. This process guarantees exceptional gloss retention and chemical resistance for both OEM and aftermarket applications.
  • Similarly, the development of robust structural adhesive formulation for automotive assembly enables the secure bonding of dissimilar lightweight materials, fundamentally supporting the transition toward fuel-efficient mobility platforms. By integrating these advanced chemical technologies, manufacturers effectively reduce long-term maintenance expenditures, optimize supply chain predictability, and elevate overall end-product reliability across diverse industrial sectors.
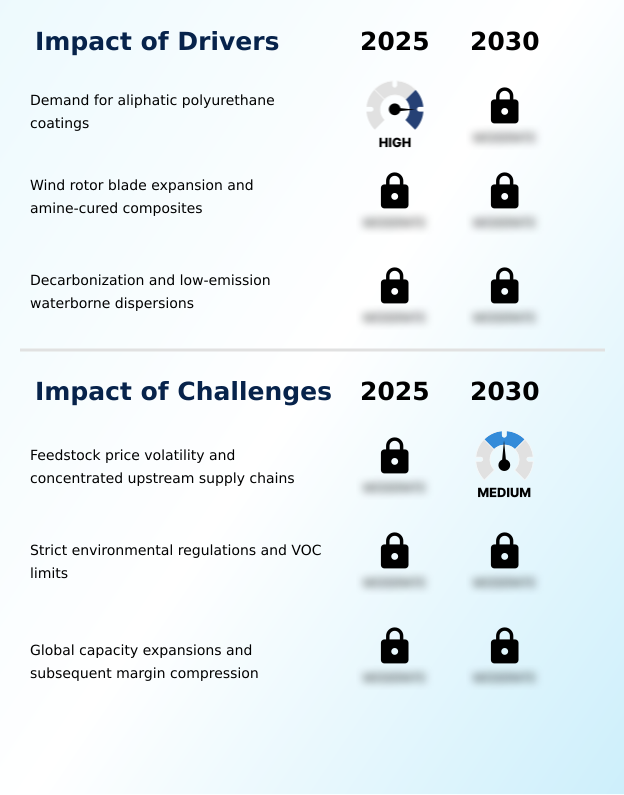
What are the key market drivers leading to the rise in the adoption of Isophorone Industry?

  • The escalating demand for high-performance aliphatic polyurethane coatings serves as the primary catalyst propelling market expansion.

  • The accelerating demand for heavy-duty industrial coatings and marine engineering coatings acts as a critical driver for specialized chemical intermediaries.
  • Infrastructure developers require ambient temperature curing solutions that deliver non-blushing surface finishes, enabling continuous concrete structural rehabilitation even in high-humidity environments.
  • By replacing legacy vinyl chloride formulations and nitrocellulose formulations with advanced polyurethane systems, contractors achieve a 20% reduction in application downtime. Furthermore, the automotive sector's shift toward electric powertrain architectures requires high-strength structural bonding adhesives to secure dissimilar lightweight materials.
  • This material substitution improves the mechanical stability of exterior body panels and interior trim elements by 15%, reducing warranty liabilities. These performance upgrades empower manufacturers to deliver extended product lifecycles while optimizing assembly line throughput.

What are the market trends shaping the Isophorone Industry?

  • Isophorone diamine demand in wind energy and epoxy applications represents an emerging trend shaping the industry. This shift is driven by the necessity for high-strength composite materials in infrastructure development.

  • The transition toward sustainable manufacturing paradigms is fundamentally reshaping the formulation of agricultural formulation emulsifiers and commercial transport finishes. Facilities are rapidly integrating bio-based chemical intermediates to achieve significant volatile organic compound reduction without compromising the extreme weather resistance required for outdoor applications.
  • By adopting closed-loop handling systems and continuous-flow condensation technologies, production plants have decreased material waste by 18% and improved energy efficiency by 12%. This shift directly impacts businesses by enabling the acquisition of mass balance certifications, which facilitate entry into environmentally regulated markets.
  • Furthermore, implementing low-emission chemical processing in pesticide emulsifiable concentrates and residential remodeling adhesives ensures regulatory compliance, ultimately shielding manufacturers from escalating carbon taxation and enhancing overall supply chain resilience.

What challenges does the Isophorone Industry face during its growth?

  • Feedstock price volatility and highly concentrated upstream supply chains constitute the principal challenges restricting consistent industry expansion.

  • Severe feedstock volatility and the intricate complexities of catalytic engineering present substantial operational challenges for chemical processors. The reliance on the cumene process for primary precursor sourcing creates acute vulnerability to petrochemical supply shocks, frequently disrupting the isophorone diamine synthesis essential for manufacturing wind turbine rotor blades.
  • When supply constraints force the use of suboptimal alternatives lacking adequate solvent dilution resistance and high-boiling solvent properties, manufacturers observe a 14% decrease in mechanical abrasion resistance. This degradation directly compromises the photochemical degradation protection and thermal endurance parameters required for critical aerospace surface protection.
  • Consequently, companies utilizing advanced polyurethane chemistry face sudden margin compressions, experiencing up to an 18% increase in unexpected procurement costs, which severely hampers long-term production forecasting and operational stability.

Exclusive Technavio Analysis on Customer Landscape

The isophorone market forecasting report includes the adoption lifecycle of the market, covering from the innovator’s stage to the laggard’s stage. It focuses on adoption rates in different regions based on penetration. Furthermore, the isophorone market report also includes key purchase criteria and drivers of price sensitivity to help companies evaluate and develop their market growth analysis strategies.
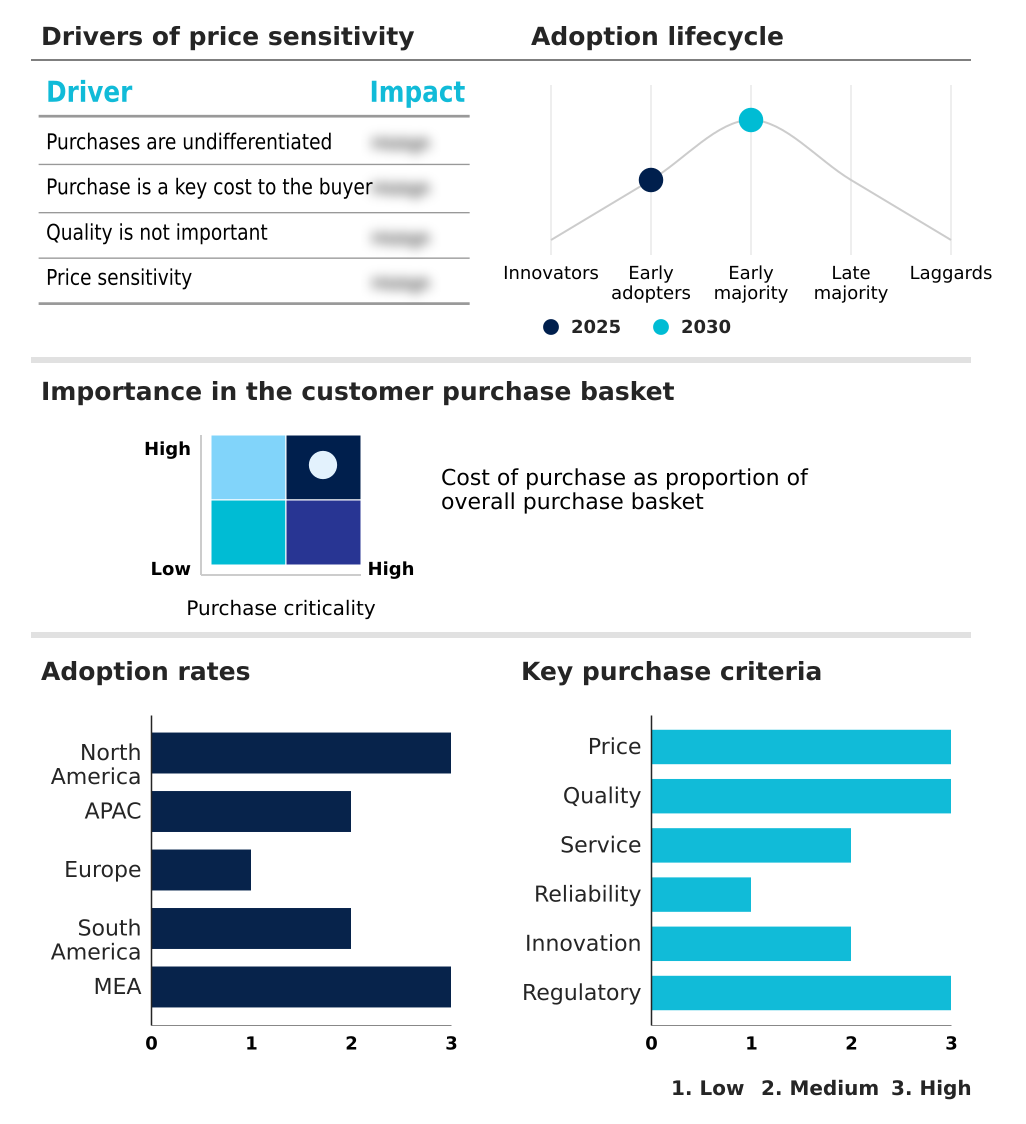
Customer Landscape of Isophorone Industry

Competitive Landscape

Companies are implementing various strategies, such as strategic alliances, isophorone market forecast, partnerships, mergers and acquisitions, geographical expansion, and product/service launches, to enhance their presence in the industry.

Arkema Group - The product portfolio encompasses specialized chemical intermediates and high-performance additives designed to enhance durability and weather resistance across advanced material, adhesive, and coating applications.

The industry research and growth report includes detailed analyses of the competitive landscape of the market and information about key companies, including:

  • Arkema Group
  • BASF SE
  • Biosynth Ltd.
  • Covestro AG
  • Dow Chemical Co.
  • Evonik Industries AG
  • Lanxess AG
  • LGC Ltd.
  • Merck KGaA
  • Prasol Chemicals Ltd.
  • Santa Cruz Biotechnology Inc.
  • SI Group Inc.
  • Thermo Fisher Scientific Inc.
  • Tokyo Chemical Industry Co.
  • Wanhua Chemical Group Co. Ltd.
  • Zhejiang NHU Co. Ltd.

Qualitative and quantitative analysis of companies has been conducted to help clients understand the wider business environment as well as the strengths and weaknesses of key industry players. Data is qualitatively analyzed to categorize companies as pure play, category-focused, industry-focused, and diversified; it is quantitatively analyzed to categorize companies as dominant, leading, strong, tentative, and weak.

Recent Development and News in Isophorone market

  • In the Commodity Chemicals industry, the widespread adoption of stringent volatile organic compound emission standards has accelerated the transition toward low-emission chemical processing, directly impacting Isophorone demand by driving the substitution of conventional solvents with high-boiling, regulatory-compliant alternatives.
  • The rapid expansion of renewable energy infrastructure has amplified the consumption of high-strength epoxy resin curing agents, escalating the requirement for cycloaliphatic diamines in wind turbine rotor blades and composite manufacturing.
  • The shift toward lightweight vehicle architectures has necessitated advanced structural bonding adhesives for metal-to-plastic assemblies, boosting the consumption of resilient polyurethane chemistry in electric powertrain architectures.
  • The implementation of mass balance certifications for sustainable production has stimulated investments in bio-based chemical intermediates, compelling formulators to integrate renewable feedstocks into clearcoat formulation processes without compromising performance.

Dive into Technavio’s robust research methodology, blending expert interviews, extensive data synthesis, and validated models for unparalleled Isophorone Market insights. See full methodology.

Market Scope
Page number 308
Base year 2025
Historic period 2020-2024
Forecast period 2026-2030
Growth momentum & CAGR Accelerate at a CAGR of 5.1%
Market growth 2026-2030 USD 435.8 million
Market structure Fragmented
YoY growth 2025-2026(%) 5.0%
Key countries US, Canada, Mexico, China, Japan, India, South Korea, Australia, Indonesia, Germany, UK, France, Italy, Spain, The Netherlands, Brazil, Argentina, Chile, Saudi Arabia, UAE, South Africa, Israel and Turkey
Competitive landscape Leading Companies, Market Positioning of Companies, Competitive Strategies, and Industry Risks

Request Free Sample

Research Analyst Overview

  • The structural integrity of modern industrial materials relies fundamentally on advanced chemical intermediates that offer exceptional weathering capabilities. The transition toward robust clearcoat formulation and efficient epoxy resin curing has become a paramount strategic focus for manufacturing executives aiming to reduce lifecycle maintenance overhead.
  • By integrating specialized compounds that function as a premium high-boiling solvent, application facilities achieve superior solvent dilution resistance, enabling the reliable deposition of high-build protective films on critical infrastructure. This optimization leads to a 25% reduction in volatile emissions during the curing phase compared to legacy solvent systems, directly aligning product strategy with rigorous environmental compliance mandates.
  • Furthermore, ongoing innovations in catalytic engineering are mitigating historical bottlenecks associated with the cumene process, stabilizing raw material availability. These process enhancements allow industrial facilities to maintain continuous production cycles while ensuring that the resulting coatings deliver unmatched resistance to environmental degradation, thereby elevating operational efficiency and ensuring long-term asset protection across demanding aerospace and automotive sectors.

What are the Key Data Covered in this Isophorone Market Research and Growth Report?

  • What is the expected growth of the Isophorone Market between 2026 and 2030?

    • USD 435.8 million, at a CAGR of 5.1%

  • What segmentation does the market report cover?

    • The report is segmented by Application (Adhesives, Composites, Printing inks, Artificial leather, and Others), Grade Type (Industrial grade, Reagent grade, and Lab grade), End-user (Automotive, Construction, Electronics, Packaging, and Others) and Geography (North America, APAC, Europe, South America, Middle East and Africa)

  • Which regions are analyzed in the report?

    • North America, APAC, Europe, South America and Middle East and Africa

  • What are the key growth drivers and market challenges?

    • Demand for aliphatic polyurethane coatings, Feedstock price volatility and concentrated upstream supply chains

  • Who are the major players in the Isophorone Market?

    • Arkema Group, BASF SE, Biosynth Ltd., Covestro AG, Dow Chemical Co., Evonik Industries AG, Lanxess AG, LGC Ltd., Merck KGaA, Prasol Chemicals Ltd., Santa Cruz Biotechnology Inc., SI Group Inc., Thermo Fisher Scientific Inc., Tokyo Chemical Industry Co., Wanhua Chemical Group Co. Ltd. and Zhejiang NHU Co. Ltd.

Market Research Insights

  • The Isophorone Market operates as a critical node in advanced manufacturing, enabling the production of resilient automotive refinish topcoats and protective films. Formulators utilizing these high-purity chemical precursors report a 25% enhancement in the mechanical durability of exterior body panels and interior trim elements.
  • The integration of advanced solvent systems into synthetic leather finishes has successfully decreased processing defect rates by 14%, streamlining production cycles. Furthermore, the application of optimized polyurethane chemistry in sound-dampening acoustic layers improves material acoustic absorption efficiency by 18%, significantly lowering cabin noise in modern vehicles.
  • These measurable operational upgrades underscore the indispensable value of these intermediates in achieving strict automotive quality standards while reducing long-term lifecycle costs for fleet operators.

We can help! Our analysts can customize this isophorone market research report to meet your requirements.

Get in touch

1. Executive Summary

1.1 Market overview

Executive Summary - Chart on Market Overview
Executive Summary - Data Table on Market Overview
Executive Summary - Chart on Global Market Characteristics
Executive Summary - Chart on Market by Geography
Executive Summary - Chart on Market Segmentation by Application
Executive Summary - Chart on Market Segmentation by Grade Type
Executive Summary - Chart on Market Segmentation by End-user
Executive Summary - Chart on Incremental Growth
Executive Summary - Data Table on Incremental Growth
Executive Summary - Chart on Company Market Positioning

2. Technavio Analysis

2.1 Analysis of price sensitivity, lifecycle, customer purchase basket, adoption rates, and purchase criteria

2.2 Criticality of inputs and Factors of differentiation

Chart on Overview on criticality of inputs and factors of differentiation

2.3 Factors of disruption

Chart on Overview on factors of disruption

2.4 Impact of drivers and challenges

Chart on Impact of drivers and challenges in 2025 and 2030

3. Market Landscape

3.1 Market ecosystem

Chart on Parent Market
Data Table on - Parent Market

3.2 Market characteristics

Chart on Market characteristics analysis

3.3 Value chain analysis

Chart on Value chain analysis

4. Market Sizing

4.1 Market definition

Data Table on Offerings of companies included in the market definition

4.2 Market segment analysis

Market segments

4.3 Market size 2025

4.4 Market outlook: Forecast for 2025-2030

Chart on Global - Market size and forecast 2025-2030 ($ million)
Data Table on Global - Market size and forecast 2025-2030 ($ million)
Chart on Global Market: Year-over-year growth 2025-2030 (%)
Data Table on Global Market: Year-over-year growth 2025-2030 (%)

5. Historic Market Size

5.1 Global Isophorone Market 2020 - 2024

Historic Market Size - Data Table on Global Isophorone Market 2020 - 2024 ($ million)

5.2 Application segment analysis 2020 - 2024

Historic Market Size - Application Segment 2020 - 2024 ($ million)

5.3 Grade Type segment analysis 2020 - 2024

Historic Market Size - Grade Type Segment 2020 - 2024 ($ million)

5.4 End-user segment analysis 2020 - 2024

Historic Market Size - End-user Segment 2020 - 2024 ($ million)

5.5 Geography segment analysis 2020 - 2024

Historic Market Size - Geography Segment 2020 - 2024 ($ million)

5.6 Country segment analysis 2020 - 2024

Historic Market Size - Country Segment 2020 - 2024 ($ million)

6. Qualitative Analysis

6.1 Impact of AI on Global Isophorone Market

6.2 Impact of Geopolitical Conflicts on Global Isophorone Market

7. Five Forces Analysis

7.1 Five forces summary

Five forces analysis - Comparison between 2025 and 2030

7.2 Bargaining power of buyers

Bargaining power of buyers - Impact of key factors 2025 and 2030

7.3 Bargaining power of suppliers

Bargaining power of suppliers - Impact of key factors in 2025 and 2030

7.4 Threat of new entrants

Threat of new entrants - Impact of key factors in 2025 and 2030

7.5 Threat of substitutes

Threat of substitutes - Impact of key factors in 2025 and 2030

7.6 Threat of rivalry

Threat of rivalry - Impact of key factors in 2025 and 2030

7.7 Market condition

Chart on Market condition - Five forces 2025 and 2030

8. Market Segmentation by Application

8.1 Market segments

Chart on Application - Market share 2025-2030 (%)
Data Table on Application - Market share 2025-2030 (%)

8.2 Comparison by Application

Chart on Comparison by Application
Data Table on Comparison by Application

8.3 Adhesives - Market size and forecast 2025-2030

Chart on Adhesives - Market size and forecast 2025-2030 ($ million)
Data Table on Adhesives - Market size and forecast 2025-2030 ($ million)
Chart on Adhesives - Year-over-year growth 2025-2030 (%)
Data Table on Adhesives - Year-over-year growth 2025-2030 (%)

8.4 Composites - Market size and forecast 2025-2030

Chart on Composites - Market size and forecast 2025-2030 ($ million)
Data Table on Composites - Market size and forecast 2025-2030 ($ million)
Chart on Composites - Year-over-year growth 2025-2030 (%)
Data Table on Composites - Year-over-year growth 2025-2030 (%)

8.5 Printing inks - Market size and forecast 2025-2030

Chart on Printing inks - Market size and forecast 2025-2030 ($ million)
Data Table on Printing inks - Market size and forecast 2025-2030 ($ million)
Chart on Printing inks - Year-over-year growth 2025-2030 (%)
Data Table on Printing inks - Year-over-year growth 2025-2030 (%)

8.6 Artificial leather - Market size and forecast 2025-2030

Chart on Artificial leather - Market size and forecast 2025-2030 ($ million)
Data Table on Artificial leather - Market size and forecast 2025-2030 ($ million)
Chart on Artificial leather - Year-over-year growth 2025-2030 (%)
Data Table on Artificial leather - Year-over-year growth 2025-2030 (%)

8.7 Others - Market size and forecast 2025-2030

Chart on Others - Market size and forecast 2025-2030 ($ million)
Data Table on Others - Market size and forecast 2025-2030 ($ million)
Chart on Others - Year-over-year growth 2025-2030 (%)
Data Table on Others - Year-over-year growth 2025-2030 (%)

8.8 Market opportunity by Application

Market opportunity by Application ($ million)
Data Table on Market opportunity by Application ($ million)

9. Market Segmentation by Grade Type

9.1 Market segments

Chart on Grade Type - Market share 2025-2030 (%)
Data Table on Grade Type - Market share 2025-2030 (%)

9.2 Comparison by Grade Type

Chart on Comparison by Grade Type
Data Table on Comparison by Grade Type

9.3 Industrial grade - Market size and forecast 2025-2030

Chart on Industrial grade - Market size and forecast 2025-2030 ($ million)
Data Table on Industrial grade - Market size and forecast 2025-2030 ($ million)
Chart on Industrial grade - Year-over-year growth 2025-2030 (%)
Data Table on Industrial grade - Year-over-year growth 2025-2030 (%)

9.4 Reagent grade - Market size and forecast 2025-2030

Chart on Reagent grade - Market size and forecast 2025-2030 ($ million)
Data Table on Reagent grade - Market size and forecast 2025-2030 ($ million)
Chart on Reagent grade - Year-over-year growth 2025-2030 (%)
Data Table on Reagent grade - Year-over-year growth 2025-2030 (%)

9.5 Lab grade - Market size and forecast 2025-2030

Chart on Lab grade - Market size and forecast 2025-2030 ($ million)
Data Table on Lab grade - Market size and forecast 2025-2030 ($ million)
Chart on Lab grade - Year-over-year growth 2025-2030 (%)
Data Table on Lab grade - Year-over-year growth 2025-2030 (%)

9.6 Market opportunity by Grade Type

Market opportunity by Grade Type ($ million)
Data Table on Market opportunity by Grade Type ($ million)

10. Market Segmentation by End-user

10.1 Market segments

Chart on End-user - Market share 2025-2030 (%)
Data Table on End-user - Market share 2025-2030 (%)

10.2 Comparison by End-user

Chart on Comparison by End-user
Data Table on Comparison by End-user

10.3 Automotive - Market size and forecast 2025-2030

Chart on Automotive - Market size and forecast 2025-2030 ($ million)
Data Table on Automotive - Market size and forecast 2025-2030 ($ million)
Chart on Automotive - Year-over-year growth 2025-2030 (%)
Data Table on Automotive - Year-over-year growth 2025-2030 (%)

10.4 Construction - Market size and forecast 2025-2030

Chart on Construction - Market size and forecast 2025-2030 ($ million)
Data Table on Construction - Market size and forecast 2025-2030 ($ million)
Chart on Construction - Year-over-year growth 2025-2030 (%)
Data Table on Construction - Year-over-year growth 2025-2030 (%)

10.5 Electronics - Market size and forecast 2025-2030

Chart on Electronics - Market size and forecast 2025-2030 ($ million)
Data Table on Electronics - Market size and forecast 2025-2030 ($ million)
Chart on Electronics - Year-over-year growth 2025-2030 (%)
Data Table on Electronics - Year-over-year growth 2025-2030 (%)

10.6 Packaging - Market size and forecast 2025-2030

Chart on Packaging - Market size and forecast 2025-2030 ($ million)
Data Table on Packaging - Market size and forecast 2025-2030 ($ million)
Chart on Packaging - Year-over-year growth 2025-2030 (%)
Data Table on Packaging - Year-over-year growth 2025-2030 (%)

10.7 Others - Market size and forecast 2025-2030

Chart on Others - Market size and forecast 2025-2030 ($ million)
Data Table on Others - Market size and forecast 2025-2030 ($ million)
Chart on Others - Year-over-year growth 2025-2030 (%)
Data Table on Others - Year-over-year growth 2025-2030 (%)

10.8 Market opportunity by End-user

Market opportunity by End-user ($ million)
Data Table on Market opportunity by End-user ($ million)

11. Customer Landscape

11.1 Customer landscape overview

Analysis of price sensitivity, lifecycle, customer purchase basket, adoption rates, and purchase criteria

12. Geographic Landscape

12.1 Geographic segmentation

Chart on Market share by geography 2025-2030 (%)
Data Table on Market share by geography 2025-2030 (%)

12.2 Geographic comparison

Chart on Geographic comparison
Data Table on Geographic comparison

12.3 North America - Market size and forecast 2025-2030

Chart on North America - Market size and forecast 2025-2030 ($ million)
Data Table on North America - Market size and forecast 2025-2030 ($ million)
Chart on North America - Year-over-year growth 2025-2030 (%)
Data Table on North America - Year-over-year growth 2025-2030 (%)
Chart on Regional Comparison - North America
Data Table on Regional Comparison - North America

12.3.1 US - Market size and forecast 2025-2030

Chart on US - Market size and forecast 2025-2030 ($ million)
Data Table on US - Market size and forecast 2025-2030 ($ million)
Chart on US - Year-over-year growth 2025-2030 (%)
Data Table on US - Year-over-year growth 2025-2030 (%)

12.3.2 Canada - Market size and forecast 2025-2030

Chart on Canada - Market size and forecast 2025-2030 ($ million)
Data Table on Canada - Market size and forecast 2025-2030 ($ million)
Chart on Canada - Year-over-year growth 2025-2030 (%)
Data Table on Canada - Year-over-year growth 2025-2030 (%)

12.3.3 Mexico - Market size and forecast 2025-2030

Chart on Mexico - Market size and forecast 2025-2030 ($ million)
Data Table on Mexico - Market size and forecast 2025-2030 ($ million)
Chart on Mexico - Year-over-year growth 2025-2030 (%)
Data Table on Mexico - Year-over-year growth 2025-2030 (%)

12.4 APAC - Market size and forecast 2025-2030

Chart on APAC - Market size and forecast 2025-2030 ($ million)
Data Table on APAC - Market size and forecast 2025-2030 ($ million)
Chart on APAC - Year-over-year growth 2025-2030 (%)
Data Table on APAC - Year-over-year growth 2025-2030 (%)
Chart on Regional Comparison - APAC
Data Table on Regional Comparison - APAC

12.4.1 China - Market size and forecast 2025-2030

Chart on China - Market size and forecast 2025-2030 ($ million)
Data Table on China - Market size and forecast 2025-2030 ($ million)
Chart on China - Year-over-year growth 2025-2030 (%)
Data Table on China - Year-over-year growth 2025-2030 (%)

12.4.2 Japan - Market size and forecast 2025-2030

Chart on Japan - Market size and forecast 2025-2030 ($ million)
Data Table on Japan - Market size and forecast 2025-2030 ($ million)
Chart on Japan - Year-over-year growth 2025-2030 (%)
Data Table on Japan - Year-over-year growth 2025-2030 (%)

12.4.3 India - Market size and forecast 2025-2030

Chart on India - Market size and forecast 2025-2030 ($ million)
Data Table on India - Market size and forecast 2025-2030 ($ million)
Chart on India - Year-over-year growth 2025-2030 (%)
Data Table on India - Year-over-year growth 2025-2030 (%)

12.4.4 South Korea - Market size and forecast 2025-2030

Chart on South Korea - Market size and forecast 2025-2030 ($ million)
Data Table on South Korea - Market size and forecast 2025-2030 ($ million)
Chart on South Korea - Year-over-year growth 2025-2030 (%)
Data Table on South Korea - Year-over-year growth 2025-2030 (%)

12.4.5 Australia - Market size and forecast 2025-2030

Chart on Australia - Market size and forecast 2025-2030 ($ million)
Data Table on Australia - Market size and forecast 2025-2030 ($ million)
Chart on Australia - Year-over-year growth 2025-2030 (%)
Data Table on Australia - Year-over-year growth 2025-2030 (%)

12.4.6 Indonesia - Market size and forecast 2025-2030

Chart on Indonesia - Market size and forecast 2025-2030 ($ million)
Data Table on Indonesia - Market size and forecast 2025-2030 ($ million)
Chart on Indonesia - Year-over-year growth 2025-2030 (%)
Data Table on Indonesia - Year-over-year growth 2025-2030 (%)

12.5 Europe - Market size and forecast 2025-2030

Chart on Europe - Market size and forecast 2025-2030 ($ million)
Data Table on Europe - Market size and forecast 2025-2030 ($ million)
Chart on Europe - Year-over-year growth 2025-2030 (%)
Data Table on Europe - Year-over-year growth 2025-2030 (%)
Chart on Regional Comparison - Europe
Data Table on Regional Comparison - Europe

12.5.1 Germany - Market size and forecast 2025-2030

Chart on Germany - Market size and forecast 2025-2030 ($ million)
Data Table on Germany - Market size and forecast 2025-2030 ($ million)
Chart on Germany - Year-over-year growth 2025-2030 (%)
Data Table on Germany - Year-over-year growth 2025-2030 (%)

12.5.2 UK - Market size and forecast 2025-2030

Chart on UK - Market size and forecast 2025-2030 ($ million)
Data Table on UK - Market size and forecast 2025-2030 ($ million)
Chart on UK - Year-over-year growth 2025-2030 (%)
Data Table on UK - Year-over-year growth 2025-2030 (%)

12.5.3 France - Market size and forecast 2025-2030

Chart on France - Market size and forecast 2025-2030 ($ million)
Data Table on France - Market size and forecast 2025-2030 ($ million)
Chart on France - Year-over-year growth 2025-2030 (%)
Data Table on France - Year-over-year growth 2025-2030 (%)

12.5.4 Italy - Market size and forecast 2025-2030

Chart on Italy - Market size and forecast 2025-2030 ($ million)
Data Table on Italy - Market size and forecast 2025-2030 ($ million)
Chart on Italy - Year-over-year growth 2025-2030 (%)
Data Table on Italy - Year-over-year growth 2025-2030 (%)

12.5.5 Spain - Market size and forecast 2025-2030

Chart on Spain - Market size and forecast 2025-2030 ($ million)
Data Table on Spain - Market size and forecast 2025-2030 ($ million)
Chart on Spain - Year-over-year growth 2025-2030 (%)
Data Table on Spain - Year-over-year growth 2025-2030 (%)

12.5.6 The Netherlands - Market size and forecast 2025-2030

Chart on The Netherlands - Market size and forecast 2025-2030 ($ million)
Data Table on The Netherlands - Market size and forecast 2025-2030 ($ million)
Chart on The Netherlands - Year-over-year growth 2025-2030 (%)
Data Table on The Netherlands - Year-over-year growth 2025-2030 (%)

12.6 South America - Market size and forecast 2025-2030

Chart on South America - Market size and forecast 2025-2030 ($ million)
Data Table on South America - Market size and forecast 2025-2030 ($ million)
Chart on South America - Year-over-year growth 2025-2030 (%)
Data Table on South America - Year-over-year growth 2025-2030 (%)
Chart on Regional Comparison - South America
Data Table on Regional Comparison - South America

12.6.1 Brazil - Market size and forecast 2025-2030

Chart on Brazil - Market size and forecast 2025-2030 ($ million)
Data Table on Brazil - Market size and forecast 2025-2030 ($ million)
Chart on Brazil - Year-over-year growth 2025-2030 (%)
Data Table on Brazil - Year-over-year growth 2025-2030 (%)

12.6.2 Argentina - Market size and forecast 2025-2030

Chart on Argentina - Market size and forecast 2025-2030 ($ million)
Data Table on Argentina - Market size and forecast 2025-2030 ($ million)
Chart on Argentina - Year-over-year growth 2025-2030 (%)
Data Table on Argentina - Year-over-year growth 2025-2030 (%)

12.6.3 Chile - Market size and forecast 2025-2030

Chart on Chile - Market size and forecast 2025-2030 ($ million)
Data Table on Chile - Market size and forecast 2025-2030 ($ million)
Chart on Chile - Year-over-year growth 2025-2030 (%)
Data Table on Chile - Year-over-year growth 2025-2030 (%)

12.7 Middle East and Africa - Market size and forecast 2025-2030

Chart on Middle East and Africa - Market size and forecast 2025-2030 ($ million)
Data Table on Middle East and Africa - Market size and forecast 2025-2030 ($ million)
Chart on Middle East and Africa - Year-over-year growth 2025-2030 (%)
Data Table on Middle East and Africa - Year-over-year growth 2025-2030 (%)
Chart on Regional Comparison - Middle East and Africa
Data Table on Regional Comparison - Middle East and Africa

12.7.1 Saudi Arabia - Market size and forecast 2025-2030

Chart on Saudi Arabia - Market size and forecast 2025-2030 ($ million)
Data Table on Saudi Arabia - Market size and forecast 2025-2030 ($ million)
Chart on Saudi Arabia - Year-over-year growth 2025-2030 (%)
Data Table on Saudi Arabia - Year-over-year growth 2025-2030 (%)

12.7.2 UAE - Market size and forecast 2025-2030

Chart on UAE - Market size and forecast 2025-2030 ($ million)
Data Table on UAE - Market size and forecast 2025-2030 ($ million)
Chart on UAE - Year-over-year growth 2025-2030 (%)
Data Table on UAE - Year-over-year growth 2025-2030 (%)

12.7.3 South Africa - Market size and forecast 2025-2030

Chart on South Africa - Market size and forecast 2025-2030 ($ million)
Data Table on South Africa - Market size and forecast 2025-2030 ($ million)
Chart on South Africa - Year-over-year growth 2025-2030 (%)
Data Table on South Africa - Year-over-year growth 2025-2030 (%)

12.7.4 Israel - Market size and forecast 2025-2030

Chart on Israel - Market size and forecast 2025-2030 ($ million)
Data Table on Israel - Market size and forecast 2025-2030 ($ million)
Chart on Israel - Year-over-year growth 2025-2030 (%)
Data Table on Israel - Year-over-year growth 2025-2030 (%)

12.7.5 Turkey - Market size and forecast 2025-2030

Chart on Turkey - Market size and forecast 2025-2030 ($ million)
Data Table on Turkey - Market size and forecast 2025-2030 ($ million)
Chart on Turkey - Year-over-year growth 2025-2030 (%)
Data Table on Turkey - Year-over-year growth 2025-2030 (%)

12.8 Market opportunity by geography

Market opportunity by geography ($ million)
Data Tables on Market opportunity by geography ($ million)

13. Drivers, Challenges, and Opportunity

13.1 Market drivers

Demand for aliphatic polyurethane coatings
Wind rotor blade expansion and amine-cured composites
Decarbonization and low-emission waterborne dispersions

13.2 Market challenges

Feedstock price volatility and concentrated upstream supply chains
Strict environmental regulations and VOC limits
Global capacity expansions and subsequent margin compression

13.3 Impact of drivers and challenges

Impact of drivers and challenges in 2025 and 2030

13.4 Market opportunities

Isophorone diamine demand in wind and epoxy applications
Bio-based chemistry and environmental compliance
Cycloaliphatic diamines in lightweight EV adhesives

14. Competitive Landscape

14.1 Overview

14.2

Overview on criticality of inputs and factors of differentiation

14.3 Landscape disruption

Overview on factors of disruption

14.4 Industry risks

Impact of key risks on business

15. Competitive Analysis

15.1 Companies profiled

Companies covered

15.2 Company ranking index

15.3 Market positioning of companies

Matrix on companies position and classification

15.4 Arkema Group

Arkema Group - Overview
Arkema Group - Business segments
Arkema Group - Key news
Arkema Group - Key offerings
Arkema Group - Segment focus
SWOT

15.5 BASF SE

BASF SE - Overview
BASF SE - Business segments
BASF SE - Key news
BASF SE - Key offerings
BASF SE - Segment focus
SWOT

15.6 Biosynth Ltd.

Biosynth Ltd. - Overview
Biosynth Ltd. - Product / Service
Biosynth Ltd. - Key offerings
SWOT

15.7 Covestro AG

Covestro AG - Overview
Covestro AG - Business segments
Covestro AG - Key news
Covestro AG - Key offerings
Covestro AG - Segment focus
SWOT

15.8 Dow Chemical Co.

Dow Chemical Co. - Overview
Dow Chemical Co. - Business segments
Dow Chemical Co. - Key news
Dow Chemical Co. - Key offerings
Dow Chemical Co. - Segment focus
SWOT

15.9 Evonik Industries AG

Evonik Industries AG - Overview
Evonik Industries AG - Business segments
Evonik Industries AG - Key news
Evonik Industries AG - Key offerings
Evonik Industries AG - Segment focus
SWOT

15.10 Lanxess AG

Lanxess AG - Overview
Lanxess AG - Business segments
Lanxess AG - Key offerings
Lanxess AG - Segment focus
SWOT

15.11 LGC Ltd.

LGC Ltd. - Overview
LGC Ltd. - Product / Service
LGC Ltd. - Key offerings
SWOT

15.12 Merck KGaA

Merck KGaA - Overview
Merck KGaA - Business segments
Merck KGaA - Key news
Merck KGaA - Key offerings
Merck KGaA - Segment focus
SWOT

15.13 Prasol Chemicals Ltd.

Prasol Chemicals Ltd. - Overview
Prasol Chemicals Ltd. - Product / Service
Prasol Chemicals Ltd. - Key offerings
SWOT

15.14 Santa Cruz Biotechnology Inc.

Santa Cruz Biotechnology Inc. - Overview
Santa Cruz Biotechnology Inc. - Product / Service
Santa Cruz Biotechnology Inc. - Key offerings
SWOT

15.15 SI Group Inc.

SI Group Inc. - Overview
SI Group Inc. - Product / Service
SI Group Inc. - Key offerings
SWOT

15.16 Thermo Fisher Scientific Inc.

Thermo Fisher Scientific Inc. - Overview
Thermo Fisher Scientific Inc. - Business segments
Thermo Fisher Scientific Inc. - Key news
Thermo Fisher Scientific Inc. - Key offerings
Thermo Fisher Scientific Inc. - Segment focus
SWOT

15.17 Wanhua Chemical Group Co. Ltd.

Wanhua Chemical Group Co. Ltd. - Overview
Wanhua Chemical Group Co. Ltd. - Product / Service
Wanhua Chemical Group Co. Ltd. - Key offerings
SWOT

15.18 Zhejiang NHU Co. Ltd.

Zhejiang NHU Co. Ltd. - Overview
Zhejiang NHU Co. Ltd. - Business segments
Zhejiang NHU Co. Ltd. - Key offerings
Zhejiang NHU Co. Ltd. - Segment focus
SWOT

16. Appendix

16.1 Scope of the report

Market definition
Objectives
Notes and caveats

16.2 Inclusions and exclusions checklist

Inclusions checklist
Exclusions checklist

16.3 Currency conversion rates for US$

16.4 Research methodology

16.5 Data procurement

Information sources

16.6 Data validation

16.7 Validation techniques employed for market sizing

16.8 Data synthesis

16.9 360 degree market analysis

16.10 List of abbreviations

Research Methodology

Technavio presents a detailed picture of the market by way of study, synthesis, and summation of data from multiple sources. The analysts have presented the various facets of the market with a particular focus on identifying the key industry influencers. The data thus presented is comprehensive, reliable, and the result of extensive research, both primary and secondary.

INFORMATION SOURCES

Primary sources

  • Manufacturers and suppliers
  • Channel partners
  • Industry experts
  • Strategic decision makers

Secondary sources

  • Industry journals and periodicals
  • Government data
  • Financial reports of key industry players
  • Historical data
  • Press releases

DATA ANALYSIS

Data Synthesis

  • Collation of data
  • Estimation of key figures
  • Analysis of derived insights

Data Validation

  • Triangulation with data models
  • Reference against proprietary databases
  • Corroboration with industry experts

REPORT WRITING

Qualitative

  • Market drivers
  • Market challenges
  • Market trends
  • Five forces analysis

Quantitative

  • Market size and forecast
  • Market segmentation
  • Geographical insights
  • Competitive landscape

Interested in this report?

Get your sample now to see our research methodology and insights!

Download Now

Frequently Asked Questions

Isophorone market growth will increase by USD 435.8 million during 2026-2030.

The Isophorone market is expected to grow at a CAGR of 5.1% during 2026-2030.

Isophorone market is segmented by Application (Adhesives, Composites, Printing inks, Artificial leather, Others) Grade type (Industrial grade, Reagent grade, Lab grade) End-user (Automotive, Construction, Electronics, Packaging, Others)

Arkema Group, BASF SE, Biosynth Ltd., Covestro AG, Dow Chemical Co., Evonik Industries AG, Lanxess AG, LGC Ltd., Merck KGaA, Prasol Chemicals Ltd., Santa Cruz Biotechnology Inc., SI Group Inc., Thermo Fisher Scientific Inc., Tokyo Chemical Industry Co., Wanhua Chemical Group Co. Ltd., Zhejiang NHU Co. Ltd. are a few of the key vendors in the Isophorone market.

North America will register the highest growth rate of 37.7% among the other regions. Therefore, the Isophorone market in North America is expected to garner significant business opportunities for the vendors during the forecast period.

US, Canada, Mexico, China, Japan, India, South Korea, Australia, Indonesia, Germany, UK, France, Italy, Spain, The Netherlands, Brazil, Argentina, Chile, Saudi Arabia, UAE, South Africa, Israel, Turkey

  • Demand for aliphatic polyurethane coatings is the driving factor this market.

The Isophorone market vendors should focus on grabbing business opportunities from the Application segment as it accounted for the largest market share in the base year.
RIA - Research AI Assistant
Ask RIA