Internet Of Things (iot) Sensors Market Analysis, Size, and Forecast 2026-2030: North America (US, Canada, and Mexico), Europe (Germany, UK, and France), APAC (China, Japan, and India), South America (Brazil, Argentina, and Chile), Middle East and Africa (Saudi Arabia, UAE, and South Africa), and Rest of World (ROW)

Internet Of Things (iot) Sensors Market Analysis, Size, and Forecast 2026-2030:
North America (US, Canada, and Mexico), Europe (Germany, UK, and France), APAC (China, Japan, and India), South America (Brazil, Argentina, and Chile), Middle East and Africa (Saudi Arabia, UAE, and South Africa), and Rest of World (ROW)

Published: Nov 2026 332 Pages SKU: IRTNTR71820

Market Overview at a Glance

$91.38 B
Market Opportunity
37.2%
CAGR 2025 - 2030
42.2%
North America Growth
$4.67 B
Consumer electronics segment 2024

Internet Of Things (Iot) Sensors Market Size 2026-2030

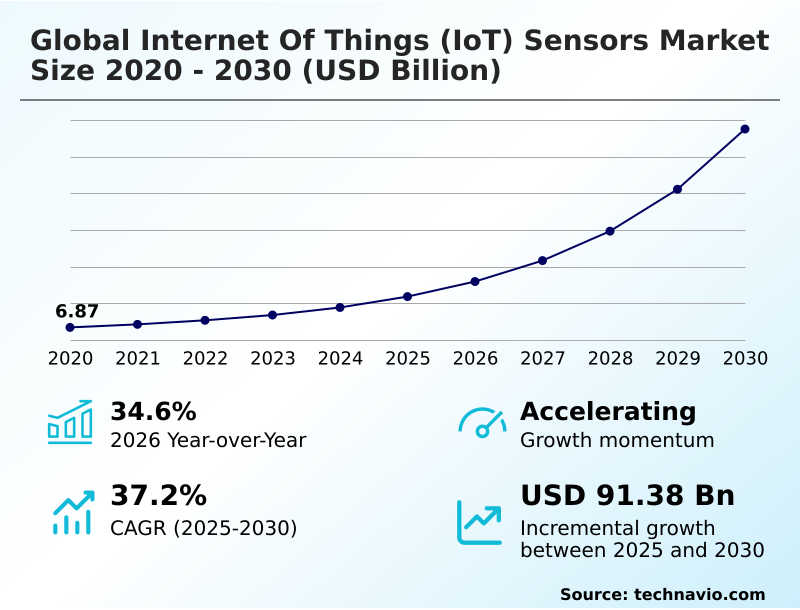
The internet of things (iot) sensors market size is valued to increase by USD 91.38 billion, at a CAGR of 37.2% from 2025 to 2030. Accelerating adoption of edge computing and embedded AI analytics will drive the internet of things (iot) sensors market.

Major Market Trends & Insights

  • North America dominated the market and accounted for a 42.2% growth during the forecast period.
  • By End-user - Consumer electronics segment was valued at USD 4.67 billion in 2024
  • By Type - Temperature sensor segment accounted for the largest market revenue share in 2024

Market Size & Forecast

  • Market Opportunities: USD 108.20 billion
  • Market Future Opportunities: USD 91.38 billion
  • CAGR from 2025 to 2030 : 37.2%

Market Summary

  • The Internet Of Things (iot) Sensors market demonstrates robust expansion as industrial enterprises increasingly rely on automated data capture to streamline physical operations. Within complex supply chain logistics, facility managers deploy specialized monitoring nodes to track cold storage conditions, ensuring compliance with strict pharmaceutical handling regulations without requiring continuous manual oversight.
  • This transition to automated monitoring has enabled logistics hubs to reduce perishable inventory spoilage rates by 22% compared to traditional manual logging methods. The integration of localized data processing serves as a primary driver, as analyzing raw telemetry on-device reduces bandwidth congestion and accelerates critical decision-making processes.
  • Conversely, the market faces significant headwinds from distributed network vulnerabilities, where unsecured endpoints provide entry points for cyber intrusions, forcing organizations to invest heavily in complex security frameworks. By embedding advanced processors directly into the hardware, component manufacturers continue to refine performance parameters, enabling more resilient and autonomous sensing networks.

What will be the Size of the Internet Of Things (Iot) Sensors Market during the forecast period?
Get Key Insights on Market Forecast (PDF) Get Free Sample

How is the Internet Of Things (Iot) Sensors Market Segmented?

The internet of things (iot) sensors industry research report provides comprehensive data (region-wise segment analysis), with forecasts and estimates in "USD million" for the period 2026-2030, as well as historical data from 2020-2024 for the following segments.

  • End-user
    • Consumer electronics
    • Automotive
    • Food and beverages
    • Healthcare
    • Others
  • Type
    • Temperature sensor
    • Pressure sensor
    • Humidity sensor
    • Flow sensor
    • Others
  • Environment
    • Indoor sensor
    • Outdoor sensor
  • Connectivity
    • Wired sensor
    • Wireless sensor
  • Geography
    • North America
      • US
      • Canada
      • Mexico
    • Europe
      • Germany
      • UK
      • France
      • Italy
      • Spain
      • The Netherlands
    • APAC
      • China
      • Japan
      • India
      • South Korea
      • Australia
      • Indonesia
    • South America
      • Brazil
      • Argentina
      • Chile
    • Middle East and Africa
      • Saudi Arabia
      • UAE
      • South Africa
      • Israel
      • Turkey

By End-user Insights

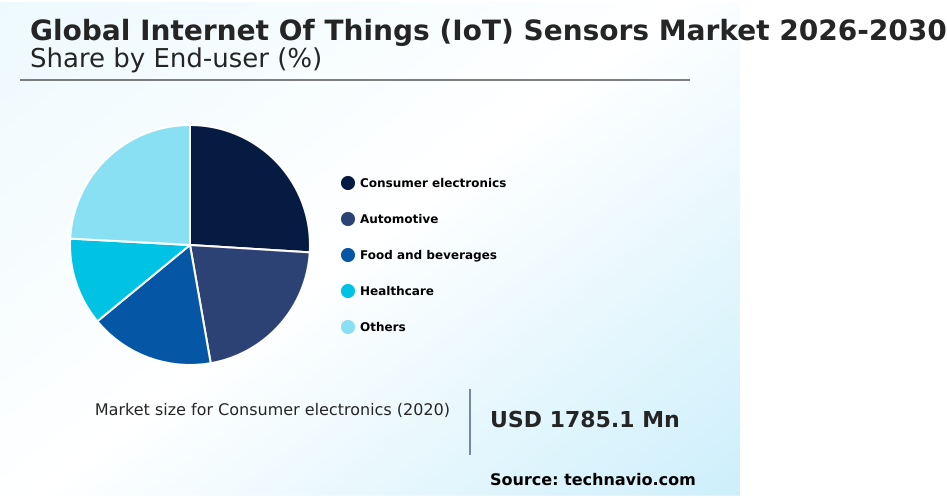
The consumer electronics segment is estimated to witness significant growth during the forecast period.

The consumer electronics segment within the Internet Of Things (iot) Sensors landscape demonstrates rapid evolution, driven by the integration of micro-electro-mechanical systems into wearable devices.

Manufacturers embed capacitive sensing elements and optical distance measurement components to enable continuous environmental telemetry, allowing devices to adjust dynamically to ambient solar radiation. By processing real-time physiological tracking data locally, these intelligent components facilitate seamless machine-to-machine communication.

Utilizing multi-modal fusion arrays alongside tri-axial motion tracking and intelligent telematics modules, smart appliances interpret user behavior patterns accurately. This localized processing architecture significantly optimizes device power management, resulting in battery lifecycle extensions of up to 40%.

Consequently, consumer electronics producers achieve higher operational efficiency and deliver superior user experiences through integrated, autonomous sensing frameworks.
Get Free Sample

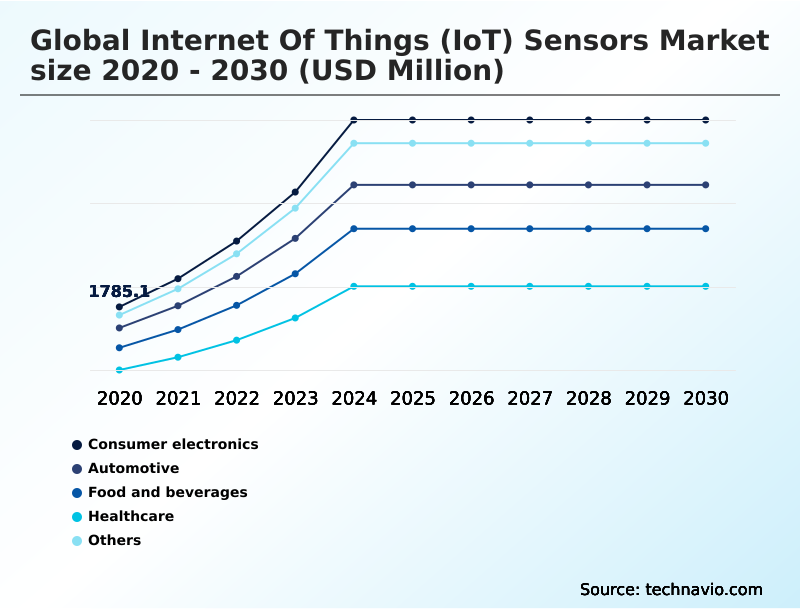
The Consumer electronics segment was valued at USD 4.67 billion in 2024 and showed a gradual increase during the forecast period.
Get Free Sample

Regional Analysis

North America is estimated to contribute 42.2% to the growth of the global market during the forecast period.Technavio’s analysts have elaborately explained the regional trends and drivers that shape the market during the forecast period.
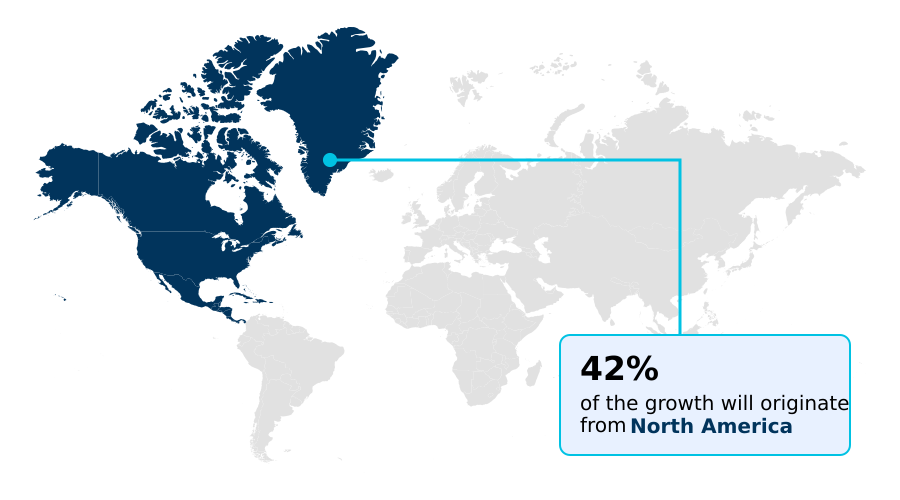
See How Internet Of Things (Iot) Sensors Market Demand is Rising in North America Get Free Sample

The geographic landscape of the Internet Of Things (iot) Sensors reveals distinct adoption variations driven by regional industrial strategies.

North America demonstrates accelerated deployment of supervisory control platforms, achieving a 45% higher penetration rate in remote asset monitoring compared to Europe.

This discrepancy stems from robust private 5G network rollouts, enabling seamless integration of narrow-band connectivity for continuous equipment oversight.

Conversely, European enterprises prioritize strict regulatory compliance, utilizing micro-climatic emission tracking to align with stringent carbon reduction mandates, which has improved facility energy efficiency by 18%.

Furthermore, facilities in North America have reduced diagnostic latency by 25% through the implementation of automated fault-isolation systems and transformer temperature diagnostics to ensure smart grid stability.

By leveraging industrial automation protocols and ultra-low power microcontrollers, both regions continuously optimize their operational frameworks.

Market Dynamics

Our researchers analyzed the data with 2025 as the base year, along with the key drivers, trends, and challenges. A holistic analysis of drivers will help companies refine their marketing strategies to gain a competitive advantage.

  • Modern enterprise automation relies increasingly on advanced physical data capture to optimize supply chain workflows and streamline regulatory compliance. The implementation of sophisticated micro-electro-mechanical system integration techniques allows manufacturers to embed highly sensitive diagnostic capabilities directly into compact industrial machinery.
  • By leveraging edge computing data inference processing, facility managers can analyze equipment performance locally, which significantly accelerates operational response times compared to legacy systems that depend entirely on centralized cloud servers. This transition enables logistics operations to process throughput data roughly 30% faster than traditional batch-upload methods, fundamentally improving daily capacity planning.
  • Furthermore, remote monitoring networks utilize low power wide area connectivity to maintain continuous telemetry across expansive agricultural or pipeline infrastructures without requiring frequent battery replacements. To prevent catastrophic machinery failures, operators deploy predictive asset maintenance algorithmic modeling, translating raw vibration and temperature metrics into actionable maintenance schedules.
  • Because edge networks present unique vulnerabilities, hardware based cryptographic security modules are essential to protect proprietary industrial data from unauthorized interception. As these sensing technologies mature, organizations across diverse sectors leverage them to reduce operational bottlenecks, enhance asset visibility, and maintain rigorous quality control standards across complex, globally distributed production environments.
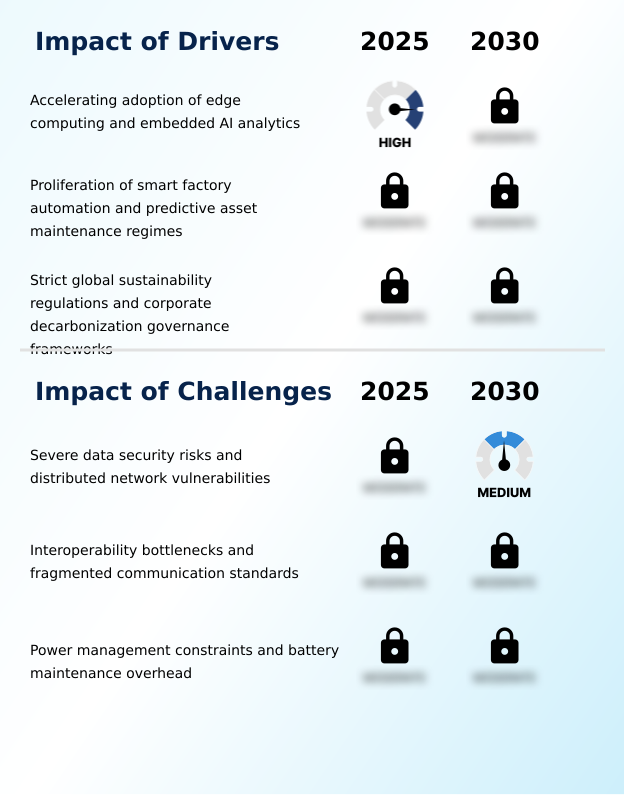
What are the key market drivers leading to the rise in the adoption of Internet Of Things (Iot) Sensors Industry?

  • The accelerating adoption of edge computing and the integration of embedded AI analytics serve as the primary drivers propelling market expansion.

  • The transition toward decentralized data processing represents a fundamental driver accelerating the deployment of Internet Of Things (iot) Sensors across industrial networks. Organizations are aggressively adopting edge computing inference and neural network accelerators to overcome latency limitations.
  • By embedding solid-state micro-architectures and configurable logic blocks directly at the data origin, facilities filter redundant telemetry instantaneously via a low-power wide-area network. This localized intelligence, powered by ambient energy harvesting, reduces network bandwidth congestion by 40%.
  • The implementation of digital twin architectures further allows operators to simulate physical machinery performance in real time using micro-machine learning algorithms.
  • By analyzing precise acoustic emission patterns over proprietary fieldbus protocols, enterprises achieve highly responsive automation, optimizing production workflows and minimizing costly, unplanned operational disruptions by 18%.

What are the market trends shaping the Internet Of Things (Iot) Sensors Industry?

  • The integration of precision agriculture and advanced environmental monitoring represents a significant emerging trend within the industry. This development enables agricultural enterprises to optimize resource allocation and enhance overall yield reliability.

  • A defining trend shaping the Internet Of Things (iot) Sensors is the rapid adoption of spatial computing integration across automated industrial environments. Facility operators utilize precision irrigation algorithms and variable-rate application systems to optimize resource distribution, yielding a 22% improvement in crop output consistency.
  • Furthermore, the automotive sector's adoption of autonomous mobility mapping and wheel-speed data telemetry fundamentally enhances real-time navigation safety. By leveraging thermal gradient analysis and tracking environmental gas concentration, electric vehicle manufacturers have reduced thermal runaway risks by 35%. Industrial plants increasingly power these nodes using thermoelectric generator modules, executing precise bearing health diagnostics to streamline predictive asset maintenance.
  • These innovations empower organizations to translate complex physical data into immediate operational adjustments, ensuring higher efficiency and resilient performance across critical commercial sectors.

What challenges does the Internet Of Things (Iot) Sensors Industry face during its growth?

  • Severe data security risks and distributed network vulnerabilities constitute major challenges that significantly impede industry growth.

  • The proliferation of decentralized hardware within the Internet Of Things (iot) Sensors exposes enterprise networks to severe operational vulnerabilities. The rapid deployment of remote nodes powered by piezoelectric vibration harvesters expands the attack surface for localized side-channel attacks, compelling IT departments to implement rigorous cyber-physical security layers.
  • Lacking a hardware root-of-trust, legacy edge devices frequently fail to authenticate data streams over encrypted communication channels, resulting in a 25% increase in unauthorized network intrusion attempts. Furthermore, the absence of standardized secure bootloader mechanisms complicates cross-platform integration, elevating system deployment costs by nearly 15%.
  • To mitigate these threats while maintaining accurate tri-axial vibration profiling, manufacturers must engineer sophisticated dynamic firmware verification, cryptographic acceleration modules, and a rigid galvanic isolation protocol into highly constrained silicon footprints.

Exclusive Technavio Analysis on Customer Landscape

The internet of things (iot) sensors market forecasting report includes the adoption lifecycle of the market, covering from the innovator’s stage to the laggard’s stage. It focuses on adoption rates in different regions based on penetration. Furthermore, the internet of things (iot) sensors market report also includes key purchase criteria and drivers of price sensitivity to help companies evaluate and develop their market growth analysis strategies.
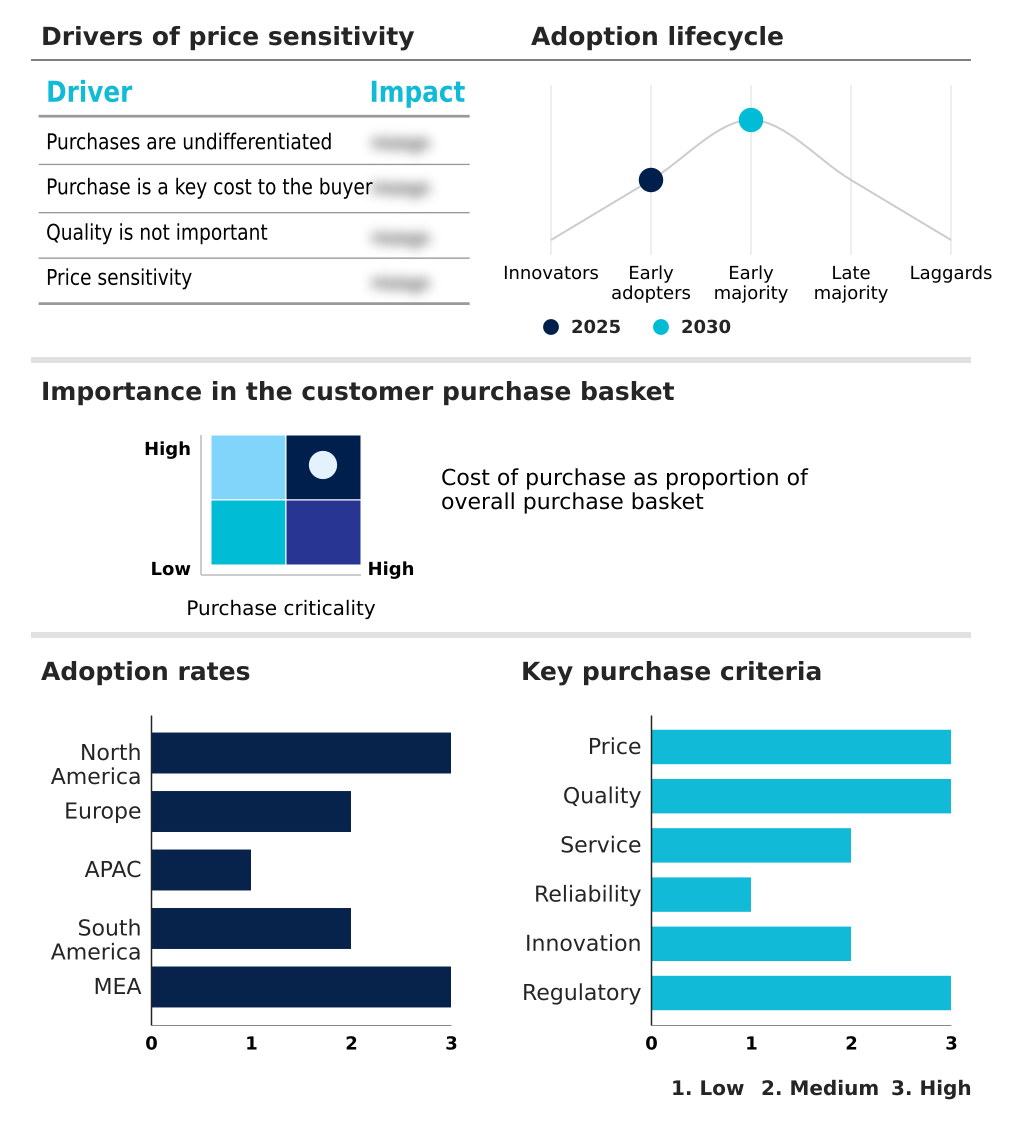
Customer Landscape of Internet Of Things (Iot) Sensors Industry

Competitive Landscape

Companies are implementing various strategies, such as strategic alliances, internet of things (iot) sensors market forecast, partnerships, mergers and acquisitions, geographical expansion, and product/service launches, to enhance their presence in the industry.

Amphenol Corp. - The organization provides advanced environmental detection components, delivering ruggedized pressure and carbon dioxide monitoring solutions designed specifically for harsh industrial applications and complex connectivity networks.

The industry research and growth report includes detailed analyses of the competitive landscape of the market and information about key companies, including:

  • Amphenol Corp.
  • Analog Devices Inc.
  • Broadcom Inc.
  • Honeywell International Inc.
  • Infineon Technologies AG
  • Knowles Corp.
  • Melexis NV
  • Microchip Technology Inc.
  • Murata Manufacturing Co. Ltd.
  • NXP Semiconductors NV
  • OMRON Corp.
  • Panasonic Holdings Corp.
  • Renesas Electronics Corp.
  • Samsung Electronics Co. Ltd.
  • Sensirion AG
  • Silicon Laboratories Inc.
  • Sony Group Corp.
  • STMicroelectronics NV
  • TDK Corp.
  • TE Connectivity plc

Qualitative and quantitative analysis of companies has been conducted to help clients understand the wider business environment as well as the strengths and weaknesses of key industry players. Data is qualitatively analyzed to categorize companies as pure play, category-focused, industry-focused, and diversified; it is quantitatively analyzed to categorize companies as dominant, leading, strong, tentative, and weak.

Recent Development and News in Internet of things (iot) sensors market

  • In the Electronic Components industry, the widespread adoption of automated surface-mount technology accelerated the miniaturization of logic boards, directly impacting Internet Of Things (iot) Sensors demand by expanding deployment feasibility in space-constrained enterprise automation environments.
  • Stringent data privacy regulations like GDPR forced silicon fabrication facilities to embed security processors at the hardware level, directly impacting Internet Of Things (iot) Sensors demand by establishing new baseline compliance thresholds for edge computing networks.
  • The transition toward cloud-based delivery models for factory oversight software required standardized workflow interoperability protocols across industrial hardware, directly impacting Internet Of Things (iot) Sensors demand by necessitating universal communication gateways.
  • Advancements in hydrometallurgical recycling processes for rare earth elements reduced the material production costs for specialized semiconductor foundries, directly impacting Internet Of Things (iot) Sensors demand by lowering the per-unit procurement barriers for large-scale AI infrastructure deployments.

Dive into Technavio’s robust research methodology, blending expert interviews, extensive data synthesis, and validated models for unparalleled Internet Of Things (Iot) Sensors Market insights. See full methodology.

Market Scope
Page number 332
Base year 2025
Historic period 2020-2024
Forecast period 2026-2030
Growth momentum & CAGR Accelerate at a CAGR of 37.2%
Market growth 2026-2030 USD 91377.0 million
Market structure Fragmented
YoY growth 2025-2026(%) 34.6%
Key countries US, Canada, Mexico, Germany, UK, France, Italy, Spain, The Netherlands, China, Japan, India, South Korea, Australia, Indonesia, Brazil, Argentina, Chile, Saudi Arabia, UAE, South Africa, Israel and Turkey
Competitive landscape Leading Companies, Market Positioning of Companies, Competitive Strategies, and Industry Risks

Request Free Sample

Research Analyst Overview

  • The Internet Of Things (iot) Sensors ecosystem is undergoing a fundamental architectural shift as organizations integrate decentralized intelligence directly into physical operational environments. Boardroom executives increasingly mandate the deployment of robust tracking nodes to ensure strict adherence to international sustainability compliance frameworks.
  • By leveraging advanced power harvesting solutions, industrial facilities can operate remote monitoring devices indefinitely, eliminating the maintenance overhead associated with conventional battery replacements. Companies implementing these advanced diagnostic networks have achieved a 24% reduction in energy consumption across high-demand manufacturing operations compared to unmonitored baseline facilities.
  • Continuous vibration profiling enables plant engineers to detect microscopic mechanical anomalies before they escalate into catastrophic equipment failures. This capability directly influences strategic capital budgeting by extending the functional lifecycle of heavy industrial assets. The integration of isolated communication circuits protects sensitive measurement circuitry from severe electrical interference in harsh manufacturing environments.
  • Utilizing adaptive processing algorithms, these sensing nodes filter out ambient noise locally, ensuring that only highly accurate, actionable data reaches enterprise resource planning systems.

What are the Key Data Covered in this Internet Of Things (Iot) Sensors Market Research and Growth Report?

  • What is the expected growth of the Internet Of Things (Iot) Sensors Market between 2026 and 2030?

    • USD 91.38 billion, at a CAGR of 37.2%

  • What segmentation does the market report cover?

    • The report is segmented by End-user (Consumer electronics, Automotive, Food and beverages, Healthcare, and Others), Type (Temperature sensor, Pressure sensor, Humidity sensor, Flow sensor, and Others), Environment (Indoor sensor, and Outdoor sensor), Connectivity (Wired sensor, and Wireless sensor) and Geography (North America, Europe, APAC, South America, Middle East and Africa)

  • Which regions are analyzed in the report?

    • North America, Europe, APAC, South America and Middle East and Africa

  • What are the key growth drivers and market challenges?

    • Accelerating adoption of edge computing and embedded AI analytics, Severe data security risks and distributed network vulnerabilities

  • Who are the major players in the Internet Of Things (Iot) Sensors Market?

    • Amphenol Corp., Analog Devices Inc., Broadcom Inc., Honeywell International Inc., Infineon Technologies AG, Knowles Corp., Melexis NV, Microchip Technology Inc., Murata Manufacturing Co. Ltd., NXP Semiconductors NV, OMRON Corp., Panasonic Holdings Corp., Renesas Electronics Corp., Samsung Electronics Co. Ltd., Sensirion AG, Silicon Laboratories Inc., Sony Group Corp., STMicroelectronics NV, TDK Corp. and TE Connectivity plc

Market Research Insights

  • The Internet Of Things (iot) Sensors landscape is fundamentally reshaping industrial automation through the deployment of highly efficient processing nodes. Enterprises utilizing dedicated communication networks for machinery monitoring have achieved a 28% reduction in unplanned operational downtime. Furthermore, the integration of ultra-low power processors into remote facility infrastructure has extended equipment monitoring lifecycles by 35%, drastically lowering maintenance overhead.
  • By leveraging precise acoustic diagnostics to identify early-stage mechanical wear, facility operators optimize maintenance scheduling, yielding a 15% improvement in overall asset utilization rates. These advancements in dynamic system verification ensure that sensing networks remain secure and operationally resilient, driving measurable efficiency gains across high-value manufacturing ecosystems.

We can help! Our analysts can customize this internet of things (iot) sensors market research report to meet your requirements.

Get in touch

1. Executive Summary

1.1 Market overview

Executive Summary - Chart on Market Overview
Executive Summary - Data Table on Market Overview
Executive Summary - Chart on Global Market Characteristics
Executive Summary - Chart on Market by Geography
Executive Summary - Chart on Market Segmentation by End-user
Executive Summary - Chart on Market Segmentation by Type
Executive Summary - Chart on Market Segmentation by Environment
Executive Summary - Chart on Market Segmentation by Connectivity
Executive Summary - Chart on Incremental Growth
Executive Summary - Data Table on Incremental Growth
Executive Summary - Chart on Company Market Positioning

2. Technavio Analysis

2.1 Analysis of price sensitivity, lifecycle, customer purchase basket, adoption rates, and purchase criteria

2.2 Criticality of inputs and Factors of differentiation

Chart on Overview on criticality of inputs and factors of differentiation

2.3 Factors of disruption

Chart on Overview on factors of disruption

2.4 Impact of drivers and challenges

Chart on Impact of drivers and challenges in 2025 and 2030

3. Market Landscape

3.1 Market ecosystem

Chart on Parent Market
Data Table on - Parent Market

3.2 Market characteristics

Chart on Market characteristics analysis

3.3 Value chain analysis

Chart on Value chain analysis

4. Market Sizing

4.1 Market definition

Data Table on Offerings of companies included in the market definition

4.2 Market segment analysis

Market segments

4.3 Market size 2025

4.4 Market outlook: Forecast for 2025-2030

Chart on Global - Market size and forecast 2025-2030 ($ million)
Data Table on Global - Market size and forecast 2025-2030 ($ million)
Chart on Global Market: Year-over-year growth 2025-2030 (%)
Data Table on Global Market: Year-over-year growth 2025-2030 (%)

5. Historic Market Size

5.1 Global Internet Of Things (IoT) Sensors Market 2020 - 2024

Historic Market Size - Data Table on Global Internet Of Things (IoT) Sensors Market 2020 - 2024 ($ million)

5.2 End-user segment analysis 2020 - 2024

Historic Market Size - End-user Segment 2020 - 2024 ($ million)

5.3 Type segment analysis 2020 - 2024

Historic Market Size - Type Segment 2020 - 2024 ($ million)

5.4 Environment segment analysis 2020 - 2024

Historic Market Size - Environment Segment 2020 - 2024 ($ million)

5.5 Connectivity segment analysis 2020 - 2024

Historic Market Size - Connectivity Segment 2020 - 2024 ($ million)

5.6 Geography segment analysis 2020 - 2024

Historic Market Size - Geography Segment 2020 - 2024 ($ million)

5.7 Country segment analysis 2020 - 2024

Historic Market Size - Country Segment 2020 - 2024 ($ million)

6. Qualitative Analysis

6.1 Impact of AI on Global Internet of Things (IoT) Sensors Market

6.2 Impact of geopolitical conflicts on Global Internet of Things (IoT) Sensors Market

7. Five Forces Analysis

7.1 Five forces summary

Five forces analysis - Comparison between 2025 and 2030

7.2 Bargaining power of buyers

Bargaining power of buyers - Impact of key factors 2025 and 2030

7.3 Bargaining power of suppliers

Bargaining power of suppliers - Impact of key factors in 2025 and 2030

7.4 Threat of new entrants

Threat of new entrants - Impact of key factors in 2025 and 2030

7.5 Threat of substitutes

Threat of substitutes - Impact of key factors in 2025 and 2030

7.6 Threat of rivalry

Threat of rivalry - Impact of key factors in 2025 and 2030

7.7 Market condition

Chart on Market condition - Five forces 2025 and 2030

8. Market Segmentation by End-user

8.1 Market segments

Chart on End-user - Market share 2025-2030 (%)
Data Table on End-user - Market share 2025-2030 (%)

8.2 Comparison by End-user

Chart on Comparison by End-user
Data Table on Comparison by End-user

8.3 Consumer electronics - Market size and forecast 2025-2030

Chart on Consumer electronics - Market size and forecast 2025-2030 ($ million)
Data Table on Consumer electronics - Market size and forecast 2025-2030 ($ million)
Chart on Consumer electronics - Year-over-year growth 2025-2030 (%)
Data Table on Consumer electronics - Year-over-year growth 2025-2030 (%)

8.4 Automotive - Market size and forecast 2025-2030

Chart on Automotive - Market size and forecast 2025-2030 ($ million)
Data Table on Automotive - Market size and forecast 2025-2030 ($ million)
Chart on Automotive - Year-over-year growth 2025-2030 (%)
Data Table on Automotive - Year-over-year growth 2025-2030 (%)

8.5 Food and beverages - Market size and forecast 2025-2030

Chart on Food and beverages - Market size and forecast 2025-2030 ($ million)
Data Table on Food and beverages - Market size and forecast 2025-2030 ($ million)
Chart on Food and beverages - Year-over-year growth 2025-2030 (%)
Data Table on Food and beverages - Year-over-year growth 2025-2030 (%)

8.6 Healthcare - Market size and forecast 2025-2030

Chart on Healthcare - Market size and forecast 2025-2030 ($ million)
Data Table on Healthcare - Market size and forecast 2025-2030 ($ million)
Chart on Healthcare - Year-over-year growth 2025-2030 (%)
Data Table on Healthcare - Year-over-year growth 2025-2030 (%)

8.7 Others - Market size and forecast 2025-2030

Chart on Others - Market size and forecast 2025-2030 ($ million)
Data Table on Others - Market size and forecast 2025-2030 ($ million)
Chart on Others - Year-over-year growth 2025-2030 (%)
Data Table on Others - Year-over-year growth 2025-2030 (%)

8.8 Market opportunity by End-user

Market opportunity by End-user ($ million)
Data Table on Market opportunity by End-user ($ million)

9. Market Segmentation by Type

9.1 Market segments

Chart on Type - Market share 2025-2030 (%)
Data Table on Type - Market share 2025-2030 (%)

9.2 Comparison by Type

Chart on Comparison by Type
Data Table on Comparison by Type

9.3 Temperature sensor - Market size and forecast 2025-2030

Chart on Temperature sensor - Market size and forecast 2025-2030 ($ million)
Data Table on Temperature sensor - Market size and forecast 2025-2030 ($ million)
Chart on Temperature sensor - Year-over-year growth 2025-2030 (%)
Data Table on Temperature sensor - Year-over-year growth 2025-2030 (%)

9.4 Pressure sensor - Market size and forecast 2025-2030

Chart on Pressure sensor - Market size and forecast 2025-2030 ($ million)
Data Table on Pressure sensor - Market size and forecast 2025-2030 ($ million)
Chart on Pressure sensor - Year-over-year growth 2025-2030 (%)
Data Table on Pressure sensor - Year-over-year growth 2025-2030 (%)

9.5 Humidity sensor - Market size and forecast 2025-2030

Chart on Humidity sensor - Market size and forecast 2025-2030 ($ million)
Data Table on Humidity sensor - Market size and forecast 2025-2030 ($ million)
Chart on Humidity sensor - Year-over-year growth 2025-2030 (%)
Data Table on Humidity sensor - Year-over-year growth 2025-2030 (%)

9.6 Flow sensor - Market size and forecast 2025-2030

Chart on Flow sensor - Market size and forecast 2025-2030 ($ million)
Data Table on Flow sensor - Market size and forecast 2025-2030 ($ million)
Chart on Flow sensor - Year-over-year growth 2025-2030 (%)
Data Table on Flow sensor - Year-over-year growth 2025-2030 (%)

9.7 Others - Market size and forecast 2025-2030

Chart on Others - Market size and forecast 2025-2030 ($ million)
Data Table on Others - Market size and forecast 2025-2030 ($ million)
Chart on Others - Year-over-year growth 2025-2030 (%)
Data Table on Others - Year-over-year growth 2025-2030 (%)

9.8 Market opportunity by Type

Market opportunity by Type ($ million)
Data Table on Market opportunity by Type ($ million)

10. Market Segmentation by Environment

10.1 Market segments

Chart on Environment - Market share 2025-2030 (%)
Data Table on Environment - Market share 2025-2030 (%)

10.2 Comparison by Environment

Chart on Comparison by Environment
Data Table on Comparison by Environment

10.3 Indoor sensor - Market size and forecast 2025-2030

Chart on Indoor sensor - Market size and forecast 2025-2030 ($ million)
Data Table on Indoor sensor - Market size and forecast 2025-2030 ($ million)
Chart on Indoor sensor - Year-over-year growth 2025-2030 (%)
Data Table on Indoor sensor - Year-over-year growth 2025-2030 (%)

10.4 Outdoor sensor - Market size and forecast 2025-2030

Chart on Outdoor sensor - Market size and forecast 2025-2030 ($ million)
Data Table on Outdoor sensor - Market size and forecast 2025-2030 ($ million)
Chart on Outdoor sensor - Year-over-year growth 2025-2030 (%)
Data Table on Outdoor sensor - Year-over-year growth 2025-2030 (%)

10.5 Market opportunity by Environment

Market opportunity by Environment ($ million)
Data Table on Market opportunity by Environment ($ million)

11. Market Segmentation by Connectivity

11.1 Market segments

Chart on Connectivity - Market share 2025-2030 (%)
Data Table on Connectivity - Market share 2025-2030 (%)

11.2 Comparison by Connectivity

Chart on Comparison by Connectivity
Data Table on Comparison by Connectivity

11.3 Wired sensor - Market size and forecast 2025-2030

Chart on Wired sensor - Market size and forecast 2025-2030 ($ million)
Data Table on Wired sensor - Market size and forecast 2025-2030 ($ million)
Chart on Wired sensor - Year-over-year growth 2025-2030 (%)
Data Table on Wired sensor - Year-over-year growth 2025-2030 (%)

11.4 Wireless sensor - Market size and forecast 2025-2030

Chart on Wireless sensor - Market size and forecast 2025-2030 ($ million)
Data Table on Wireless sensor - Market size and forecast 2025-2030 ($ million)
Chart on Wireless sensor - Year-over-year growth 2025-2030 (%)
Data Table on Wireless sensor - Year-over-year growth 2025-2030 (%)

11.5 Market opportunity by Connectivity

Market opportunity by Connectivity ($ million)
Data Table on Market opportunity by Connectivity ($ million)

12. Customer Landscape

12.1 Customer landscape overview

Analysis of price sensitivity, lifecycle, customer purchase basket, adoption rates, and purchase criteria

13. Geographic Landscape

13.1 Geographic segmentation

Chart on Market share by geography 2025-2030 (%)
Data Table on Market share by geography 2025-2030 (%)

13.2 Geographic comparison

Chart on Geographic comparison
Data Table on Geographic comparison

13.3 North America - Market size and forecast 2025-2030

Chart on North America - Market size and forecast 2025-2030 ($ million)
Data Table on North America - Market size and forecast 2025-2030 ($ million)
Chart on North America - Year-over-year growth 2025-2030 (%)
Data Table on North America - Year-over-year growth 2025-2030 (%)
Chart on Regional Comparison - North America
Data Table on Regional Comparison - North America

13.3.1 US - Market size and forecast 2025-2030

Chart on US - Market size and forecast 2025-2030 ($ million)
Data Table on US - Market size and forecast 2025-2030 ($ million)
Chart on US - Year-over-year growth 2025-2030 (%)
Data Table on US - Year-over-year growth 2025-2030 (%)

13.3.2 Canada - Market size and forecast 2025-2030

Chart on Canada - Market size and forecast 2025-2030 ($ million)
Data Table on Canada - Market size and forecast 2025-2030 ($ million)
Chart on Canada - Year-over-year growth 2025-2030 (%)
Data Table on Canada - Year-over-year growth 2025-2030 (%)

13.3.3 Mexico - Market size and forecast 2025-2030

Chart on Mexico - Market size and forecast 2025-2030 ($ million)
Data Table on Mexico - Market size and forecast 2025-2030 ($ million)
Chart on Mexico - Year-over-year growth 2025-2030 (%)
Data Table on Mexico - Year-over-year growth 2025-2030 (%)

13.4 Europe - Market size and forecast 2025-2030

Chart on Europe - Market size and forecast 2025-2030 ($ million)
Data Table on Europe - Market size and forecast 2025-2030 ($ million)
Chart on Europe - Year-over-year growth 2025-2030 (%)
Data Table on Europe - Year-over-year growth 2025-2030 (%)
Chart on Regional Comparison - Europe
Data Table on Regional Comparison - Europe

13.4.1 Germany - Market size and forecast 2025-2030

Chart on Germany - Market size and forecast 2025-2030 ($ million)
Data Table on Germany - Market size and forecast 2025-2030 ($ million)
Chart on Germany - Year-over-year growth 2025-2030 (%)
Data Table on Germany - Year-over-year growth 2025-2030 (%)

13.4.2 UK - Market size and forecast 2025-2030

Chart on UK - Market size and forecast 2025-2030 ($ million)
Data Table on UK - Market size and forecast 2025-2030 ($ million)
Chart on UK - Year-over-year growth 2025-2030 (%)
Data Table on UK - Year-over-year growth 2025-2030 (%)

13.4.3 France - Market size and forecast 2025-2030

Chart on France - Market size and forecast 2025-2030 ($ million)
Data Table on France - Market size and forecast 2025-2030 ($ million)
Chart on France - Year-over-year growth 2025-2030 (%)
Data Table on France - Year-over-year growth 2025-2030 (%)

13.4.4 Italy - Market size and forecast 2025-2030

Chart on Italy - Market size and forecast 2025-2030 ($ million)
Data Table on Italy - Market size and forecast 2025-2030 ($ million)
Chart on Italy - Year-over-year growth 2025-2030 (%)
Data Table on Italy - Year-over-year growth 2025-2030 (%)

13.4.5 Spain - Market size and forecast 2025-2030

Chart on Spain - Market size and forecast 2025-2030 ($ million)
Data Table on Spain - Market size and forecast 2025-2030 ($ million)
Chart on Spain - Year-over-year growth 2025-2030 (%)
Data Table on Spain - Year-over-year growth 2025-2030 (%)

13.4.6 The Netherlands - Market size and forecast 2025-2030

Chart on The Netherlands - Market size and forecast 2025-2030 ($ million)
Data Table on The Netherlands - Market size and forecast 2025-2030 ($ million)
Chart on The Netherlands - Year-over-year growth 2025-2030 (%)
Data Table on The Netherlands - Year-over-year growth 2025-2030 (%)

13.5 APAC - Market size and forecast 2025-2030

Chart on APAC - Market size and forecast 2025-2030 ($ million)
Data Table on APAC - Market size and forecast 2025-2030 ($ million)
Chart on APAC - Year-over-year growth 2025-2030 (%)
Data Table on APAC - Year-over-year growth 2025-2030 (%)
Chart on Regional Comparison - APAC
Data Table on Regional Comparison - APAC

13.5.1 China - Market size and forecast 2025-2030

Chart on China - Market size and forecast 2025-2030 ($ million)
Data Table on China - Market size and forecast 2025-2030 ($ million)
Chart on China - Year-over-year growth 2025-2030 (%)
Data Table on China - Year-over-year growth 2025-2030 (%)

13.5.2 Japan - Market size and forecast 2025-2030

Chart on Japan - Market size and forecast 2025-2030 ($ million)
Data Table on Japan - Market size and forecast 2025-2030 ($ million)
Chart on Japan - Year-over-year growth 2025-2030 (%)
Data Table on Japan - Year-over-year growth 2025-2030 (%)

13.5.3 India - Market size and forecast 2025-2030

Chart on India - Market size and forecast 2025-2030 ($ million)
Data Table on India - Market size and forecast 2025-2030 ($ million)
Chart on India - Year-over-year growth 2025-2030 (%)
Data Table on India - Year-over-year growth 2025-2030 (%)

13.5.4 South Korea - Market size and forecast 2025-2030

Chart on South Korea - Market size and forecast 2025-2030 ($ million)
Data Table on South Korea - Market size and forecast 2025-2030 ($ million)
Chart on South Korea - Year-over-year growth 2025-2030 (%)
Data Table on South Korea - Year-over-year growth 2025-2030 (%)

13.5.5 Australia - Market size and forecast 2025-2030

Chart on Australia - Market size and forecast 2025-2030 ($ million)
Data Table on Australia - Market size and forecast 2025-2030 ($ million)
Chart on Australia - Year-over-year growth 2025-2030 (%)
Data Table on Australia - Year-over-year growth 2025-2030 (%)

13.5.6 Indonesia - Market size and forecast 2025-2030

Chart on Indonesia - Market size and forecast 2025-2030 ($ million)
Data Table on Indonesia - Market size and forecast 2025-2030 ($ million)
Chart on Indonesia - Year-over-year growth 2025-2030 (%)
Data Table on Indonesia - Year-over-year growth 2025-2030 (%)

13.6 South America - Market size and forecast 2025-2030

Chart on South America - Market size and forecast 2025-2030 ($ million)
Data Table on South America - Market size and forecast 2025-2030 ($ million)
Chart on South America - Year-over-year growth 2025-2030 (%)
Data Table on South America - Year-over-year growth 2025-2030 (%)
Chart on Regional Comparison - South America
Data Table on Regional Comparison - South America

13.6.1 Brazil - Market size and forecast 2025-2030

Chart on Brazil - Market size and forecast 2025-2030 ($ million)
Data Table on Brazil - Market size and forecast 2025-2030 ($ million)
Chart on Brazil - Year-over-year growth 2025-2030 (%)
Data Table on Brazil - Year-over-year growth 2025-2030 (%)

13.6.2 Argentina - Market size and forecast 2025-2030

Chart on Argentina - Market size and forecast 2025-2030 ($ million)
Data Table on Argentina - Market size and forecast 2025-2030 ($ million)
Chart on Argentina - Year-over-year growth 2025-2030 (%)
Data Table on Argentina - Year-over-year growth 2025-2030 (%)

13.6.3 Chile - Market size and forecast 2025-2030

Chart on Chile - Market size and forecast 2025-2030 ($ million)
Data Table on Chile - Market size and forecast 2025-2030 ($ million)
Chart on Chile - Year-over-year growth 2025-2030 (%)
Data Table on Chile - Year-over-year growth 2025-2030 (%)

13.7 Middle East and Africa - Market size and forecast 2025-2030

Chart on Middle East and Africa - Market size and forecast 2025-2030 ($ million)
Data Table on Middle East and Africa - Market size and forecast 2025-2030 ($ million)
Chart on Middle East and Africa - Year-over-year growth 2025-2030 (%)
Data Table on Middle East and Africa - Year-over-year growth 2025-2030 (%)
Chart on Regional Comparison - Middle East and Africa
Data Table on Regional Comparison - Middle East and Africa

13.7.1 Saudi Arabia - Market size and forecast 2025-2030

Chart on Saudi Arabia - Market size and forecast 2025-2030 ($ million)
Data Table on Saudi Arabia - Market size and forecast 2025-2030 ($ million)
Chart on Saudi Arabia - Year-over-year growth 2025-2030 (%)
Data Table on Saudi Arabia - Year-over-year growth 2025-2030 (%)

13.7.2 UAE - Market size and forecast 2025-2030

Chart on UAE - Market size and forecast 2025-2030 ($ million)
Data Table on UAE - Market size and forecast 2025-2030 ($ million)
Chart on UAE - Year-over-year growth 2025-2030 (%)
Data Table on UAE - Year-over-year growth 2025-2030 (%)

13.7.3 South Africa - Market size and forecast 2025-2030

Chart on South Africa - Market size and forecast 2025-2030 ($ million)
Data Table on South Africa - Market size and forecast 2025-2030 ($ million)
Chart on South Africa - Year-over-year growth 2025-2030 (%)
Data Table on South Africa - Year-over-year growth 2025-2030 (%)

13.7.4 Israel - Market size and forecast 2025-2030

Chart on Israel - Market size and forecast 2025-2030 ($ million)
Data Table on Israel - Market size and forecast 2025-2030 ($ million)
Chart on Israel - Year-over-year growth 2025-2030 (%)
Data Table on Israel - Year-over-year growth 2025-2030 (%)

13.7.5 Turkey - Market size and forecast 2025-2030

Chart on Turkey - Market size and forecast 2025-2030 ($ million)
Data Table on Turkey - Market size and forecast 2025-2030 ($ million)
Chart on Turkey - Year-over-year growth 2025-2030 (%)
Data Table on Turkey - Year-over-year growth 2025-2030 (%)

13.8 Market opportunity by geography

Market opportunity by geography ($ million)
Data Tables on Market opportunity by geography ($ million)

14. Drivers, Challenges, and Opportunity

14.1 Market drivers

Accelerating adoption of edge computing and embedded AI analytics
Proliferation of smart factory automation and predictive asset maintenance regimes
Strict global sustainability regulations and corporate decarbonization governance frameworks

14.2 Market challenges

Severe data security risks and distributed network vulnerabilities
Interoperability bottlenecks and fragmented communication standards
Power management constraints and battery maintenance overhead

14.3 Impact of drivers and challenges

Impact of drivers and challenges in 2025 and 2030

14.4 Market opportunities

Growth in precision agriculture and environmental monitoring
Advancement of connected automotive and autonomous mobility
Expansion of smart grid infrastructure and energy management

15. Competitive Landscape

15.1 Overview

15.2

Overview on criticality of inputs and factors of differentiation

15.3 Landscape disruption

Overview on factors of disruption

15.4 Industry risks

Impact of key risks on business

16. Competitive Analysis

16.1 Companies profiled

Companies covered

16.2 Company ranking index

16.3 Market positioning of companies

Matrix on companies position and classification

16.4 Amphenol Corp.

Amphenol Corp. - Overview
Amphenol Corp. - Business segments
Amphenol Corp. - Key news
Amphenol Corp. - Key offerings
Amphenol Corp. - Segment focus
SWOT

16.5 Analog Devices Inc.

Analog Devices Inc. - Overview
Analog Devices Inc. - Business segments
Analog Devices Inc. - Key news
Analog Devices Inc. - Key offerings
Analog Devices Inc. - Segment focus
SWOT

16.6 Broadcom Inc.

Broadcom Inc. - Overview
Broadcom Inc. - Business segments
Broadcom Inc. - Key news
Broadcom Inc. - Key offerings
Broadcom Inc. - Segment focus
SWOT

16.7 Honeywell International Inc.

Honeywell International Inc. - Overview
Honeywell International Inc. - Business segments
Honeywell International Inc. - Key news
Honeywell International Inc. - Key offerings
Honeywell International Inc. - Segment focus
SWOT

16.8 Infineon Technologies AG

Infineon Technologies AG - Overview
Infineon Technologies AG - Business segments
Infineon Technologies AG - Key news
Infineon Technologies AG - Key offerings
Infineon Technologies AG - Segment focus
SWOT

16.9 Microchip Technology Inc.

Microchip Technology Inc. - Overview
Microchip Technology Inc. - Business segments
Microchip Technology Inc. - Key offerings
Microchip Technology Inc. - Segment focus
SWOT

16.10 Murata Manufacturing Co. Ltd.

Murata Manufacturing Co. Ltd. - Overview
Murata Manufacturing Co. Ltd. - Business segments
Murata Manufacturing Co. Ltd. - Key news
Murata Manufacturing Co. Ltd. - Key offerings
Murata Manufacturing Co. Ltd. - Segment focus
SWOT

16.11 NXP Semiconductors NV

NXP Semiconductors NV - Overview
NXP Semiconductors NV - Business segments
NXP Semiconductors NV - Key news
NXP Semiconductors NV - Key offerings
NXP Semiconductors NV - Segment focus
SWOT

16.12 OMRON Corp.

OMRON Corp. - Overview
OMRON Corp. - Business segments
OMRON Corp. - Key offerings
OMRON Corp. - Segment focus
SWOT

16.13 Panasonic Holdings Corp.

Panasonic Holdings Corp. - Overview
Panasonic Holdings Corp. - Business segments
Panasonic Holdings Corp. - Key news
Panasonic Holdings Corp. - Key offerings
Panasonic Holdings Corp. - Segment focus
SWOT

16.14 Sensirion AG

Sensirion AG - Overview
Sensirion AG - Product / Service
Sensirion AG - Key news
Sensirion AG - Key offerings
SWOT

16.15 Sony Group Corp.

Sony Group Corp. - Overview
Sony Group Corp. - Business segments
Sony Group Corp. - Key news
Sony Group Corp. - Key offerings
Sony Group Corp. - Segment focus
SWOT

16.16 STMicroelectronics NV

STMicroelectronics NV - Overview
STMicroelectronics NV - Business segments
STMicroelectronics NV - Key news
STMicroelectronics NV - Key offerings
STMicroelectronics NV - Segment focus
SWOT

16.17 TDK Corp.

TDK Corp. - Overview
TDK Corp. - Business segments
TDK Corp. - Key offerings
TDK Corp. - Segment focus
SWOT

16.18 TE Connectivity plc

TE Connectivity plc - Overview
TE Connectivity plc - Business segments
TE Connectivity plc - Key offerings
TE Connectivity plc - Segment focus
SWOT

17. Appendix

17.1 Scope of the report

Market definition
Objectives
Notes and caveats

17.2 Inclusions and exclusions checklist

Inclusions checklist
Exclusions checklist

17.3 Currency conversion rates for US$

17.4 Research methodology

17.5 Data procurement

Information sources

17.6 Data validation

17.7 Validation techniques employed for market sizing

17.8 Data synthesis

17.9 360 degree market analysis

17.10 List of abbreviations

Research Methodology

Technavio presents a detailed picture of the market by way of study, synthesis, and summation of data from multiple sources. The analysts have presented the various facets of the market with a particular focus on identifying the key industry influencers. The data thus presented is comprehensive, reliable, and the result of extensive research, both primary and secondary.

INFORMATION SOURCES

Primary sources

  • Manufacturers and suppliers
  • Channel partners
  • Industry experts
  • Strategic decision makers

Secondary sources

  • Industry journals and periodicals
  • Government data
  • Financial reports of key industry players
  • Historical data
  • Press releases

DATA ANALYSIS

Data Synthesis

  • Collation of data
  • Estimation of key figures
  • Analysis of derived insights

Data Validation

  • Triangulation with data models
  • Reference against proprietary databases
  • Corroboration with industry experts

REPORT WRITING

Qualitative

  • Market drivers
  • Market challenges
  • Market trends
  • Five forces analysis

Quantitative

  • Market size and forecast
  • Market segmentation
  • Geographical insights
  • Competitive landscape

Interested in this report?

Get your sample now to see our research methodology and insights!

Download Now

Frequently Asked Questions

Internet Of Things (Iot) Sensors market growth will increase by USD 91377.0 million during 2026-2030.

The Internet Of Things (Iot) Sensors market is expected to grow at a CAGR of 37.2% during 2026-2030.

Internet Of Things (Iot) Sensors market is segmented by End-user (Consumer electronics, Automotive, Food and beverages, Healthcare, Others) Type (Temperature sensor, Pressure sensor, Humidity sensor, Flow sensor, Others) Environment (Indoor sensor, Outdoor sensor) Connectivity (Wired sensor, Wireless sensor)

Amphenol Corp., Analog Devices Inc., Broadcom Inc., Honeywell International Inc., Infineon Technologies AG, Knowles Corp., Melexis NV, Microchip Technology Inc., Murata Manufacturing Co. Ltd., NXP Semiconductors NV, OMRON Corp., Panasonic Holdings Corp., Renesas Electronics Corp., Samsung Electronics Co. Ltd., Sensirion AG, Silicon Laboratories Inc., Sony Group Corp., STMicroelectronics NV, TDK Corp., TE Connectivity plc are a few of the key vendors in the Internet Of Things (Iot) Sensors market.

North America will register the highest growth rate of 42.2% among the other regions. Therefore, the Internet Of Things (Iot) Sensors market in North America is expected to garner significant business opportunities for the vendors during the forecast period.

US, Canada, Mexico, Germany, UK, France, Italy, Spain, The Netherlands, China, Japan, India, South Korea, Australia, Indonesia, Brazil, Argentina, Chile, Saudi Arabia, UAE, South Africa, Israel, Turkey

  • Accelerating adoption of edge computing and embedded AI analytics is the driving factor this market.

The Internet Of Things (Iot) Sensors market vendors should focus on grabbing business opportunities from the End-user segment as it accounted for the largest market share in the base year.
RIA - Research AI Assistant
Ask RIA