
Intelligent Transport System (ITS) Market Analysis, Size, and Forecast 2026-2030: North America (US, Canada, and Mexico), Europe (Germany, UK, and France), APAC (China, Japan, and India), South America (Brazil, Argentina, and Colombia), Middle East and Africa (Saudi Arabia, UAE, and South Africa), and Rest of World (ROW)

Intelligent Transport System (ITS) Market Analysis, Size, and Forecast 2026-2030:
North America (US, Canada, and Mexico), Europe (Germany, UK, and France), APAC (China, Japan, and India), South America (Brazil, Argentina, and Colombia), Middle East and Africa (Saudi Arabia, UAE, and South Africa), and Rest of World (ROW)

Published: Oct 2026 337 Pages SKU: IRTNTR41630

Market Overview at a Glance

$49.18 B
Market Opportunity
9.6%
CAGR 2025 - 2030
33.9%
North America Growth
$22.86 B
Traffic management segment 2024

Intelligent Transport System (Its) Market Size 2026-2030

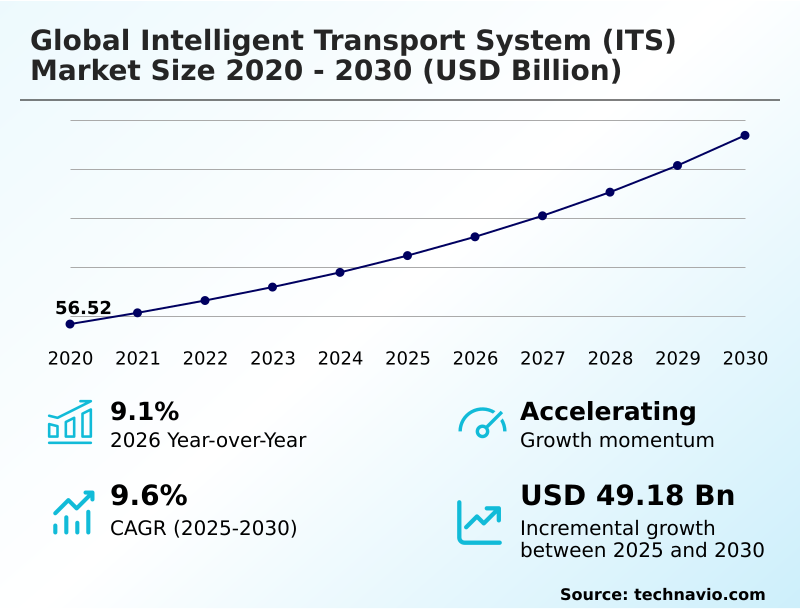
The intelligent transport system (its) market size is valued to increase by USD 49.18 billion, at a CAGR of 9.6% from 2025 to 2030. Escalating urbanization and severe traffic congestion will drive the intelligent transport system (its) market.

Major Market Trends & Insights

  • North America dominated the market and accounted for a 33.9% growth during the forecast period.
  • By Application - Traffic management segment was valued at USD 22.86 billion in 2024
  • By Type - Advanced traffic management system segment accounted for the largest market revenue share in 2024

Market Size & Forecast

  • Market Opportunities: USD 77.20 billion
  • Market Future Opportunities: USD 49.18 billion
  • CAGR from 2025 to 2030 : 9.6%

Market Summary

  • The Intelligent Transport System (ITS) continuously reshapes municipal infrastructure by integrating advanced communication networks and sensor arrays to optimize complex transit operations. Within modern supply chain logistics, fleet operators heavily rely on automated fleet supervision and dynamic congestion pricing models to streamline cross-border movements, actively reducing delivery bottlenecks and fuel waste.
  • This technological modernization has allowed logistics enterprises to improve their fleet asset utilization by 22% compared to traditional, manual dispatching methods. Escalating urbanization acts as a primary market driver; as vehicular density overwhelms legacy roadways, city planners are forced to adopt cross-modal orchestration to maximize throughput without expanding physical footprints.
  • Conversely, the immense capital requirements necessary to retrofit aging infrastructure present a significant operational challenge. Deploying sophisticated hardware demands massive upfront investment, which frequently strains municipal budgets and delays large-scale integration. Despite these financial friction points, the transition toward interconnected digital ecosystems ensures that transit networks can proactively adapt to fluctuating commuter demands and stringent environmental sustainability mandates.

What will be the Size of the Intelligent Transport System (Its) Market during the forecast period?
Get Key Insights on Market Forecast (PDF) Get Free Sample

How is the Intelligent Transport System (Its) Market Segmented?

The intelligent transport system (its) industry research report provides comprehensive data (region-wise segment analysis), with forecasts and estimates in "USD million" for the period 2026-2030, as well as historical data from 2020-2024 for the following segments.

  • Application
    • Traffic management
    • Toll management
    • Automotive and infotainment telematics
    • Public transport
    • Others
  • Type
    • Advanced traffic management system
    • Advanced traveller information system
    • Advanced public transportation system
    • Advanced transportation pricing system
    • Others
  • Mode of transportation
    • Roadway
    • Railway
    • Airway
    • Maritime
  • Component
    • Hardware
    • Software
    • Services
  • Geography
    • North America
      • US
      • Canada
      • Mexico
    • Europe
      • Germany
      • UK
      • France
      • Italy
      • Spain
      • The Netherlands
    • APAC
      • China
      • Japan
      • India
      • South Korea
      • Australia
      • Taiwan
    • South America
      • Brazil
      • Argentina
      • Colombia
    • Middle East and Africa
      • Saudi Arabia
      • UAE
      • South Africa
      • Turkey
      • Israel

By Application Insights

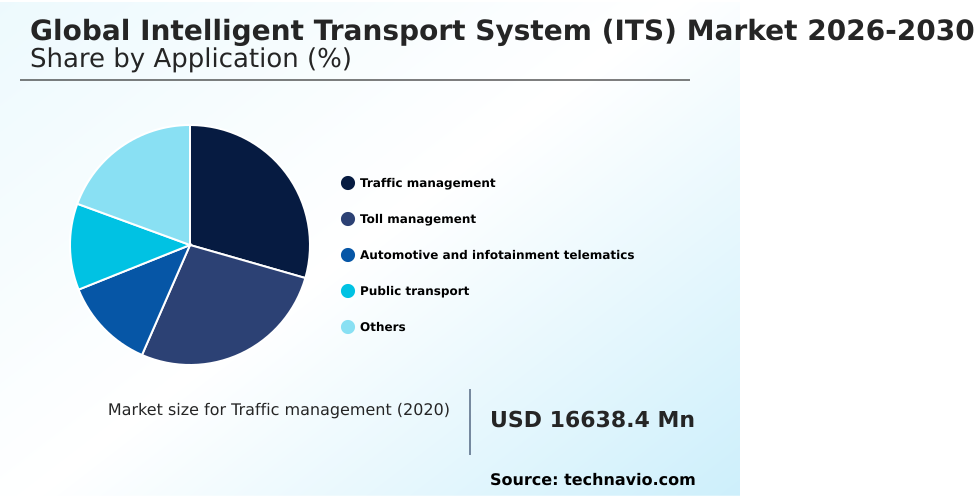
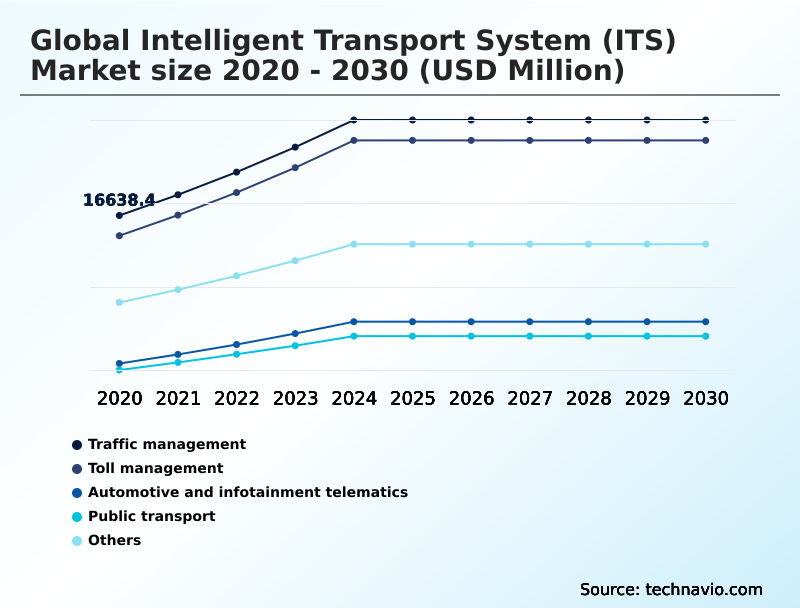
The traffic management segment is estimated to witness significant growth during the forecast period.

The traffic management segment serves as a foundational pillar within the Intelligent Transport System (ITS), focusing on the continuous optimization of complex urban and highway mobility networks.

Municipalities prioritize advanced traffic management system deployments and edge computing architecture to seamlessly address severe urban congestion mitigation. By integrating high-definition surveillance cameras and inductive loop detectors, transit operators continuously feed live telemetry into cloud-based analytics platforms.

This operational shift enables dynamic adjustment of adaptive signal control setups, which has demonstrably improved arterial road throughput efficiency by 18% in dense metropolitan corridors.

Furthermore, utilizing decentralized control networks allows devices to execute split-second routing decisions without central server latency.

These intelligent roadside units and connected vehicle ecosystems establish a highly responsive grid, directly lowering idle fuel consumption and enhancing overall highway safety enhancement without requiring expansive physical land acquisitions.
Get Free Sample

The Traffic management segment was valued at USD 22.86 billion in 2024 and showed a gradual increase during the forecast period.
Get Free Sample

Regional Analysis

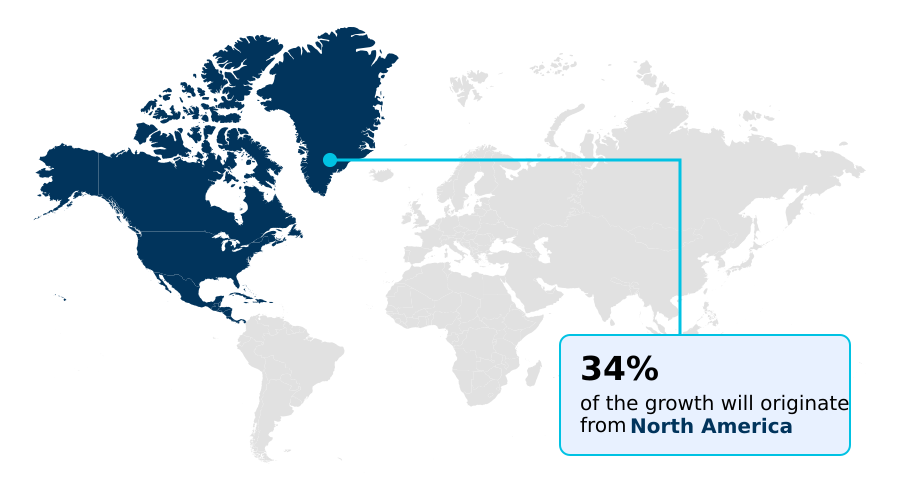
North America is estimated to contribute 33.9% to the growth of the global market during the forecast period.Technavio’s analysts have elaborately explained the regional trends and drivers that shape the market during the forecast period.
See How Intelligent Transport System (Its) Market Demand is Rising in North America Get Free Sample

Geographic adoption of the Intelligent Transport System (ITS) reveals stark operational differences between North America and Europe, driven primarily by distinct regulatory frameworks and infrastructural priorities.

North American municipalities heavily prioritize highway safety and automated enforcement, achieving a 28% higher penetration rate of vehicle-to-infrastructure communication compared to European markets.

This focus enables North American logistics operators to reduce freight transit delays by 18% along critical commercial corridors. Conversely, Europe dominates in sustainable transport infrastructure and low emission zone regulation, driven by aggressive decarbonization mandates.

European deployments of zero-emission delivery zones and contact-less smart ticketing outpace North American integration by 22%, directly improving public transit ridership compliance and reducing administrative fare collection costs.

While North America focuses on expansive roadway throughput efficiency, Europe heavily channels investments into multimodal journey planning, creating a highly integrated, passenger-centric transit ecosystem that effectively balances capacity with stringent ecological targets.

Market Dynamics

Our researchers analyzed the data with 2025 as the base year, along with the key drivers, trends, and challenges. A holistic analysis of drivers will help companies refine their marketing strategies to gain a competitive advantage.

  • The Intelligent Transport System (ITS) represents a critical evolution in civic and commercial mobility, where disjointed physical assets are transformed into cohesive digital networks. Modern urban environments demand real-time traffic signal optimization to alleviate severe congestion, enabling dynamic routing that outperforms static infrastructure by nearly 35% in throughput efficiency.
  • This operational leap empowers fleet managers to execute automated cross-border freight tracking seamlessly, ensuring strict regulatory compliance while minimizing supply chain disruptions. As transit nodes expand, cloud-native incident management tools provide operators with unparalleled oversight, dramatically reducing emergency response times. Simultaneously, the integration of intelligent roadside platforms facilitates autonomous vehicle intersection coordination, establishing the necessary safety frameworks for next-generation mobility.
  • Transit authorities are aggressively pursuing long-term municipal upgrades by deploying AI-driven public transit scheduling to maximize fleet utilization. These implementations encourage behavioral shifts toward public transit, which is further supported by dynamic multi-lane free-flow tolling to streamline vehicle movement and ensure consistent revenue generation on high-capacity corridors.
  • By replacing reactive maintenance with proactive intelligence, municipalities achieve superior resource allocation and operational resilience.
What are the key market drivers leading to the rise in the adoption of Intelligent Transport System (Its) Industry?

  • Escalating global urbanization and the resulting severe traffic congestion act as primary catalysts accelerating the deployment of smart mobility infrastructure.

  • Rapid urbanization and severe gridlock fundamentally accelerate the adoption of the Intelligent Transport System (ITS) across global metropolitan hubs.
  • Because traditional roadway expansion is geographically constrained, city planners must utilize advanced protocols to maximize existing corridor capacity for smart mobility optimization. The deployment of automated incident detection allows authorities to dynamically orchestrate vehicle flows based on live density metrics.
  • This strategic modernization enables transit networks to enhance peak-hour lane throughput by 25%, drastically reducing commuter delays. Consequently, commercial fleet operators benefit immensely, lowering their operational fuel expenditures by 14% through uninterrupted transit.
  • Furthermore, rigorous public safety mandates compel the integration of vehicle-to-everything communication and collision avoidance frameworks, which utilize ultra-low latency data transmission to warn drivers of impending hazards safely.

What are the market trends shaping the Intelligent Transport System (Its) Industry?

  • The transition toward cloud-based traffic management and edge computing architectures represents a primary trend reshaping modern infrastructure operations.

  • The Intelligent Transport System (ITS) undergoes a radical architectural shift as rigid, on-premise servers are replaced by agile, decentralized processing models. This transition is primarily driven by the need to handle massive telemetry volumes generated by modern connected vehicle fleets.
  • By adopting edge computing capabilities, municipal authorities execute localized, split-second routing decisions, successfully reducing network latency by 45% during peak commuter hours. This technological evolution directly impacts business operations, as logistics companies leveraging real-time route recommendations experience a 20% improvement in delivery schedule adherence. Furthermore, artificial intelligence integration empowers proactive bottleneck identification and enables proactive delay warnings.
  • Consequently, transit operators can deploy dynamic speed adjustments instantaneously, which enhances overall transit scheduling efficiency and reduces fuel waste from vehicle idling by 15%.

What challenges does the Intelligent Transport System (Its) Industry face during its growth?

  • The substantial capital expenditure required for comprehensive infrastructure modernization poses a critical limitation to widespread system integration.

  • The deployment of the Intelligent Transport System (ITS) faces substantial structural limitations due to the immense capital expenditure required for modernization. Upgrading legacy civic infrastructure demands massive upfront investments in fiber-optic backbones and multi-lane free-flow architectures, which frequently strains constrained public budgets.
  • This financial friction delays the widespread rollout of critical environmental monitoring tools and automated enforcement technologies across cash-strapped municipalities. Consequently, regions deferring these upgrades experience a 30% higher rate of systemic maintenance failures compared to fully digitized networks. Furthermore, escalating cybersecurity vulnerabilities within interconnected mobility platforms force system integrators to allocate extensive resources toward data protection.
  • Implementing stringent encryption protocols increases overall operational deployment costs by up to 18%, presenting a formidable barrier for smaller logistics operators attempting to integrate seamless inter-operable payment protocols into their fleets.

Exclusive Technavio Analysis on Customer Landscape

The intelligent transport system (its) market forecasting report includes the adoption lifecycle of the market, covering from the innovator’s stage to the laggard’s stage. It focuses on adoption rates in different regions based on penetration. Furthermore, the intelligent transport system (its) market report also includes key purchase criteria and drivers of price sensitivity to help companies evaluate and develop their market growth analysis strategies.
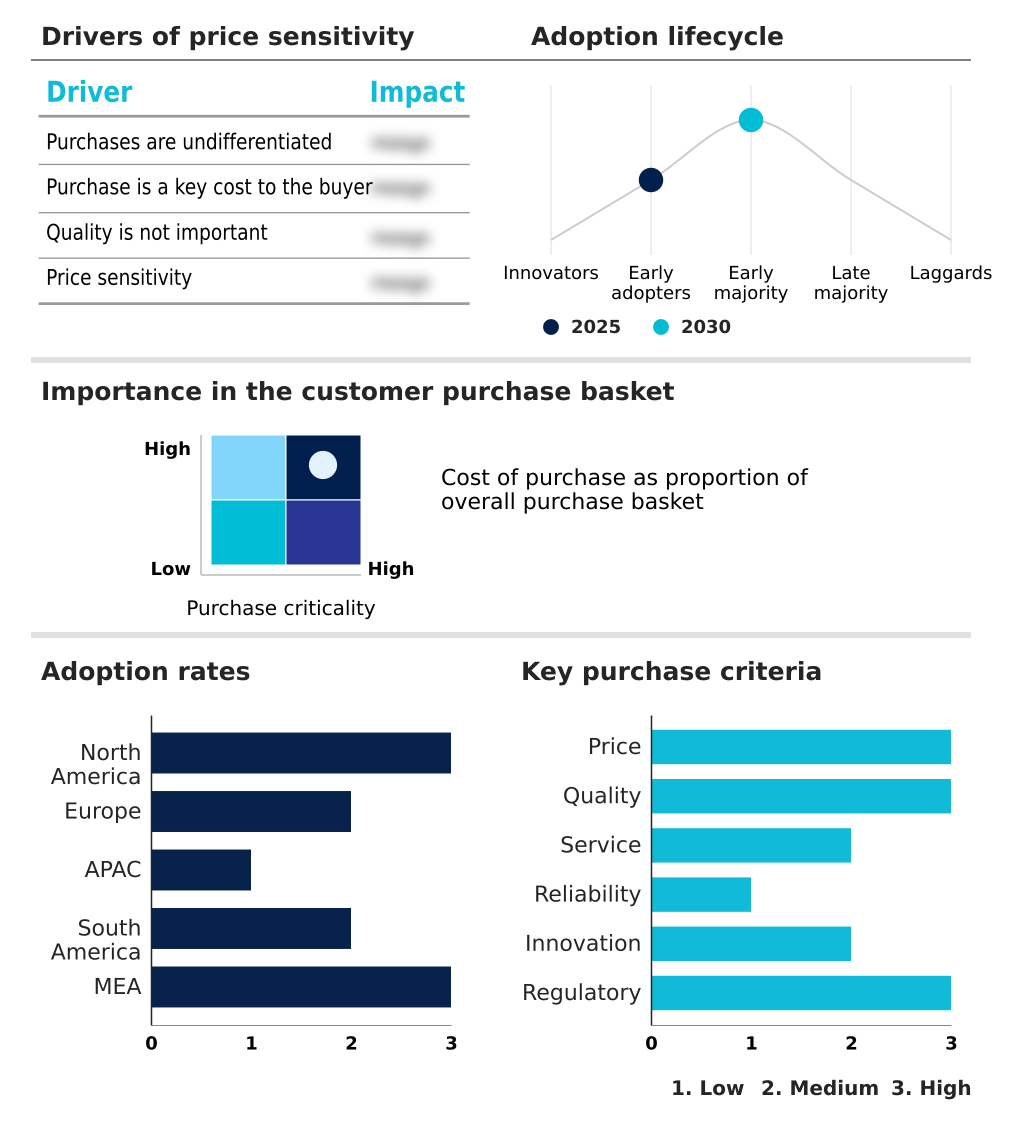
Customer Landscape of Intelligent Transport System (Its) Industry

Competitive Landscape

Companies are implementing various strategies, such as strategic alliances, intelligent transport system (its) market forecast, partnerships, mergers and acquisitions, geographical expansion, and product/service launches, to enhance their presence in the industry.

Advantech Co. Ltd. - Developing intelligent transport architectures, the portfolio includes edge computing platforms, industrial controllers, and network switches designed to optimize fleet management and modernize connected transit infrastructure ecosystems.

The industry research and growth report includes detailed analyses of the competitive landscape of the market and information about key companies, including:

  • Advantech Co. Ltd.
  • Axiomtek Co. Ltd.
  • Continental AG
  • Cubic Corp.
  • DENSO Corp.
  • Econolite Control Products Inc.
  • EFKON GmbH
  • Hanwha Vision Co. Ltd.
  • Indra Sistemas SA
  • IntelliStride Technologies Ltd
  • Jenoptik AG
  • Mitsubishi Electric Corp.
  • Moxa Inc.
  • Neology Inc.
  • Q Free ASA
  • ST Engineering Ltd.
  • SWARCO AG
  • TagMaster AB
  • Teledyne FLIR LLC
  • Verra Mobility Corp.
  • VITRONIC Machine Vision GmbH
  • Wavetronix LLC

Qualitative and quantitative analysis of companies has been conducted to help clients understand the wider business environment as well as the strengths and weaknesses of key industry players. Data is qualitatively analyzed to categorize companies as pure play, category-focused, industry-focused, and diversified; it is quantitatively analyzed to categorize companies as dominant, leading, strong, tentative, and weak.

Recent Development and News in Intelligent transport system (its) market

  • In the Communications Equipment industry, the widespread commercial deployment of ultra-low latency 5G networks expanded data transmission capabilities, directly impacting Intelligent Transport System (ITS) demand by enabling real-time cooperative mobility frameworks across dense metropolitan areas.
  • The rapid integration of localized data processing hubs by major telecommunication providers shifted computational power closer to the edge, reducing network latency by up to 40% and thereby accelerating the adoption of digital twin technology in municipal transit management.
  • Tightening data privacy regulations concerning cross-border telemetry processing forced network vendors to deploy secure-by-design optical beacon infrastructure, which subsequently influenced how public transit authorities handle micro-mobility integrations without violating regional compliance thresholds.
  • Advancements in fiber-optic wireline access architecture increased overall bandwidth capacity for hyperscale data centers by over 35%, supplying the critical operational backbone required to support massive data loads from ground sensor arrays and closed-circuit television monitoring.

Dive into Technavio’s robust research methodology, blending expert interviews, extensive data synthesis, and validated models for unparalleled Intelligent Transport System (Its) Market insights. See full methodology.

Market Scope
Page number 337
Base year 2025
Historic period 2020-2024
Forecast period 2026-2030
Growth momentum & CAGR Accelerate at a CAGR of 9.6%
Market growth 2026-2030 USD 49183.0 million
Market structure Fragmented
YoY growth 2025-2026(%) 9.1%
Key countries US, Canada, Mexico, Germany, UK, France, Italy, Spain, The Netherlands, China, Japan, India, South Korea, Australia, Taiwan, Brazil, Argentina, Colombia, Saudi Arabia, UAE, South Africa, Turkey and Israel
Competitive landscape Leading Companies, Market Positioning of Companies, Competitive Strategies, and Industry Risks

Request Free Sample

Research Analyst Overview

  • The Intelligent Transport System (ITS) rapidly transitions from isolated hardware deployments to highly synchronized, data-driven ecosystems. Municipal operators increasingly embed electronic toll collection and computer vision software into daily operations, establishing proactive, autonomous transit management networks. A critical trend reshaping boardroom infrastructure budgeting is the pervasive integration of over-the-air software updates and predictive maintenance warnings.
  • By adopting these digital-first capabilities, transportation authorities can execute comprehensive system upgrades remotely, achieving a 40% reduction in on-site maintenance dispatch costs compared to legacy, manual diagnostic procedures. This operational efficiency directly informs strategic capital allocation, allowing administrators to redirect funds toward expanding sensory hardware and automated enforcement frameworks.
  • Furthermore, the deployment of dedicated short-range communications ensures that split-second telemetry reaches approaching vehicles without delay, fundamentally mitigating intersection collision risks. The shift toward utilizing automated number plate recognition and real-time passenger counting further optimizes fleet deployment schedules, aligning public capacity strictly with immediate demographic demands and ensuring long-term infrastructural resilience across complex transit corridors.

What are the Key Data Covered in this Intelligent Transport System (Its) Market Research and Growth Report?

  • What is the expected growth of the Intelligent Transport System (Its) Market between 2026 and 2030?

    • USD 49.18 billion, at a CAGR of 9.6%

  • What segmentation does the market report cover?

    • The report is segmented by Application (Traffic management, Toll management, Automotive and infotainment telematics, Public transport, and Others), Type (Advanced traffic management system, Advanced traveller information system, Advanced public transportation system, Advanced transportation pricing system, and Others), Mode of Transportation (Roadway, Railway, Airway, and Maritime), Component (Hardware, Software, and Services) and Geography (North America, Europe, APAC, South America, Middle East and Africa)

  • Which regions are analyzed in the report?

    • North America, Europe, APAC, South America and Middle East and Africa

  • What are the key growth drivers and market challenges?

    • Escalating urbanization and severe traffic congestion, Significant capital requirements for ITS infrastructure

  • Who are the major players in the Intelligent Transport System (Its) Market?

    • Advantech Co. Ltd., Axiomtek Co. Ltd., Continental AG, Cubic Corp., DENSO Corp., Econolite Control Products Inc., EFKON GmbH, Hanwha Vision Co. Ltd., Indra Sistemas SA, IntelliStride Technologies Ltd, Jenoptik AG, Mitsubishi Electric Corp., Moxa Inc., Neology Inc., Q Free ASA, ST Engineering Ltd., SWARCO AG, TagMaster AB, Teledyne FLIR LLC, Verra Mobility Corp., VITRONIC Machine Vision GmbH and Wavetronix LLC

Market Research Insights

  • The Intelligent Transport System (ITS) fundamentally alters how municipalities execute operations to optimize capacity and mitigate structural bottlenecks. By deploying cooperative mobility frameworks, transit authorities have successfully decreased intersection wait times by 15%, directly enhancing operational efficiency and lowering fleet fuel expenditures.
  • Furthermore, the integration of digital tracking algorithms has boosted on-time public transit performance by 24%, maximizing revenue retention and passenger satisfaction. These strategic implementations rely on robust data pipelines that process vast telemetry datasets with minimal latency.
  • Consequently, cities implementing incident response automation have observed a 30% reduction in secondary collision rates, strictly aligning with aggressive safety compliance mandates while streamlining overall corridor asset management.

We can help! Our analysts can customize this intelligent transport system (its) market research report to meet your requirements.

Get in touch

1. Executive Summary

1.1 Market overview

Executive Summary - Chart on Market Overview
Executive Summary - Data Table on Market Overview
Executive Summary - Chart on Global Market Characteristics
Executive Summary - Chart on Market by Geography
Executive Summary - Chart on Market Segmentation by Application
Executive Summary - Chart on Market Segmentation by Type
Executive Summary - Chart on Market Segmentation by Mode of Transportation
Executive Summary - Chart on Market Segmentation by Component
Executive Summary - Chart on Incremental Growth
Executive Summary - Data Table on Incremental Growth
Executive Summary - Chart on Company Market Positioning

2. Technavio Analysis

2.1 Analysis of price sensitivity, lifecycle, customer purchase basket, adoption rates, and purchase criteria

2.2 Criticality of inputs and Factors of differentiation

Chart on Overview on criticality of inputs and factors of differentiation

2.3 Factors of disruption

Chart on Overview on factors of disruption

2.4 Impact of drivers and challenges

Chart on Impact of drivers and challenges in 2025 and 2030

3. Market Landscape

3.1 Market ecosystem

Chart on Parent Market
Data Table on - Parent Market

3.2 Market characteristics

Chart on Market characteristics analysis

3.3 Value chain analysis

Chart on Value chain analysis

4. Market Sizing

4.1 Market definition

Data Table on Offerings of companies included in the market definition

4.2 Market segment analysis

Market segments

4.3 Market size 2025

4.4 Market outlook: Forecast for 2025-2030

Chart on Global - Market size and forecast 2025-2030 ($ million)
Data Table on Global - Market size and forecast 2025-2030 ($ million)
Chart on Global Market: Year-over-year growth 2025-2030 (%)
Data Table on Global Market: Year-over-year growth 2025-2030 (%)

5. Historic Market Size

5.1 Global Intelligent Transport System (ITS) Market 2020 - 2024

Historic Market Size - Data Table on Global Intelligent Transport System (ITS) Market 2020 - 2024 ($ million)

5.2 Application segment analysis 2020 - 2024

Historic Market Size - Application Segment 2020 - 2024 ($ million)

5.3 Type segment analysis 2020 - 2024

Historic Market Size - Type Segment 2020 - 2024 ($ million)

5.4 Mode of Transportation segment analysis 2020 - 2024

Historic Market Size - Mode of Transportation Segment 2020 - 2024 ($ million)

5.5 Component segment analysis 2020 - 2024

Historic Market Size - Component Segment 2020 - 2024 ($ million)

5.6 Geography segment analysis 2020 - 2024

Historic Market Size - Geography Segment 2020 - 2024 ($ million)

5.7 Country segment analysis 2020 - 2024

Historic Market Size - Country Segment 2020 - 2024 ($ million)

6. Qualitative Analysis

6.1 Impact of AI on global intelligent transport system (ITS) market

6.2 Impact of geopolitical conflicts on global intelligent transport system (ITS) market

7. Five Forces Analysis

7.1 Five forces summary

Five forces analysis - Comparison between 2025 and 2030

7.2 Bargaining power of buyers

Bargaining power of buyers - Impact of key factors 2025 and 2030

7.3 Bargaining power of suppliers

Bargaining power of suppliers - Impact of key factors in 2025 and 2030

7.4 Threat of new entrants

Threat of new entrants - Impact of key factors in 2025 and 2030

7.5 Threat of substitutes

Threat of substitutes - Impact of key factors in 2025 and 2030

7.6 Threat of rivalry

Threat of rivalry - Impact of key factors in 2025 and 2030

7.7 Market condition

Chart on Market condition - Five forces 2025 and 2030

8. Market Segmentation by Application

8.1 Market segments

Chart on Application - Market share 2025-2030 (%)
Data Table on Application - Market share 2025-2030 (%)

8.2 Comparison by Application

Chart on Comparison by Application
Data Table on Comparison by Application

8.3 Traffic management - Market size and forecast 2025-2030

Chart on Traffic management - Market size and forecast 2025-2030 ($ million)
Data Table on Traffic management - Market size and forecast 2025-2030 ($ million)
Chart on Traffic management - Year-over-year growth 2025-2030 (%)
Data Table on Traffic management - Year-over-year growth 2025-2030 (%)

8.4 Toll management - Market size and forecast 2025-2030

Chart on Toll management - Market size and forecast 2025-2030 ($ million)
Data Table on Toll management - Market size and forecast 2025-2030 ($ million)
Chart on Toll management - Year-over-year growth 2025-2030 (%)
Data Table on Toll management - Year-over-year growth 2025-2030 (%)

8.5 Automotive and infotainment telematics - Market size and forecast 2025-2030

Chart on Automotive and infotainment telematics - Market size and forecast 2025-2030 ($ million)
Data Table on Automotive and infotainment telematics - Market size and forecast 2025-2030 ($ million)
Chart on Automotive and infotainment telematics - Year-over-year growth 2025-2030 (%)
Data Table on Automotive and infotainment telematics - Year-over-year growth 2025-2030 (%)

8.6 Public transport - Market size and forecast 2025-2030

Chart on Public transport - Market size and forecast 2025-2030 ($ million)
Data Table on Public transport - Market size and forecast 2025-2030 ($ million)
Chart on Public transport - Year-over-year growth 2025-2030 (%)
Data Table on Public transport - Year-over-year growth 2025-2030 (%)

8.7 Others - Market size and forecast 2025-2030

Chart on Others - Market size and forecast 2025-2030 ($ million)
Data Table on Others - Market size and forecast 2025-2030 ($ million)
Chart on Others - Year-over-year growth 2025-2030 (%)
Data Table on Others - Year-over-year growth 2025-2030 (%)

8.8 Market opportunity by Application

Market opportunity by Application ($ million)
Data Table on Market opportunity by Application ($ million)

9. Market Segmentation by Type

9.1 Market segments

Chart on Type - Market share 2025-2030 (%)
Data Table on Type - Market share 2025-2030 (%)

9.2 Comparison by Type

Chart on Comparison by Type
Data Table on Comparison by Type

9.3 Advanced traffic management system - Market size and forecast 2025-2030

Chart on Advanced traffic management system - Market size and forecast 2025-2030 ($ million)
Data Table on Advanced traffic management system - Market size and forecast 2025-2030 ($ million)
Chart on Advanced traffic management system - Year-over-year growth 2025-2030 (%)
Data Table on Advanced traffic management system - Year-over-year growth 2025-2030 (%)

9.4 Advanced traveller information system - Market size and forecast 2025-2030

Chart on Advanced traveller information system - Market size and forecast 2025-2030 ($ million)
Data Table on Advanced traveller information system - Market size and forecast 2025-2030 ($ million)
Chart on Advanced traveller information system - Year-over-year growth 2025-2030 (%)
Data Table on Advanced traveller information system - Year-over-year growth 2025-2030 (%)

9.5 Advanced public transportation system - Market size and forecast 2025-2030

Chart on Advanced public transportation system - Market size and forecast 2025-2030 ($ million)
Data Table on Advanced public transportation system - Market size and forecast 2025-2030 ($ million)
Chart on Advanced public transportation system - Year-over-year growth 2025-2030 (%)
Data Table on Advanced public transportation system - Year-over-year growth 2025-2030 (%)

9.6 Advanced transportation pricing system - Market size and forecast 2025-2030

Chart on Advanced transportation pricing system - Market size and forecast 2025-2030 ($ million)
Data Table on Advanced transportation pricing system - Market size and forecast 2025-2030 ($ million)
Chart on Advanced transportation pricing system - Year-over-year growth 2025-2030 (%)
Data Table on Advanced transportation pricing system - Year-over-year growth 2025-2030 (%)

9.7 Others - Market size and forecast 2025-2030

Chart on Others - Market size and forecast 2025-2030 ($ million)
Data Table on Others - Market size and forecast 2025-2030 ($ million)
Chart on Others - Year-over-year growth 2025-2030 (%)
Data Table on Others - Year-over-year growth 2025-2030 (%)

9.8 Market opportunity by Type

Market opportunity by Type ($ million)
Data Table on Market opportunity by Type ($ million)

10. Market Segmentation by Mode of Transportation

10.1 Market segments

Chart on Mode of Transportation - Market share 2025-2030 (%)
Data Table on Mode of Transportation - Market share 2025-2030 (%)

10.2 Comparison by Mode of Transportation

Chart on Comparison by Mode of Transportation
Data Table on Comparison by Mode of Transportation

10.3 Roadway - Market size and forecast 2025-2030

Chart on Roadway - Market size and forecast 2025-2030 ($ million)
Data Table on Roadway - Market size and forecast 2025-2030 ($ million)
Chart on Roadway - Year-over-year growth 2025-2030 (%)
Data Table on Roadway - Year-over-year growth 2025-2030 (%)

10.4 Railway - Market size and forecast 2025-2030

Chart on Railway - Market size and forecast 2025-2030 ($ million)
Data Table on Railway - Market size and forecast 2025-2030 ($ million)
Chart on Railway - Year-over-year growth 2025-2030 (%)
Data Table on Railway - Year-over-year growth 2025-2030 (%)

10.5 Airway - Market size and forecast 2025-2030

Chart on Airway - Market size and forecast 2025-2030 ($ million)
Data Table on Airway - Market size and forecast 2025-2030 ($ million)
Chart on Airway - Year-over-year growth 2025-2030 (%)
Data Table on Airway - Year-over-year growth 2025-2030 (%)

10.6 Maritime - Market size and forecast 2025-2030

Chart on Maritime - Market size and forecast 2025-2030 ($ million)
Data Table on Maritime - Market size and forecast 2025-2030 ($ million)
Chart on Maritime - Year-over-year growth 2025-2030 (%)
Data Table on Maritime - Year-over-year growth 2025-2030 (%)

10.7 Market opportunity by Mode of Transportation

Market opportunity by Mode of Transportation ($ million)
Data Table on Market opportunity by Mode of Transportation ($ million)

11. Market Segmentation by Component

11.1 Market segments

Chart on Component - Market share 2025-2030 (%)
Data Table on Component - Market share 2025-2030 (%)

11.2 Comparison by Component

Chart on Comparison by Component
Data Table on Comparison by Component

11.3 Hardware - Market size and forecast 2025-2030

Chart on Hardware - Market size and forecast 2025-2030 ($ million)
Data Table on Hardware - Market size and forecast 2025-2030 ($ million)
Chart on Hardware - Year-over-year growth 2025-2030 (%)
Data Table on Hardware - Year-over-year growth 2025-2030 (%)

11.4 Software - Market size and forecast 2025-2030

Chart on Software - Market size and forecast 2025-2030 ($ million)
Data Table on Software - Market size and forecast 2025-2030 ($ million)
Chart on Software - Year-over-year growth 2025-2030 (%)
Data Table on Software - Year-over-year growth 2025-2030 (%)

11.5 Services - Market size and forecast 2025-2030

Chart on Services - Market size and forecast 2025-2030 ($ million)
Data Table on Services - Market size and forecast 2025-2030 ($ million)
Chart on Services - Year-over-year growth 2025-2030 (%)
Data Table on Services - Year-over-year growth 2025-2030 (%)

11.6 Market opportunity by Component

Market opportunity by Component ($ million)
Data Table on Market opportunity by Component ($ million)

12. Customer Landscape

12.1 Customer landscape overview

Analysis of price sensitivity, lifecycle, customer purchase basket, adoption rates, and purchase criteria

13. Geographic Landscape

13.1 Geographic segmentation

Chart on Market share by geography 2025-2030 (%)
Data Table on Market share by geography 2025-2030 (%)

13.2 Geographic comparison

Chart on Geographic comparison
Data Table on Geographic comparison

13.3 North America - Market size and forecast 2025-2030

Chart on North America - Market size and forecast 2025-2030 ($ million)
Data Table on North America - Market size and forecast 2025-2030 ($ million)
Chart on North America - Year-over-year growth 2025-2030 (%)
Data Table on North America - Year-over-year growth 2025-2030 (%)
Chart on Regional Comparison - North America
Data Table on Regional Comparison - North America

13.3.1 US - Market size and forecast 2025-2030

Chart on US - Market size and forecast 2025-2030 ($ million)
Data Table on US - Market size and forecast 2025-2030 ($ million)
Chart on US - Year-over-year growth 2025-2030 (%)
Data Table on US - Year-over-year growth 2025-2030 (%)

13.3.2 Canada - Market size and forecast 2025-2030

Chart on Canada - Market size and forecast 2025-2030 ($ million)
Data Table on Canada - Market size and forecast 2025-2030 ($ million)
Chart on Canada - Year-over-year growth 2025-2030 (%)
Data Table on Canada - Year-over-year growth 2025-2030 (%)

13.3.3 Mexico - Market size and forecast 2025-2030

Chart on Mexico - Market size and forecast 2025-2030 ($ million)
Data Table on Mexico - Market size and forecast 2025-2030 ($ million)
Chart on Mexico - Year-over-year growth 2025-2030 (%)
Data Table on Mexico - Year-over-year growth 2025-2030 (%)

13.4 Europe - Market size and forecast 2025-2030

Chart on Europe - Market size and forecast 2025-2030 ($ million)
Data Table on Europe - Market size and forecast 2025-2030 ($ million)
Chart on Europe - Year-over-year growth 2025-2030 (%)
Data Table on Europe - Year-over-year growth 2025-2030 (%)
Chart on Regional Comparison - Europe
Data Table on Regional Comparison - Europe

13.4.1 Germany - Market size and forecast 2025-2030

Chart on Germany - Market size and forecast 2025-2030 ($ million)
Data Table on Germany - Market size and forecast 2025-2030 ($ million)
Chart on Germany - Year-over-year growth 2025-2030 (%)
Data Table on Germany - Year-over-year growth 2025-2030 (%)

13.4.2 UK - Market size and forecast 2025-2030

Chart on UK - Market size and forecast 2025-2030 ($ million)
Data Table on UK - Market size and forecast 2025-2030 ($ million)
Chart on UK - Year-over-year growth 2025-2030 (%)
Data Table on UK - Year-over-year growth 2025-2030 (%)

13.4.3 France - Market size and forecast 2025-2030

Chart on France - Market size and forecast 2025-2030 ($ million)
Data Table on France - Market size and forecast 2025-2030 ($ million)
Chart on France - Year-over-year growth 2025-2030 (%)
Data Table on France - Year-over-year growth 2025-2030 (%)

13.4.4 Italy - Market size and forecast 2025-2030

Chart on Italy - Market size and forecast 2025-2030 ($ million)
Data Table on Italy - Market size and forecast 2025-2030 ($ million)
Chart on Italy - Year-over-year growth 2025-2030 (%)
Data Table on Italy - Year-over-year growth 2025-2030 (%)

13.4.5 Spain - Market size and forecast 2025-2030

Chart on Spain - Market size and forecast 2025-2030 ($ million)
Data Table on Spain - Market size and forecast 2025-2030 ($ million)
Chart on Spain - Year-over-year growth 2025-2030 (%)
Data Table on Spain - Year-over-year growth 2025-2030 (%)

13.4.6 The Netherlands - Market size and forecast 2025-2030

Chart on The Netherlands - Market size and forecast 2025-2030 ($ million)
Data Table on The Netherlands - Market size and forecast 2025-2030 ($ million)
Chart on The Netherlands - Year-over-year growth 2025-2030 (%)
Data Table on The Netherlands - Year-over-year growth 2025-2030 (%)

13.5 APAC - Market size and forecast 2025-2030

Chart on APAC - Market size and forecast 2025-2030 ($ million)
Data Table on APAC - Market size and forecast 2025-2030 ($ million)
Chart on APAC - Year-over-year growth 2025-2030 (%)
Data Table on APAC - Year-over-year growth 2025-2030 (%)
Chart on Regional Comparison - APAC
Data Table on Regional Comparison - APAC

13.5.1 China - Market size and forecast 2025-2030

Chart on China - Market size and forecast 2025-2030 ($ million)
Data Table on China - Market size and forecast 2025-2030 ($ million)
Chart on China - Year-over-year growth 2025-2030 (%)
Data Table on China - Year-over-year growth 2025-2030 (%)

13.5.2 Japan - Market size and forecast 2025-2030

Chart on Japan - Market size and forecast 2025-2030 ($ million)
Data Table on Japan - Market size and forecast 2025-2030 ($ million)
Chart on Japan - Year-over-year growth 2025-2030 (%)
Data Table on Japan - Year-over-year growth 2025-2030 (%)

13.5.3 India - Market size and forecast 2025-2030

Chart on India - Market size and forecast 2025-2030 ($ million)
Data Table on India - Market size and forecast 2025-2030 ($ million)
Chart on India - Year-over-year growth 2025-2030 (%)
Data Table on India - Year-over-year growth 2025-2030 (%)

13.5.4 South Korea - Market size and forecast 2025-2030

Chart on South Korea - Market size and forecast 2025-2030 ($ million)
Data Table on South Korea - Market size and forecast 2025-2030 ($ million)
Chart on South Korea - Year-over-year growth 2025-2030 (%)
Data Table on South Korea - Year-over-year growth 2025-2030 (%)

13.5.5 Australia - Market size and forecast 2025-2030

Chart on Australia - Market size and forecast 2025-2030 ($ million)
Data Table on Australia - Market size and forecast 2025-2030 ($ million)
Chart on Australia - Year-over-year growth 2025-2030 (%)
Data Table on Australia - Year-over-year growth 2025-2030 (%)

13.5.6 Taiwan - Market size and forecast 2025-2030

Chart on Taiwan - Market size and forecast 2025-2030 ($ million)
Data Table on Taiwan - Market size and forecast 2025-2030 ($ million)
Chart on Taiwan - Year-over-year growth 2025-2030 (%)
Data Table on Taiwan - Year-over-year growth 2025-2030 (%)

13.6 South America - Market size and forecast 2025-2030

Chart on South America - Market size and forecast 2025-2030 ($ million)
Data Table on South America - Market size and forecast 2025-2030 ($ million)
Chart on South America - Year-over-year growth 2025-2030 (%)
Data Table on South America - Year-over-year growth 2025-2030 (%)
Chart on Regional Comparison - South America
Data Table on Regional Comparison - South America

13.6.1 Brazil - Market size and forecast 2025-2030

Chart on Brazil - Market size and forecast 2025-2030 ($ million)
Data Table on Brazil - Market size and forecast 2025-2030 ($ million)
Chart on Brazil - Year-over-year growth 2025-2030 (%)
Data Table on Brazil - Year-over-year growth 2025-2030 (%)

13.6.2 Argentina - Market size and forecast 2025-2030

Chart on Argentina - Market size and forecast 2025-2030 ($ million)
Data Table on Argentina - Market size and forecast 2025-2030 ($ million)
Chart on Argentina - Year-over-year growth 2025-2030 (%)
Data Table on Argentina - Year-over-year growth 2025-2030 (%)

13.6.3 Colombia - Market size and forecast 2025-2030

Chart on Colombia - Market size and forecast 2025-2030 ($ million)
Data Table on Colombia - Market size and forecast 2025-2030 ($ million)
Chart on Colombia - Year-over-year growth 2025-2030 (%)
Data Table on Colombia - Year-over-year growth 2025-2030 (%)

13.7 Middle East and Africa - Market size and forecast 2025-2030

Chart on Middle East and Africa - Market size and forecast 2025-2030 ($ million)
Data Table on Middle East and Africa - Market size and forecast 2025-2030 ($ million)
Chart on Middle East and Africa - Year-over-year growth 2025-2030 (%)
Data Table on Middle East and Africa - Year-over-year growth 2025-2030 (%)
Chart on Regional Comparison - Middle East and Africa
Data Table on Regional Comparison - Middle East and Africa

13.7.1 Saudi Arabia - Market size and forecast 2025-2030

Chart on Saudi Arabia - Market size and forecast 2025-2030 ($ million)
Data Table on Saudi Arabia - Market size and forecast 2025-2030 ($ million)
Chart on Saudi Arabia - Year-over-year growth 2025-2030 (%)
Data Table on Saudi Arabia - Year-over-year growth 2025-2030 (%)

13.7.2 UAE - Market size and forecast 2025-2030

Chart on UAE - Market size and forecast 2025-2030 ($ million)
Data Table on UAE - Market size and forecast 2025-2030 ($ million)
Chart on UAE - Year-over-year growth 2025-2030 (%)
Data Table on UAE - Year-over-year growth 2025-2030 (%)

13.7.3 South Africa - Market size and forecast 2025-2030

Chart on South Africa - Market size and forecast 2025-2030 ($ million)
Data Table on South Africa - Market size and forecast 2025-2030 ($ million)
Chart on South Africa - Year-over-year growth 2025-2030 (%)
Data Table on South Africa - Year-over-year growth 2025-2030 (%)

13.7.4 Turkey - Market size and forecast 2025-2030

Chart on Turkey - Market size and forecast 2025-2030 ($ million)
Data Table on Turkey - Market size and forecast 2025-2030 ($ million)
Chart on Turkey - Year-over-year growth 2025-2030 (%)
Data Table on Turkey - Year-over-year growth 2025-2030 (%)

13.7.5 Israel - Market size and forecast 2025-2030

Chart on Israel - Market size and forecast 2025-2030 ($ million)
Data Table on Israel - Market size and forecast 2025-2030 ($ million)
Chart on Israel - Year-over-year growth 2025-2030 (%)
Data Table on Israel - Year-over-year growth 2025-2030 (%)

13.8 Market opportunity by geography

Market opportunity by geography ($ million)
Data Tables on Market opportunity by geography ($ million)

14. Drivers, Challenges, and Opportunity

14.1 Market drivers

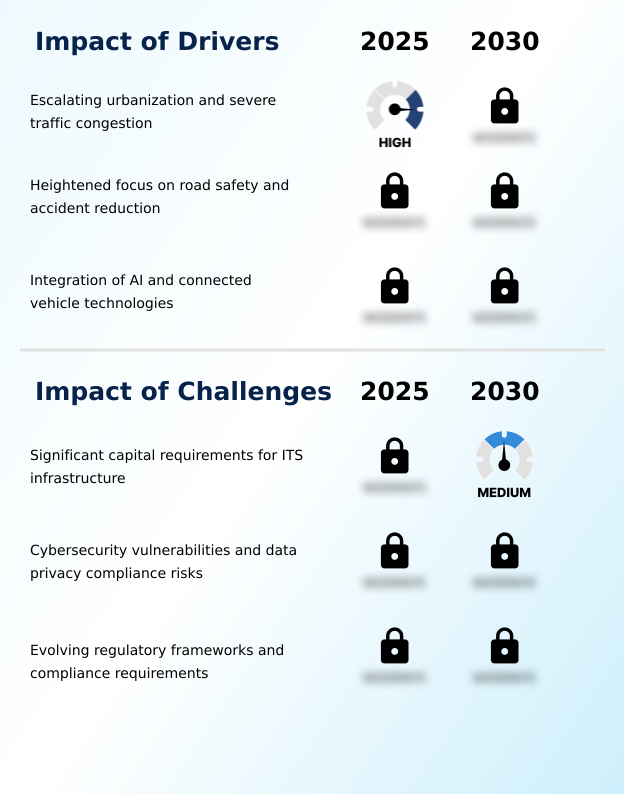
Escalating urbanization and severe traffic congestion
Heightened focus on road safety and accident reduction
Integration of AI and connected vehicle technologies

14.2 Market challenges

Significant capital requirements for ITS infrastructure
Cybersecurity vulnerabilities and data privacy compliance risks
Evolving regulatory frameworks and compliance requirements

14.3 Impact of drivers and challenges

Impact of drivers and challenges in 2025 and 2030

14.4 Market opportunities

Shift toward cloud-based traffic management and edge computing architectures
Proliferation of cooperative vehicle-infrastructure systems and cellular V2X connectivity
Integration of multimodal mobility platforms and unified data fabrics

15. Competitive Landscape

15.1 Overview

15.2

Overview on criticality of inputs and factors of differentiation

15.3 Landscape disruption

Overview on factors of disruption

15.4 Industry risks

Impact of key risks on business

16. Competitive Analysis

16.1 Companies profiled

Companies covered

16.2 Company ranking index

16.3 Market positioning of companies

Matrix on companies position and classification

16.4 Advantech Co. Ltd.

Advantech Co. Ltd. - Overview
Advantech Co. Ltd. - Business segments
Advantech Co. Ltd. - Key offerings
Advantech Co. Ltd. - Segment focus
SWOT

16.5 Axiomtek Co. Ltd.

Axiomtek Co. Ltd. - Overview
Axiomtek Co. Ltd. - Business segments
Axiomtek Co. Ltd. - Key offerings
Axiomtek Co. Ltd. - Segment focus
SWOT

16.6 Continental AG

Continental AG - Overview
Continental AG - Business segments
Continental AG - Key news
Continental AG - Key offerings
Continental AG - Segment focus
SWOT

16.7 DENSO Corp.

DENSO Corp. - Overview
DENSO Corp. - Business segments
DENSO Corp. - Key news
DENSO Corp. - Key offerings
DENSO Corp. - Segment focus
SWOT

16.8 Hanwha Vision Co. Ltd.

Hanwha Vision Co. Ltd. - Overview
Hanwha Vision Co. Ltd. - Product / Service
Hanwha Vision Co. Ltd. - Key offerings
SWOT

16.9 Indra Sistemas SA

Indra Sistemas SA - Overview
Indra Sistemas SA - Business segments
Indra Sistemas SA - Key offerings
Indra Sistemas SA - Segment focus
SWOT

16.10 Jenoptik AG

Jenoptik AG - Overview
Jenoptik AG - Business segments
Jenoptik AG - Key news
Jenoptik AG - Key offerings
Jenoptik AG - Segment focus
SWOT

16.11 Mitsubishi Electric Corp.

Mitsubishi Electric Corp. - Overview
Mitsubishi Electric Corp. - Business segments
Mitsubishi Electric Corp. - Key offerings
Mitsubishi Electric Corp. - Segment focus
SWOT

16.12 Moxa Inc.

Moxa Inc. - Overview
Moxa Inc. - Product / Service
Moxa Inc. - Key offerings
SWOT

16.13 Neology Inc.

Neology Inc. - Overview
Neology Inc. - Product / Service
Neology Inc. - Key offerings
SWOT

16.14 Q Free ASA

Q Free ASA - Overview
Q Free ASA - Product / Service
Q Free ASA - Key offerings
SWOT

16.15 ST Engineering Ltd.

ST Engineering Ltd. - Overview
ST Engineering Ltd. - Business segments
ST Engineering Ltd. - Key offerings
ST Engineering Ltd. - Segment focus
SWOT

16.16 Teledyne FLIR LLC

Teledyne FLIR LLC - Overview
Teledyne FLIR LLC - Product / Service
Teledyne FLIR LLC - Key offerings
SWOT

16.17 Verra Mobility Corp.

Verra Mobility Corp. - Overview
Verra Mobility Corp. - Business segments
Verra Mobility Corp. - Key news
Verra Mobility Corp. - Key offerings
Verra Mobility Corp. - Segment focus
SWOT

16.18 VITRONIC Machine Vision GmbH

VITRONIC Machine Vision GmbH - Overview
VITRONIC Machine Vision GmbH - Product / Service
VITRONIC Machine Vision GmbH - Key offerings
SWOT

17. Appendix

17.1 Scope of the report

Market definition
Objectives
Notes and caveats

17.2 Inclusions and exclusions checklist

Inclusions checklist
Exclusions checklist

17.3 Currency conversion rates for US$

17.4 Research methodology

17.5 Data procurement

Information sources

17.6 Data validation

17.7 Validation techniques employed for market sizing

17.8 Data synthesis

17.9 360 degree market analysis

17.10 List of abbreviations

Research Methodology

Technavio presents a detailed picture of the market by way of study, synthesis, and summation of data from multiple sources. The analysts have presented the various facets of the market with a particular focus on identifying the key industry influencers. The data thus presented is comprehensive, reliable, and the result of extensive research, both primary and secondary.

INFORMATION SOURCES

Primary sources

  • Manufacturers and suppliers
  • Channel partners
  • Industry experts
  • Strategic decision makers

Secondary sources

  • Industry journals and periodicals
  • Government data
  • Financial reports of key industry players
  • Historical data
  • Press releases

DATA ANALYSIS

Data Synthesis

  • Collation of data
  • Estimation of key figures
  • Analysis of derived insights

Data Validation

  • Triangulation with data models
  • Reference against proprietary databases
  • Corroboration with industry experts

REPORT WRITING

Qualitative

  • Market drivers
  • Market challenges
  • Market trends
  • Five forces analysis

Quantitative

  • Market size and forecast
  • Market segmentation
  • Geographical insights
  • Competitive landscape

Interested in this report?

Get your sample now to see our research methodology and insights!

Download Now

Frequently Asked Questions

Intelligent Transport System (Its) market growth will increase by USD 49183.0 million during 2026-2030.

The Intelligent Transport System (Its) market is expected to grow at a CAGR of 9.6% during 2026-2030.

Intelligent Transport System (Its) market is segmented by Application (Traffic management, Toll management, Automotive and infotainment telematics, Public transport, Others) Type (Advanced traffic management system, Advanced traveller information system, Advanced public transportation system, Advanced transportation pricing system, Others) Mode of transportation (Roadway, Railway, Airway, Maritime) Component (Hardware, Software, Services)

Advantech Co. Ltd., Axiomtek Co. Ltd., Continental AG, Cubic Corp., DENSO Corp., Econolite Control Products Inc., EFKON GmbH, Hanwha Vision Co. Ltd., Indra Sistemas SA, IntelliStride Technologies Ltd, Jenoptik AG, Mitsubishi Electric Corp., Moxa Inc., Neology Inc., Q Free ASA, ST Engineering Ltd., SWARCO AG, TagMaster AB, Teledyne FLIR LLC, Verra Mobility Corp., VITRONIC Machine Vision GmbH, Wavetronix LLC are a few of the key vendors in the Intelligent Transport System (Its) market.

North America will register the highest growth rate of 33.9% among the other regions. Therefore, the Intelligent Transport System (Its) market in North America is expected to garner significant business opportunities for the vendors during the forecast period.

US, Canada, Mexico, Germany, UK, France, Italy, Spain, The Netherlands, China, Japan, India, South Korea, Australia, Taiwan, Brazil, Argentina, Colombia, Saudi Arabia, UAE, South Africa, Turkey, Israel

  • Escalating urbanization and severe traffic congestion is the driving factor this market.

The Intelligent Transport System (Its) market vendors should focus on grabbing business opportunities from the Application segment as it accounted for the largest market share in the base year.
RIA - Research AI Assistant
Ask RIA