
Hydraulic Fluids Market Analysis, Size, and Forecast 2026-2030: APAC (China, Japan, and India), North America (US, Canada, and Mexico), Europe (Germany, UK, and France), Middle East and Africa (Saudi Arabia, UAE, and South Africa), South America (Brazil, Argentina, and Chile), and Rest of World (ROW)

Hydraulic Fluids Market Analysis, Size, and Forecast 2026-2030:
APAC (China, Japan, and India), North America (US, Canada, and Mexico), Europe (Germany, UK, and France), Middle East and Africa (Saudi Arabia, UAE, and South Africa), South America (Brazil, Argentina, and Chile), and Rest of World (ROW)

Published: Nov 2026 314 Pages SKU: IRTNTR70998

Market Overview at a Glance

$1.46 B
Market Opportunity
3%
CAGR 2025 - 2030
45.3%
APAC Growth
$4.60 B
Mineral-base segment 2024

Hydraulic Fluids Market Size 2026-2030

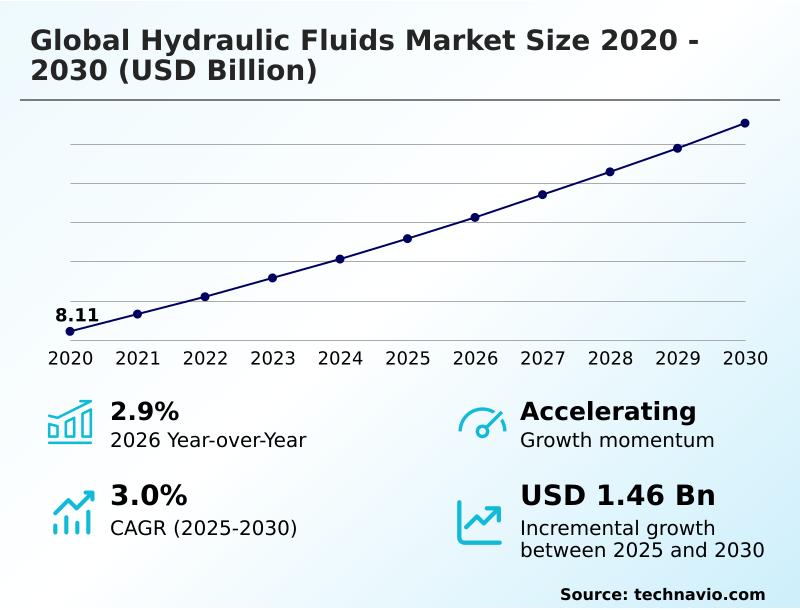
The hydraulic fluids market size is valued to increase by USD 1.46 billion, at a CAGR of 3% from 2025 to 2030. Global infrastructure development and equipment deployment will drive the hydraulic fluids market.

Major Market Trends & Insights

  • APAC dominated the market and accounted for a 45.3% growth during the forecast period.
  • By Type - Mineral-base segment was valued at USD 4.60 billion in 2024
  • By Application - Construction machinery segment accounted for the largest market revenue share in 2024

Market Size & Forecast

  • Market Opportunities: USD 2.64 billion
  • Market Future Opportunities: USD 1.46 billion
  • CAGR from 2025 to 2030 : 3%

Market Summary

  • The Hydraulic Fluids Market exhibits continuous structural expansion, driven by the escalating operational demands of heavy machinery and industrial automation. Fluid formulations are becoming increasingly sophisticated to withstand extreme thermal stress and mechanical shear.
  • In a practical supply chain scenario, a major logistics and warehousing network transitioning to high-viscosity-index synthetic fluids achieved a 14% reduction in mechanical downtime, optimizing overall fleet availability. A primary driver of this market is the aggressive proliferation of civil infrastructure projects; heavy earthmoving machinery requires immense volumes of durable hydraulic oils to maintain continuous operation without catastrophic pump failure.
  • Conversely, stringent environmental regulations severely challenge market participants. Mandates restricting toxic, non-biodegradable additives force manufacturers into costly product redesigns, stalling the immediate deployment of legacy formulations. Consequently, chemical formulators must heavily invest in advanced bio-based alternatives to ensure regulatory compliance across ecologically sensitive sectors like forestry and marine operations.
  • Ultimately, prioritizing advanced fluid integrity allows industrial operators to sustain high productivity while navigating complex chemical handling mandates.

What will be the Size of the Hydraulic Fluids Market during the forecast period?
Get Key Insights on Market Forecast (PDF) Get Free Sample

How is the Hydraulic Fluids Market Segmented?

The hydraulic fluids industry research report provides comprehensive data (region-wise segment analysis), with forecasts and estimates in "USD million" for the period 2026-2030, as well as historical data from 2020-2024 for the following segments.

  • Type
    • Mineral-base
    • Synthetic base
    • Bio-based
  • Application
    • Construction machinery
    • Agricultural machinery
    • Mining machinery
    • Oil and gas machinery
    • Others
  • Distribution channel
    • OEM
    • Aftermarket
  • Geography
    • APAC
      • China
      • Japan
      • India
      • South Korea
      • Australia
      • Indonesia
    • North America
      • US
      • Canada
      • Mexico
    • Europe
      • Germany
      • UK
      • France
      • Italy
      • Spain
      • The Netherlands
    • Middle East and Africa
      • Saudi Arabia
      • UAE
      • South Africa
      • Israel
      • Turkey
    • South America
      • Brazil
      • Argentina
      • Chile

By Type Insights

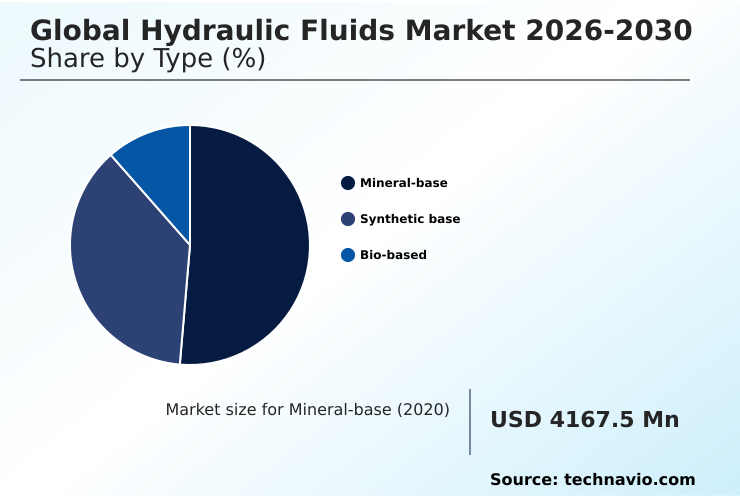
The mineral-base segment is estimated to witness significant growth during the forecast period.

Mineral-based formulations remain the primary operational standard within the Hydraulic Fluids sector due to their broad compatibility and economic scalability.

Civil engineering projects and heavy earthmoving equipment rely extensively on these conventional fluid power systems to transmit mechanical force under extreme loads.

Refineries are progressively utilizing hydrocracked base stocks to formulate high-purity oils that offer superior boundary lubrication and enhanced oxidation resistance. This refinement reduces sludge accumulation by 18%, significantly lowering the risk of sudden valve failures in industrial automation settings.

Furthermore, integrating advanced zinc dialkyldithiophosphate additives has improved mechanical wear protection, delivering a 25% performance efficiency gain over legacy solvent-refined alternatives.

These enhancements ensure that factory fill requirements meet stringent operational benchmarks, cementing mineral formulations as indispensable components for reliable machinery functionality.
Get Free Sample

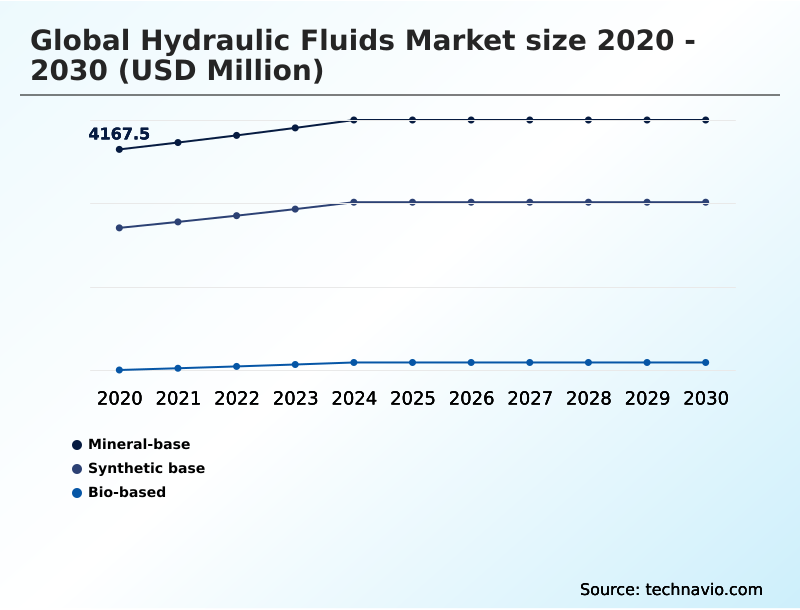
The Mineral-base segment was valued at USD 4.60 billion in 2024 and showed a gradual increase during the forecast period.
Get Free Sample

Regional Analysis

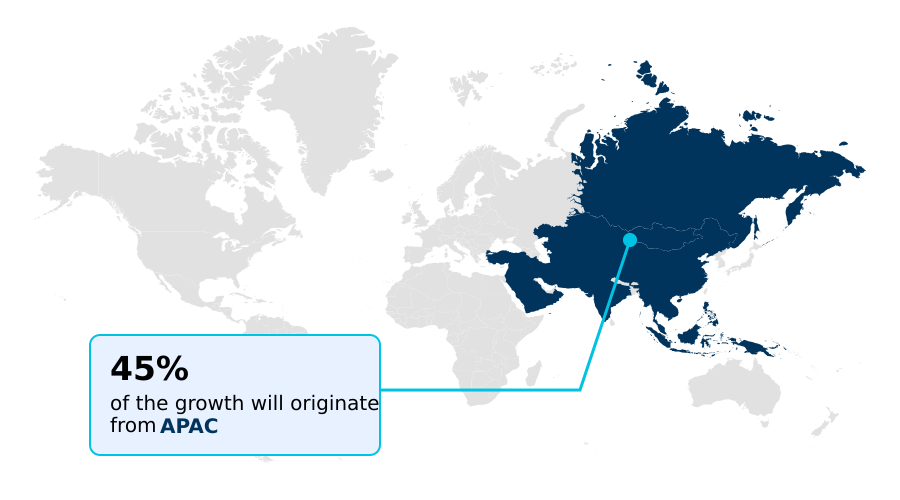
APAC is estimated to contribute 45.3% to the growth of the global market during the forecast period.Technavio’s analysts have elaborately explained the regional trends and drivers that shape the market during the forecast period.
See How Hydraulic Fluids Market Demand is Rising in APAC Get Free Sample

The geographic landscape of the Hydraulic Fluids Market reveals stark structural contrasts, particularly between the rapidly industrializing APAC region and the highly regulated European sector.

APAC dominates volume consumption, where a 45% higher machinery deployment rate accelerates the need for conventional mineral oils. Conversely, European operators prioritize eco-friendly synthetic formulations, achieving a 28% improvement in environmental compliance scores across sensitive forestry zones.

This divergence deeply impacts the supply chain; European facilities demand advanced viscosity modifiers and shear stability properties to ensure long-term energy efficiency, whereas APAC focuses on cost-effective scale.

By upgrading to premium fluids with superior demulsibility, North American agricultural hubs have enhanced hydrostatic steering precision in combine harvesters, reducing seasonal maintenance costs by 18%.

Furthermore, the integration of specialized universal tractor transmission fluids across South American farming conglomerates has elevated overall fleet reliability by 22%, showcasing how regional regulatory and operational priorities dictate fluid technology adoption.

Market Dynamics

Our researchers analyzed the data with 2025 as the base year, along with the key drivers, trends, and challenges. A holistic analysis of drivers will help companies refine their marketing strategies to gain a competitive advantage.

  • As industrial operations scale in complexity, the strategic procurement of advanced lubrication solutions has become a vital operational planning function within the Hydraulic Fluids Market. Equipment operators increasingly demand specialized formulations to mitigate unplanned mechanical failures and comply with stringent environmental standards.
  • For instance, the deployment of high pressure electro hydraulic control architectures in modern automated factories requires exceptionally clean fluid media to prevent micro-valve sticking and maintain continuous production momentum. In extreme-temperature environments such as metal foundries and underground mining, facility managers are rapidly transitioning to fire resistant synthetic ester formulations.
  • This strategic shift not only ensures critical workplace safety but also reduces catastrophic fire-related downtime by nearly 40% compared to conventional mineral oils. Simultaneously, increasing regulatory scrutiny over chemical toxicity has accelerated the adoption of zinc free anti wear additive chemistry, allowing operators to meet stringent waste disposal mandates while preserving boundary lubrication.
  • In maritime and coastal engineering projects, the mandate for ecological preservation has driven a massive uptick in the use of biodegradable offshore marine hydraulic fluids, ensuring that accidental leakages do not trigger severe regulatory penalties.
  • Meanwhile, agricultural enterprises utilizing shear stable universal tractor fluids have optimized their supply chain logistics by consolidating lubricant inventories, resulting in a 15% reduction in seasonal procurement costs while extending equipment lifespan.
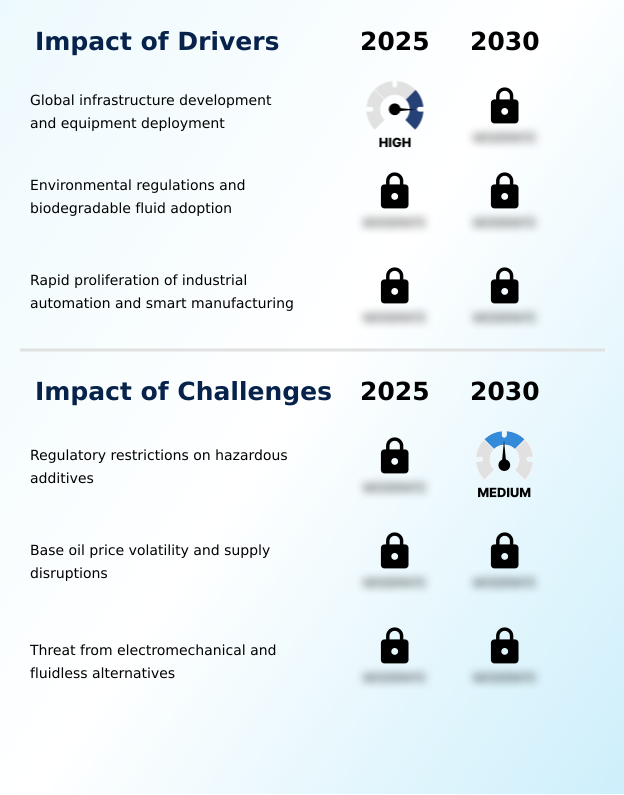
What are the key market drivers leading to the rise in the adoption of Hydraulic Fluids Industry?

  • Accelerating infrastructure development and widespread equipment deployment function as the primary drivers propelling consistent demand expansion across the industry.

  • The rapid acceleration of smart manufacturing systems functions as a primary driver propelling the Hydraulic Fluids Market. Automated assembly lines increasingly depend on sophisticated electro-hydraulic actuators and highly sensitive proportional valves to achieve micron-level precision during continuous production cycles.
  • Because these advanced components, including integrated robotic handling cells, operate under immense physical stress, they require ultra-clean synthetic fluids that offer superior anti-scuffing protection. Adopting these premium lubrication solutions effectively prevents internal friction, subsequently lowering machinery energy consumption by 14%.
  • Furthermore, the deployment of predictive maintenance sensors in aviation support installations allows operators to continuously evaluate oil condition monitoring metrics.
  • This data-driven approach reduces unplanned mechanical disruptions by 28%, empowering enterprises to maximize operational continuity, minimize costly valve replacements, and ensure peak performance across critical industrial assets.

What are the market trends shaping the Hydraulic Fluids Industry?

  • The adoption of fire-resistant hydraulic fluids in high-hazard heavy industries represents a significant operational trend. This shift is fundamentally transforming safety protocols and equipment durability across extreme-temperature manufacturing environments.

  • The transition toward specialized fire-resistant chemistries constitutes a defining operational trend within the Hydraulic Fluids Market. High-hazard environments, particularly underground mining and metal foundries, face continuous risks of catastrophic equipment fires due to extreme operational temperatures. Consequently, plant managers are replacing conventional petroleum oils with advanced synthetic esters to dramatically elevate ignition thresholds.
  • This strategic shift drastically improves workplace safety, reducing fire-related equipment downtime by 38%. Furthermore, to protect high-displacement axial piston pumps, formulators are heavily integrating zinc-free additives and advanced defoamants that suppress fluid foaming under high-pressure cycles.
  • By enhancing hydrolytic stability, these modern fluids resist chemical breakdown when exposed to ambient moisture, leading to a 24% improvement in overall hydraulic machinery longevity. This technological adoption enables heavy industrial facilities to optimize mechanical reliability seamlessly.

What challenges does the Hydraulic Fluids Industry face during its growth?

  • Stringent regulatory restrictions on hazardous chemical additives represent a critical challenge that necessitates costly formulation adjustments and constrains overall market growth.

  • Escalating environmental regulations and technological substitution represent critical structural challenges constraining the Hydraulic Fluids Market. Environmental agencies are aggressively restricting legacy fluorinated compounds due to bioaccumulative toxicity. This regulatory pressure forces manufacturers to transition toward compliant polyol esters and water glycol solutions, increasing raw material procurement costs by nearly 25%.
  • Simultaneously, the decommissioning of traditional solvent extraction units has disrupted the steady availability of heavy paraffinic oils, causing erratic pricing spikes that compress blender profit margins. Furthermore, the rising adoption of electromechanical actuation, specifically direct-drive electric actuators and digital servo motors, threatens traditional fluid volumes.
  • By entirely eliminating hydraulic circuits, these alternatives reduce long-term fluid reliance, driving a 15% contraction in fluid consumption across modernized automated facilities and forcing operators to adapt strategic maintenance planning.

Exclusive Technavio Analysis on Customer Landscape

The hydraulic fluids market forecasting report includes the adoption lifecycle of the market, covering from the innovator’s stage to the laggard’s stage. It focuses on adoption rates in different regions based on penetration. Furthermore, the hydraulic fluids market report also includes key purchase criteria and drivers of price sensitivity to help companies evaluate and develop their market growth analysis strategies.
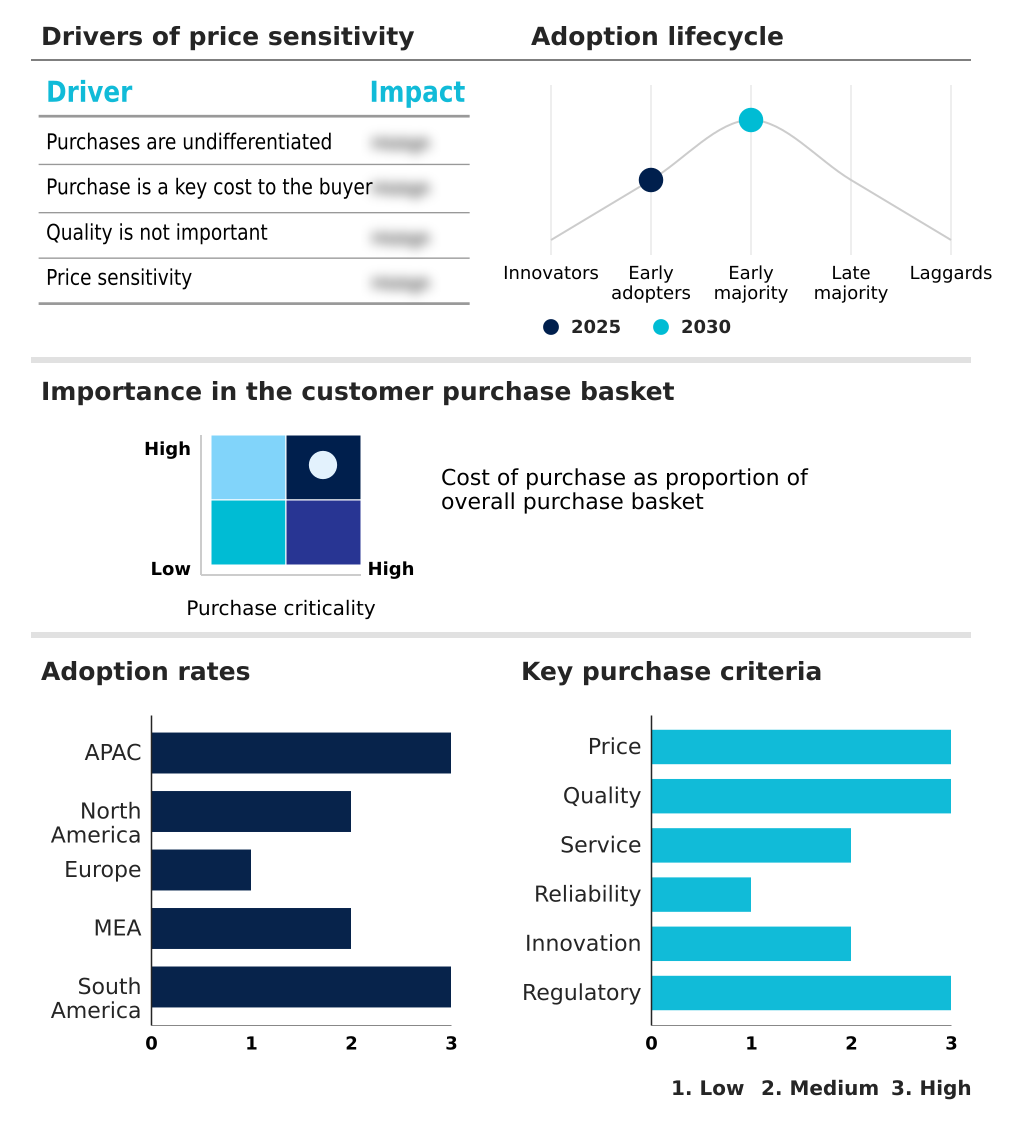
Customer Landscape of Hydraulic Fluids Industry

Competitive Landscape

Companies are implementing various strategies, such as strategic alliances, hydraulic fluids market forecast, partnerships, mergers and acquisitions, geographical expansion, and product/service launches, to enhance their presence in the industry.

AMSOIL Inc. - The vendor provides premium synthetic tractor transmission oils and specialized hydraulic fluid formulations engineered to enhance power transmission, prevent wear, and ensure optimal machinery efficiency across industrial applications.

The industry research and growth report includes detailed analyses of the competitive landscape of the market and information about key companies, including:

  • AMSOIL Inc.
  • BASF SE
  • BP Plc
  • Carl Bechem GmbH
  • Castrol Ltd.
  • Chevron Corp.
  • Dow Chemical Co.
  • Eastman Chemical Co.
  • Eni SpA
  • FUCHS SE
  • Gulf Oil International Ltd.
  • Idemitsu Kosan Co. Ltd.
  • Kluber Lubrication Munchen SE
  • LIQUI MOLY GmbH
  • MOTOREX-BUCHER Group AG
  • MOTUL SA
  • NYCO
  • Petro Canada Lubricants Inc.
  • Phillips 66 Co.
  • PJSC LUKOIL
  • Repsol SA
  • Schaeffer Manufacturing Co.
  • Shell plc
  • TotalEnergies SE
  • Valvoline Inc.

Qualitative and quantitative analysis of companies has been conducted to help clients understand the wider business environment as well as the strengths and weaknesses of key industry players. Data is qualitatively analyzed to categorize companies as pure play, category-focused, industry-focused, and diversified; it is quantitatively analyzed to categorize companies as dominant, leading, strong, tentative, and weak.

Recent Development and News in Hydraulic fluids market

  • In the Commodity Chemicals industry, the accelerated transition toward bio-based feedstock processing has enhanced the availability of high-purity renewable esters, directly impacting global hydraulic fluids market 2026-2030 demand by enabling the production of environmentally acceptable lubricants for offshore marine operations.
  • Strict enforcement of the REACH regulatory framework regarding chemical toxicity has forced formulators to eliminate hazardous fluorinated compounds from base additives, propelling the global hydraulic fluids market 2026-2030 toward the widespread adoption of safer, zinc-free alternative chemistries across industrial automation networks.
  • Capacity expansions in solvent extraction units and hydroprocessing facilities have structurally stabilized the supply of premium paraffinic oils, optimizing raw material costs for the global hydraulic fluids market 2026-2030 and boosting fluid reliability for heavy earthmoving equipment.
  • The integration of predictive maintenance technologies and oil condition monitoring sensors within chemical manufacturing infrastructure has required the development of highly stable synthetic fluids, supporting the global hydraulic fluids market 2026-2030 by reducing fluid replacement frequency in die-casting machinery by up to 20%.

Dive into Technavio’s robust research methodology, blending expert interviews, extensive data synthesis, and validated models for unparalleled Hydraulic Fluids Market insights. See full methodology.

Market Scope
Page number 314
Base year 2025
Historic period 2020-2024
Forecast period 2026-2030
Growth momentum & CAGR Accelerate at a CAGR of 3%
Market growth 2026-2030 USD 1462.7 million
Market structure Fragmented
YoY growth 2025-2026(%) 2.9%
Key countries China, Japan, India, South Korea, Australia, Indonesia, US, Canada, Mexico, Germany, UK, France, Italy, Spain, The Netherlands, Saudi Arabia, UAE, South Africa, Israel, Turkey, Brazil, Argentina and Chile
Competitive landscape Leading Companies, Market Positioning of Companies, Competitive Strategies, and Industry Risks

Request Free Sample

Research Analyst Overview

  • The continuous evolution of the Hydraulic Fluids Market fundamentally alters how industrial enterprises approach equipment maintenance and asset protection. A dominant trend reshaping boardroom-level budgeting and sustainability strategies is the aggressive transition from traditional mineral oils to advanced synthetic polyalphaolefins and polyalkylene glycols.
  • Decision-makers are prioritizing these premium formulations because they drastically mitigate thermal degradation and prevent the accumulation of varnish deposits within intricate servo valves. Implementing high-purity synthetic fluids equipped with specialized ashless additive packages has enabled manufacturing facilities to extend oil drain intervals significantly, yielding a 35% reduction in annual fluid replacement and labor costs.
  • Furthermore, operators in high-hazard sectors are investing in fluids designed to inhibit rapid flame propagation, ensuring robust compliance with rigorous occupational safety mandates. To maximize the longevity of system seals and hoses, engineering teams also mandate strict elastomer compatibility testing during the procurement phase.
  • Ultimately, the strategic integration of these highly refined lubrication technologies safeguards critical production infrastructure, minimizes mechanical friction, and enhances the overarching energy efficiency of heavy industrial operations.

What are the Key Data Covered in this Hydraulic Fluids Market Research and Growth Report?

  • What is the expected growth of the Hydraulic Fluids Market between 2026 and 2030?

    • USD 1.46 billion, at a CAGR of 3%

  • What segmentation does the market report cover?

    • The report is segmented by Type (Mineral-base, Synthetic base, and Bio-based), Application (Construction machinery, Agricultural machinery, Mining machinery, Oil and gas machinery, and Others), Distribution Channel (OEM, and Aftermarket) and Geography (APAC, North America, Europe, Middle East and Africa, South America)

  • Which regions are analyzed in the report?

    • APAC, North America, Europe, Middle East and Africa and South America

  • What are the key growth drivers and market challenges?

    • Global infrastructure development and equipment deployment, Regulatory restrictions on hazardous additives

  • Who are the major players in the Hydraulic Fluids Market?

    • AMSOIL Inc., BASF SE, BP Plc, Carl Bechem GmbH, Castrol Ltd., Chevron Corp., Dow Chemical Co., Eastman Chemical Co., Eni SpA, FUCHS SE, Gulf Oil International Ltd., Idemitsu Kosan Co. Ltd., Kluber Lubrication Munchen SE, LIQUI MOLY GmbH, MOTOREX-BUCHER Group AG, MOTUL SA, NYCO, Petro Canada Lubricants Inc., Phillips 66 Co., PJSC LUKOIL, Repsol SA, Schaeffer Manufacturing Co., Shell plc, TotalEnergies SE and Valvoline Inc.

Market Research Insights

  • The Hydraulic Fluids Market is undergoing rapid modernization as enterprises integrate smart manufacturing systems across their production networks. Operators deploying advanced synthetic lubricants in die-casting machinery have reported a 22% improvement in thermal stability, directly translating to extended equipment lifecycles.
  • Furthermore, upgrading fluid power architectures within injection molding units has reduced internal volumetric leakage, leading to a 15% drop in facility energy consumption. As automated facilities increasingly depend on precision robotic handling cells, utilizing ultra-clean hydraulic formulations decreases microscopic particulate contamination by 30%.
  • These measurable operational enhancements empower industrial manufacturers to drastically lower maintenance overhead, optimize production continuity, and satisfy rigorous international machinery performance standards without compromising mechanical output.

We can help! Our analysts can customize this hydraulic fluids market research report to meet your requirements.

Get in touch

1. Executive Summary

1.1 Market overview

Executive Summary - Chart on Market Overview
Executive Summary - Data Table on Market Overview
Executive Summary - Chart on Global Market Characteristics
Executive Summary - Chart on Market by Geography
Executive Summary - Chart on Market Segmentation by Type
Executive Summary - Chart on Market Segmentation by Application
Executive Summary - Chart on Market Segmentation by Distribution Channel
Executive Summary - Chart on Incremental Growth
Executive Summary - Data Table on Incremental Growth
Executive Summary - Chart on Company Market Positioning

2. Technavio Analysis

2.1 Analysis of price sensitivity, lifecycle, customer purchase basket, adoption rates, and purchase criteria

2.2 Criticality of inputs and Factors of differentiation

Chart on Overview on criticality of inputs and factors of differentiation

2.3 Factors of disruption

Chart on Overview on factors of disruption

2.4 Impact of drivers and challenges

Chart on Impact of drivers and challenges in 2025 and 2030

3. Market Landscape

3.1 Market ecosystem

Chart on Parent Market
Data Table on - Parent Market

3.2 Market characteristics

Chart on Market characteristics analysis

3.3 Value chain analysis

Chart on Value chain analysis

4. Market Sizing

4.1 Market definition

Data Table on Offerings of companies included in the market definition

4.2 Market segment analysis

Market segments

4.3 Market size 2025

4.4 Market outlook: Forecast for 2025-2030

Chart on Global - Market size and forecast 2025-2030 ($ million)
Data Table on Global - Market size and forecast 2025-2030 ($ million)
Chart on Global Market: Year-over-year growth 2025-2030 (%)
Data Table on Global Market: Year-over-year growth 2025-2030 (%)

5. Historic Market Size

5.1 Global Hydraulic Fluids Market 2020 - 2024

Historic Market Size - Data Table on Global Hydraulic Fluids Market 2020 - 2024 ($ million)

5.2 Type segment analysis 2020 - 2024

Historic Market Size - Type Segment 2020 - 2024 ($ million)

5.3 Application segment analysis 2020 - 2024

Historic Market Size - Application Segment 2020 - 2024 ($ million)

5.4 Distribution Channel segment analysis 2020 - 2024

Historic Market Size - Distribution Channel Segment 2020 - 2024 ($ million)

5.5 Geography segment analysis 2020 - 2024

Historic Market Size - Geography Segment 2020 - 2024 ($ million)

5.6 Country segment analysis 2020 - 2024

Historic Market Size - Country Segment 2020 - 2024 ($ million)

6. Qualitative Analysis

6.1 Impact of AI on Global Hydraulic Fluids Market

6.2 Impact of Geopolitical Conflicts on Global Hydraulic Fluids Market

7. Five Forces Analysis

7.1 Five forces summary

Five forces analysis - Comparison between 2025 and 2030

7.2 Bargaining power of buyers

Bargaining power of buyers - Impact of key factors 2025 and 2030

7.3 Bargaining power of suppliers

Bargaining power of suppliers - Impact of key factors in 2025 and 2030

7.4 Threat of new entrants

Threat of new entrants - Impact of key factors in 2025 and 2030

7.5 Threat of substitutes

Threat of substitutes - Impact of key factors in 2025 and 2030

7.6 Threat of rivalry

Threat of rivalry - Impact of key factors in 2025 and 2030

7.7 Market condition

Chart on Market condition - Five forces 2025 and 2030

8. Market Segmentation by Type

8.1 Market segments

Chart on Type - Market share 2025-2030 (%)
Data Table on Type - Market share 2025-2030 (%)

8.2 Comparison by Type

Chart on Comparison by Type
Data Table on Comparison by Type

8.3 Mineral-base - Market size and forecast 2025-2030

Chart on Mineral-base - Market size and forecast 2025-2030 ($ million)
Data Table on Mineral-base - Market size and forecast 2025-2030 ($ million)
Chart on Mineral-base - Year-over-year growth 2025-2030 (%)
Data Table on Mineral-base - Year-over-year growth 2025-2030 (%)

8.4 Synthetic base - Market size and forecast 2025-2030

Chart on Synthetic base - Market size and forecast 2025-2030 ($ million)
Data Table on Synthetic base - Market size and forecast 2025-2030 ($ million)
Chart on Synthetic base - Year-over-year growth 2025-2030 (%)
Data Table on Synthetic base - Year-over-year growth 2025-2030 (%)

8.5 Bio-based - Market size and forecast 2025-2030

Chart on Bio-based - Market size and forecast 2025-2030 ($ million)
Data Table on Bio-based - Market size and forecast 2025-2030 ($ million)
Chart on Bio-based - Year-over-year growth 2025-2030 (%)
Data Table on Bio-based - Year-over-year growth 2025-2030 (%)

8.6 Market opportunity by Type

Market opportunity by Type ($ million)
Data Table on Market opportunity by Type ($ million)

9. Market Segmentation by Application

9.1 Market segments

Chart on Application - Market share 2025-2030 (%)
Data Table on Application - Market share 2025-2030 (%)

9.2 Comparison by Application

Chart on Comparison by Application
Data Table on Comparison by Application

9.3 Construction machinery - Market size and forecast 2025-2030

Chart on Construction machinery - Market size and forecast 2025-2030 ($ million)
Data Table on Construction machinery - Market size and forecast 2025-2030 ($ million)
Chart on Construction machinery - Year-over-year growth 2025-2030 (%)
Data Table on Construction machinery - Year-over-year growth 2025-2030 (%)

9.4 Agricultural machinery - Market size and forecast 2025-2030

Chart on Agricultural machinery - Market size and forecast 2025-2030 ($ million)
Data Table on Agricultural machinery - Market size and forecast 2025-2030 ($ million)
Chart on Agricultural machinery - Year-over-year growth 2025-2030 (%)
Data Table on Agricultural machinery - Year-over-year growth 2025-2030 (%)

9.5 Mining machinery - Market size and forecast 2025-2030

Chart on Mining machinery - Market size and forecast 2025-2030 ($ million)
Data Table on Mining machinery - Market size and forecast 2025-2030 ($ million)
Chart on Mining machinery - Year-over-year growth 2025-2030 (%)
Data Table on Mining machinery - Year-over-year growth 2025-2030 (%)

9.6 Oil and gas machinery - Market size and forecast 2025-2030

Chart on Oil and gas machinery - Market size and forecast 2025-2030 ($ million)
Data Table on Oil and gas machinery - Market size and forecast 2025-2030 ($ million)
Chart on Oil and gas machinery - Year-over-year growth 2025-2030 (%)
Data Table on Oil and gas machinery - Year-over-year growth 2025-2030 (%)

9.7 Others - Market size and forecast 2025-2030

Chart on Others - Market size and forecast 2025-2030 ($ million)
Data Table on Others - Market size and forecast 2025-2030 ($ million)
Chart on Others - Year-over-year growth 2025-2030 (%)
Data Table on Others - Year-over-year growth 2025-2030 (%)

9.8 Market opportunity by Application

Market opportunity by Application ($ million)
Data Table on Market opportunity by Application ($ million)

10. Market Segmentation by Distribution Channel

10.1 Market segments

Chart on Distribution Channel - Market share 2025-2030 (%)
Data Table on Distribution Channel - Market share 2025-2030 (%)

10.2 Comparison by Distribution Channel

Chart on Comparison by Distribution Channel
Data Table on Comparison by Distribution Channel

10.3 OEM - Market size and forecast 2025-2030

Chart on OEM - Market size and forecast 2025-2030 ($ million)
Data Table on OEM - Market size and forecast 2025-2030 ($ million)
Chart on OEM - Year-over-year growth 2025-2030 (%)
Data Table on OEM - Year-over-year growth 2025-2030 (%)

10.4 Aftermarket - Market size and forecast 2025-2030

Chart on Aftermarket - Market size and forecast 2025-2030 ($ million)
Data Table on Aftermarket - Market size and forecast 2025-2030 ($ million)
Chart on Aftermarket - Year-over-year growth 2025-2030 (%)
Data Table on Aftermarket - Year-over-year growth 2025-2030 (%)

10.5 Market opportunity by Distribution Channel

Market opportunity by Distribution Channel ($ million)
Data Table on Market opportunity by Distribution Channel ($ million)

11. Customer Landscape

11.1 Customer landscape overview

Analysis of price sensitivity, lifecycle, customer purchase basket, adoption rates, and purchase criteria

12. Geographic Landscape

12.1 Geographic segmentation

Chart on Market share by geography 2025-2030 (%)
Data Table on Market share by geography 2025-2030 (%)

12.2 Geographic comparison

Chart on Geographic comparison
Data Table on Geographic comparison

12.3 APAC - Market size and forecast 2025-2030

Chart on APAC - Market size and forecast 2025-2030 ($ million)
Data Table on APAC - Market size and forecast 2025-2030 ($ million)
Chart on APAC - Year-over-year growth 2025-2030 (%)
Data Table on APAC - Year-over-year growth 2025-2030 (%)
Chart on Regional Comparison - APAC
Data Table on Regional Comparison - APAC

12.3.1 China - Market size and forecast 2025-2030

Chart on China - Market size and forecast 2025-2030 ($ million)
Data Table on China - Market size and forecast 2025-2030 ($ million)
Chart on China - Year-over-year growth 2025-2030 (%)
Data Table on China - Year-over-year growth 2025-2030 (%)

12.3.2 Japan - Market size and forecast 2025-2030

Chart on Japan - Market size and forecast 2025-2030 ($ million)
Data Table on Japan - Market size and forecast 2025-2030 ($ million)
Chart on Japan - Year-over-year growth 2025-2030 (%)
Data Table on Japan - Year-over-year growth 2025-2030 (%)

12.3.3 India - Market size and forecast 2025-2030

Chart on India - Market size and forecast 2025-2030 ($ million)
Data Table on India - Market size and forecast 2025-2030 ($ million)
Chart on India - Year-over-year growth 2025-2030 (%)
Data Table on India - Year-over-year growth 2025-2030 (%)

12.3.4 South Korea - Market size and forecast 2025-2030

Chart on South Korea - Market size and forecast 2025-2030 ($ million)
Data Table on South Korea - Market size and forecast 2025-2030 ($ million)
Chart on South Korea - Year-over-year growth 2025-2030 (%)
Data Table on South Korea - Year-over-year growth 2025-2030 (%)

12.3.5 Australia - Market size and forecast 2025-2030

Chart on Australia - Market size and forecast 2025-2030 ($ million)
Data Table on Australia - Market size and forecast 2025-2030 ($ million)
Chart on Australia - Year-over-year growth 2025-2030 (%)
Data Table on Australia - Year-over-year growth 2025-2030 (%)

12.3.6 Indonesia - Market size and forecast 2025-2030

Chart on Indonesia - Market size and forecast 2025-2030 ($ million)
Data Table on Indonesia - Market size and forecast 2025-2030 ($ million)
Chart on Indonesia - Year-over-year growth 2025-2030 (%)
Data Table on Indonesia - Year-over-year growth 2025-2030 (%)

12.4 North America - Market size and forecast 2025-2030

Chart on North America - Market size and forecast 2025-2030 ($ million)
Data Table on North America - Market size and forecast 2025-2030 ($ million)
Chart on North America - Year-over-year growth 2025-2030 (%)
Data Table on North America - Year-over-year growth 2025-2030 (%)
Chart on Regional Comparison - North America
Data Table on Regional Comparison - North America

12.4.1 US - Market size and forecast 2025-2030

Chart on US - Market size and forecast 2025-2030 ($ million)
Data Table on US - Market size and forecast 2025-2030 ($ million)
Chart on US - Year-over-year growth 2025-2030 (%)
Data Table on US - Year-over-year growth 2025-2030 (%)

12.4.2 Canada - Market size and forecast 2025-2030

Chart on Canada - Market size and forecast 2025-2030 ($ million)
Data Table on Canada - Market size and forecast 2025-2030 ($ million)
Chart on Canada - Year-over-year growth 2025-2030 (%)
Data Table on Canada - Year-over-year growth 2025-2030 (%)

12.4.3 Mexico - Market size and forecast 2025-2030

Chart on Mexico - Market size and forecast 2025-2030 ($ million)
Data Table on Mexico - Market size and forecast 2025-2030 ($ million)
Chart on Mexico - Year-over-year growth 2025-2030 (%)
Data Table on Mexico - Year-over-year growth 2025-2030 (%)

12.5 Europe - Market size and forecast 2025-2030

Chart on Europe - Market size and forecast 2025-2030 ($ million)
Data Table on Europe - Market size and forecast 2025-2030 ($ million)
Chart on Europe - Year-over-year growth 2025-2030 (%)
Data Table on Europe - Year-over-year growth 2025-2030 (%)
Chart on Regional Comparison - Europe
Data Table on Regional Comparison - Europe

12.5.1 Germany - Market size and forecast 2025-2030

Chart on Germany - Market size and forecast 2025-2030 ($ million)
Data Table on Germany - Market size and forecast 2025-2030 ($ million)
Chart on Germany - Year-over-year growth 2025-2030 (%)
Data Table on Germany - Year-over-year growth 2025-2030 (%)

12.5.2 UK - Market size and forecast 2025-2030

Chart on UK - Market size and forecast 2025-2030 ($ million)
Data Table on UK - Market size and forecast 2025-2030 ($ million)
Chart on UK - Year-over-year growth 2025-2030 (%)
Data Table on UK - Year-over-year growth 2025-2030 (%)

12.5.3 France - Market size and forecast 2025-2030

Chart on France - Market size and forecast 2025-2030 ($ million)
Data Table on France - Market size and forecast 2025-2030 ($ million)
Chart on France - Year-over-year growth 2025-2030 (%)
Data Table on France - Year-over-year growth 2025-2030 (%)

12.5.4 Italy - Market size and forecast 2025-2030

Chart on Italy - Market size and forecast 2025-2030 ($ million)
Data Table on Italy - Market size and forecast 2025-2030 ($ million)
Chart on Italy - Year-over-year growth 2025-2030 (%)
Data Table on Italy - Year-over-year growth 2025-2030 (%)

12.5.5 Spain - Market size and forecast 2025-2030

Chart on Spain - Market size and forecast 2025-2030 ($ million)
Data Table on Spain - Market size and forecast 2025-2030 ($ million)
Chart on Spain - Year-over-year growth 2025-2030 (%)
Data Table on Spain - Year-over-year growth 2025-2030 (%)

12.5.6 The Netherlands - Market size and forecast 2025-2030

Chart on The Netherlands - Market size and forecast 2025-2030 ($ million)
Data Table on The Netherlands - Market size and forecast 2025-2030 ($ million)
Chart on The Netherlands - Year-over-year growth 2025-2030 (%)
Data Table on The Netherlands - Year-over-year growth 2025-2030 (%)

12.6 Middle East and Africa - Market size and forecast 2025-2030

Chart on Middle East and Africa - Market size and forecast 2025-2030 ($ million)
Data Table on Middle East and Africa - Market size and forecast 2025-2030 ($ million)
Chart on Middle East and Africa - Year-over-year growth 2025-2030 (%)
Data Table on Middle East and Africa - Year-over-year growth 2025-2030 (%)
Chart on Regional Comparison - Middle East and Africa
Data Table on Regional Comparison - Middle East and Africa

12.6.1 Saudi Arabia - Market size and forecast 2025-2030

Chart on Saudi Arabia - Market size and forecast 2025-2030 ($ million)
Data Table on Saudi Arabia - Market size and forecast 2025-2030 ($ million)
Chart on Saudi Arabia - Year-over-year growth 2025-2030 (%)
Data Table on Saudi Arabia - Year-over-year growth 2025-2030 (%)

12.6.2 UAE - Market size and forecast 2025-2030

Chart on UAE - Market size and forecast 2025-2030 ($ million)
Data Table on UAE - Market size and forecast 2025-2030 ($ million)
Chart on UAE - Year-over-year growth 2025-2030 (%)
Data Table on UAE - Year-over-year growth 2025-2030 (%)

12.6.3 South Africa - Market size and forecast 2025-2030

Chart on South Africa - Market size and forecast 2025-2030 ($ million)
Data Table on South Africa - Market size and forecast 2025-2030 ($ million)
Chart on South Africa - Year-over-year growth 2025-2030 (%)
Data Table on South Africa - Year-over-year growth 2025-2030 (%)

12.6.4 Israel - Market size and forecast 2025-2030

Chart on Israel - Market size and forecast 2025-2030 ($ million)
Data Table on Israel - Market size and forecast 2025-2030 ($ million)
Chart on Israel - Year-over-year growth 2025-2030 (%)
Data Table on Israel - Year-over-year growth 2025-2030 (%)

12.6.5 Turkey - Market size and forecast 2025-2030

Chart on Turkey - Market size and forecast 2025-2030 ($ million)
Data Table on Turkey - Market size and forecast 2025-2030 ($ million)
Chart on Turkey - Year-over-year growth 2025-2030 (%)
Data Table on Turkey - Year-over-year growth 2025-2030 (%)

12.7 South America - Market size and forecast 2025-2030

Chart on South America - Market size and forecast 2025-2030 ($ million)
Data Table on South America - Market size and forecast 2025-2030 ($ million)
Chart on South America - Year-over-year growth 2025-2030 (%)
Data Table on South America - Year-over-year growth 2025-2030 (%)
Chart on Regional Comparison - South America
Data Table on Regional Comparison - South America

12.7.1 Brazil - Market size and forecast 2025-2030

Chart on Brazil - Market size and forecast 2025-2030 ($ million)
Data Table on Brazil - Market size and forecast 2025-2030 ($ million)
Chart on Brazil - Year-over-year growth 2025-2030 (%)
Data Table on Brazil - Year-over-year growth 2025-2030 (%)

12.7.2 Argentina - Market size and forecast 2025-2030

Chart on Argentina - Market size and forecast 2025-2030 ($ million)
Data Table on Argentina - Market size and forecast 2025-2030 ($ million)
Chart on Argentina - Year-over-year growth 2025-2030 (%)
Data Table on Argentina - Year-over-year growth 2025-2030 (%)

12.7.3 Chile - Market size and forecast 2025-2030

Chart on Chile - Market size and forecast 2025-2030 ($ million)
Data Table on Chile - Market size and forecast 2025-2030 ($ million)
Chart on Chile - Year-over-year growth 2025-2030 (%)
Data Table on Chile - Year-over-year growth 2025-2030 (%)

12.8 Market opportunity by geography

Market opportunity by geography ($ million)
Data Tables on Market opportunity by geography ($ million)

13. Drivers, Challenges, and Opportunity

13.1 Market drivers

Global infrastructure development and equipment deployment
Environmental regulations and biodegradable fluid adoption
Rapid proliferation of industrial automation and smart manufacturing

13.2 Market challenges

Regulatory restrictions on hazardous additives
Base oil price volatility and supply disruptions
Threat from electromechanical and fluidless alternatives

13.3 Impact of drivers and challenges

Impact of drivers and challenges in 2025 and 2030

13.4 Market opportunities

Fire-resistant hydraulic fluids in high-hazard heavy industries
Agricultural mechanization and electro-hydraulic systems
Advancements in synthetic and hydrocracked base stock refining

14. Competitive Landscape

14.1 Overview

14.2

Overview on criticality of inputs and factors of differentiation

14.3 Landscape disruption

Overview on factors of disruption

14.4 Industry risks

Impact of key risks on business

15. Competitive Analysis

15.1 Companies profiled

Companies covered

15.2 Company ranking index

15.3 Market positioning of companies

Matrix on companies position and classification

15.4 AMSOIL Inc.

AMSOIL Inc. - Overview
AMSOIL Inc. - Product / Service
AMSOIL Inc. - Key offerings
SWOT

15.5 BASF SE

BASF SE - Overview
BASF SE - Business segments
BASF SE - Key news
BASF SE - Key offerings
BASF SE - Segment focus
SWOT

15.6 BP Plc

BP Plc - Overview
BP Plc - Business segments
BP Plc - Key offerings
BP Plc - Segment focus
SWOT

15.7 Carl Bechem GmbH

Carl Bechem GmbH - Overview
Carl Bechem GmbH - Product / Service
Carl Bechem GmbH - Key offerings
SWOT

15.8 Chevron Corp.

Chevron Corp. - Overview
Chevron Corp. - Business segments
Chevron Corp. - Key news
Chevron Corp. - Key offerings
Chevron Corp. - Segment focus
SWOT

15.9 Dow Chemical Co.

Dow Chemical Co. - Overview
Dow Chemical Co. - Business segments
Dow Chemical Co. - Key news
Dow Chemical Co. - Key offerings
Dow Chemical Co. - Segment focus
SWOT

15.10 Eastman Chemical Co.

Eastman Chemical Co. - Overview
Eastman Chemical Co. - Business segments
Eastman Chemical Co. - Key offerings
Eastman Chemical Co. - Segment focus
SWOT

15.11 Eni SpA

Eni SpA - Overview
Eni SpA - Business segments
Eni SpA - Key offerings
Eni SpA - Segment focus
SWOT

15.12 FUCHS SE

FUCHS SE - Overview
FUCHS SE - Business segments
FUCHS SE - Key news
FUCHS SE - Key offerings
FUCHS SE - Segment focus
SWOT

15.13 Idemitsu Kosan Co. Ltd.

Idemitsu Kosan Co. Ltd. - Overview
Idemitsu Kosan Co. Ltd. - Business segments
Idemitsu Kosan Co. Ltd. - Key offerings
Idemitsu Kosan Co. Ltd. - Segment focus
SWOT

15.14 Phillips 66 Co.

Phillips 66 Co. - Overview
Phillips 66 Co. - Business segments
Phillips 66 Co. - Key offerings
Phillips 66 Co. - Segment focus
SWOT

15.15 PJSC LUKOIL

PJSC LUKOIL - Overview
PJSC LUKOIL - Business segments
PJSC LUKOIL - Key offerings
PJSC LUKOIL - Segment focus
SWOT

15.16 Repsol SA

Repsol SA - Overview
Repsol SA - Business segments
Repsol SA - Key offerings
Repsol SA - Segment focus
SWOT

15.17 Shell plc

Shell plc - Overview
Shell plc - Business segments
Shell plc - Key offerings
Shell plc - Segment focus
SWOT

15.18 TotalEnergies SE

TotalEnergies SE - Overview
TotalEnergies SE - Business segments
TotalEnergies SE - Key news
TotalEnergies SE - Key offerings
TotalEnergies SE - Segment focus
SWOT

16. Appendix

16.1 Scope of the report

Market definition
Objectives
Notes and caveats

16.2 Inclusions and exclusions checklist

Inclusions checklist
Exclusions checklist

16.3 Currency conversion rates for US$

16.4 Research methodology

16.5 Data procurement

Information sources

16.6 Data validation

16.7 Validation techniques employed for market sizing

16.8 Data synthesis

16.9 360 degree market analysis

16.10 List of abbreviations

Research Methodology

Technavio presents a detailed picture of the market by way of study, synthesis, and summation of data from multiple sources. The analysts have presented the various facets of the market with a particular focus on identifying the key industry influencers. The data thus presented is comprehensive, reliable, and the result of extensive research, both primary and secondary.

INFORMATION SOURCES

Primary sources

  • Manufacturers and suppliers
  • Channel partners
  • Industry experts
  • Strategic decision makers

Secondary sources

  • Industry journals and periodicals
  • Government data
  • Financial reports of key industry players
  • Historical data
  • Press releases

DATA ANALYSIS

Data Synthesis

  • Collation of data
  • Estimation of key figures
  • Analysis of derived insights

Data Validation

  • Triangulation with data models
  • Reference against proprietary databases
  • Corroboration with industry experts

REPORT WRITING

Qualitative

  • Market drivers
  • Market challenges
  • Market trends
  • Five forces analysis

Quantitative

  • Market size and forecast
  • Market segmentation
  • Geographical insights
  • Competitive landscape

Interested in this report?

Get your sample now to see our research methodology and insights!

Download Now

Frequently Asked Questions

Hydraulic Fluids market growth will increase by USD 1462.7 million during 2026-2030.

The Hydraulic Fluids market is expected to grow at a CAGR of 3% during 2026-2030.

Hydraulic Fluids market is segmented by Type (Mineral-base, Synthetic base, Bio-based) Application (Construction machinery, Agricultural machinery, Mining machinery, Oil and gas machinery, Others) Distribution channel (OEM, Aftermarket)

AMSOIL Inc., BASF SE, BP Plc, Carl Bechem GmbH, Castrol Ltd., Chevron Corp., Dow Chemical Co., Eastman Chemical Co., Eni SpA, FUCHS SE, Gulf Oil International Ltd., Idemitsu Kosan Co. Ltd., Kluber Lubrication Munchen SE, LIQUI MOLY GmbH, MOTOREX-BUCHER Group AG, MOTUL SA, NYCO, Petro Canada Lubricants Inc., Phillips 66 Co., PJSC LUKOIL, Repsol SA, Schaeffer Manufacturing Co., Shell plc, TotalEnergies SE, Valvoline Inc. are a few of the key vendors in the Hydraulic Fluids market.

APAC will register the highest growth rate of 45.3% among the other regions. Therefore, the Hydraulic Fluids market in APAC is expected to garner significant business opportunities for the vendors during the forecast period.

China, Japan, India, South Korea, Australia, Indonesia, US, Canada, Mexico, Germany, UK, France, Italy, Spain, The Netherlands, Saudi Arabia, UAE, South Africa, Israel, Turkey, Brazil, Argentina, Chile

  • Global infrastructure development and equipment deployment is the driving factor this market.

The Hydraulic Fluids market vendors should focus on grabbing business opportunities from the Type segment as it accounted for the largest market share in the base year.
RIA - Research AI Assistant
Ask RIA