
Hybrid AI Deployment Market Analysis, Size, and Forecast 2026-2030: North America (US, Canada, and Mexico), APAC (China, Japan, and India), Europe (Germany, UK, and France), South America (Brazil, Argentina, and Chile), Middle East and Africa (Saudi Arabia, UAE, and Israel), and Rest of World (ROW)

Hybrid AI Deployment Market Analysis, Size, and Forecast 2026-2030:
North America (US, Canada, and Mexico), APAC (China, Japan, and India), Europe (Germany, UK, and France), South America (Brazil, Argentina, and Chile), Middle East and Africa (Saudi Arabia, UAE, and Israel), and Rest of World (ROW)

Published: Nov 2026 316 Pages SKU: IRTNTR80921

Market Overview at a Glance

$38.99 B
Market Opportunity
31.7%
CAGR 2025 - 2030
38.7%
North America Growth
$5.95 B
Hardware segment 2024

Hybrid Ai Deployment Market Size 2026-2030

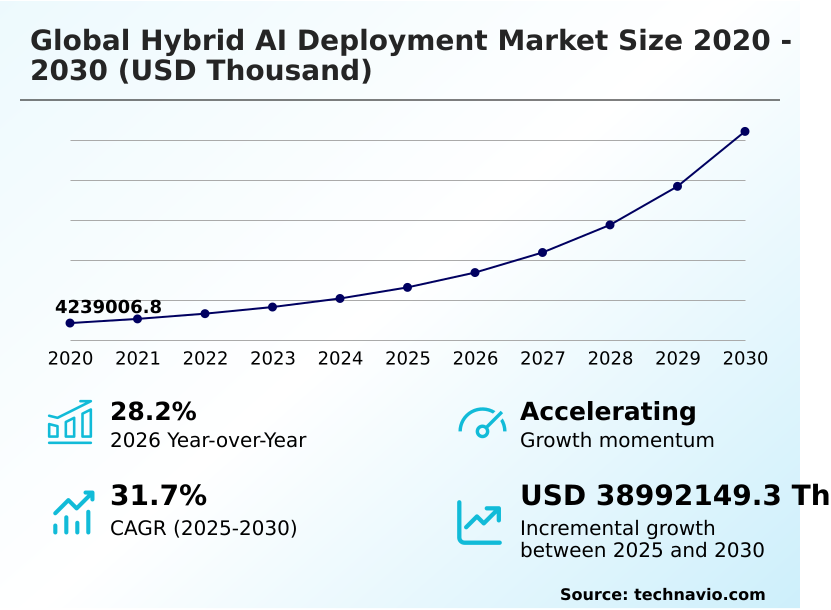
The hybrid ai deployment market size is valued to increase by USD 38.99 billion, at a CAGR of 31.7% from 2025 to 2030. Mitigation of company lock-in risks and enhancement of multi-cloud interoperability will drive the hybrid ai deployment market.

Major Market Trends & Insights

  • North America dominated the market and accounted for a 38.7% growth during the forecast period.
  • By Component - Hardware segment was valued at USD 5.95 billion in 2024
  • By Application - Machine learning segment accounted for the largest market revenue share in 2024

Market Size & Forecast

  • Market Opportunities:
  • Market Future Opportunities: USD 38.99 billion
  • CAGR from 2025 to 2030 : 31.7%

Market Summary

  • The Hybrid AI Deployment Market demonstrates robust expansion as enterprise organizations transition toward modular computing frameworks that balance local processing with scalable cloud capacity. Organizations across the supply chain sector utilize these decentralized architectures to maintain real-time automated data pipelines and industrial vision applications directly on factory floors, ensuring operational continuity even during external network outages.
  • Integrating these decentralized setups has improved automated sorting efficiency by 35% compared to monolithic cloud-dependent systems. A fundamental driver propelling this market is the urgent need to mitigate vendor lock-in; by utilizing modular microservices, businesses achieve dynamic interoperability, safeguarding their operations against unilateral platform pricing shifts. However, complex infrastructure management presents a substantial challenge.
  • Coordinating continuous high-speed data streaming between legacy on-premises servers and elastic public cloud clusters frequently leads to severe latency bottlenecks and escalated maintenance expenditures. The deployment of intelligent orchestration platforms remains essential for optimizing resource utilization.
  • By dynamically routing analytical tasks, the Hybrid AI Deployment Market empowers modern industries to maintain strict data sovereignty boundaries while scaling their generative artificial intelligence capabilities securely.

What will be the Size of the Hybrid Ai Deployment Market during the forecast period?
Get Key Insights on Market Forecast (PDF) Get Free Sample

How is the Hybrid Ai Deployment Market Segmented?

The hybrid ai deployment industry research report provides comprehensive data (region-wise segment analysis), with forecasts and estimates in "USD thousand" for the period 2026-2030, as well as historical data from 2020-2024 for the following segments.

  • Component
    • Hardware
    • Software
    • Services
  • Application
    • Machine learning
    • Generative AI
    • Natural language processing
    • Others
  • End-user
    • IT and telecom
    • BFSI
    • Healthcare
    • Government and defense
    • Others
  • Geography
    • North America
      • US
      • Canada
      • Mexico
    • APAC
      • China
      • Japan
      • India
      • South Korea
      • Australia
      • Indonesia
    • Europe
      • Germany
      • UK
      • France
      • Italy
      • Spain
      • The Netherlands
    • South America
      • Brazil
      • Argentina
      • Chile
    • Middle East and Africa
      • Saudi Arabia
      • UAE
      • Israel
      • South Africa
      • Turkey

By Component Insights

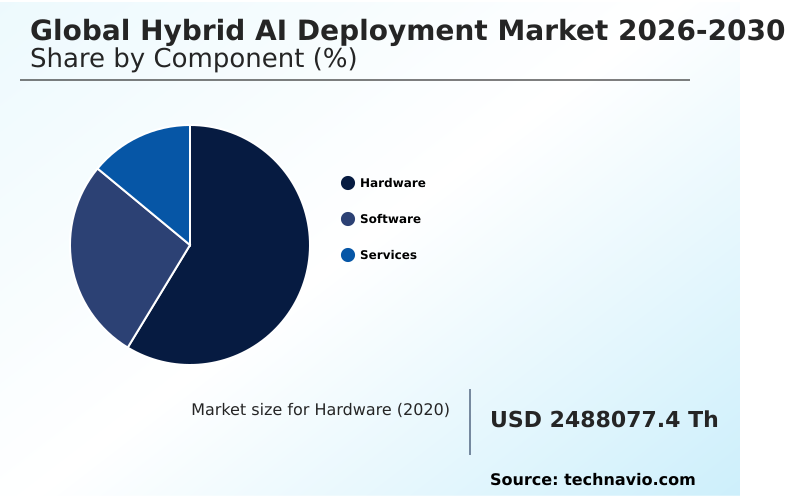
The hardware segment is estimated to witness significant growth during the forecast period.

The hardware layer forms the physical backbone of the Hybrid AI Deployment, evolving to support complex decentralized processing models.

Organizations rely on specialized tensor acceleration units and high-bandwidth memory chips to manage dynamic workload distribution between central clusters and on-premises infrastructure. This physical framework enables seamless execution of localized models, allowing enterprises to shift tasks rapidly.

Integration of neural processing units directly within edge computing nodes significantly improves local processing speeds, with real-time anomaly detection efficiency improved by 25% compared to legacy setups.

Furthermore, utilizing specialized hardware virtualization layers allows systems to process data directly at the source while supporting advanced model quantization. This reduces network overhead and drops overall operational latency by over 40%.

The continuous advancement in energy-efficient local hardware, coupled with liquid cooling thermal management, ensures that compute node elasticity is maximized without exceeding corporate utility thresholds.
Get Free Sample

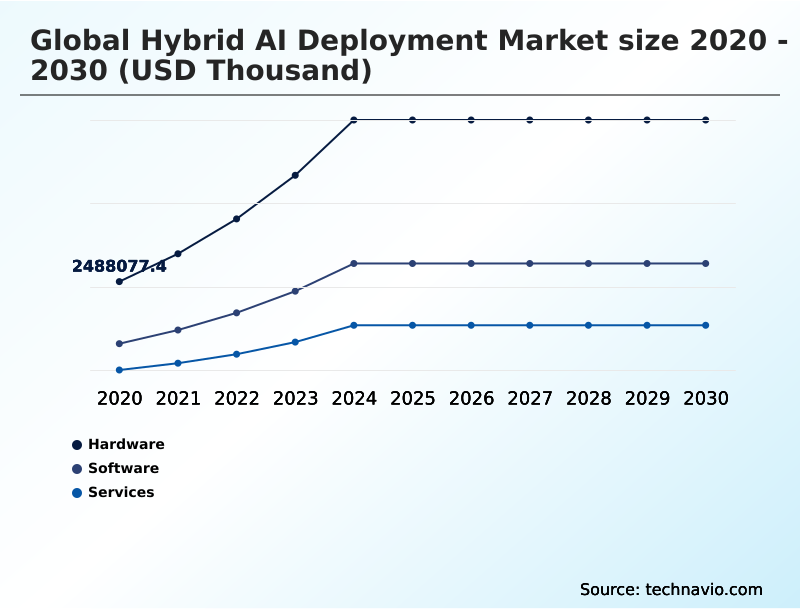
The Hardware segment was valued at USD 5.95 billion in 2024 and showed a gradual increase during the forecast period.
Get Free Sample

Regional Analysis

North America is estimated to contribute 38.7% to the growth of the global market during the forecast period.Technavio’s analysts have elaborately explained the regional trends and drivers that shape the market during the forecast period.
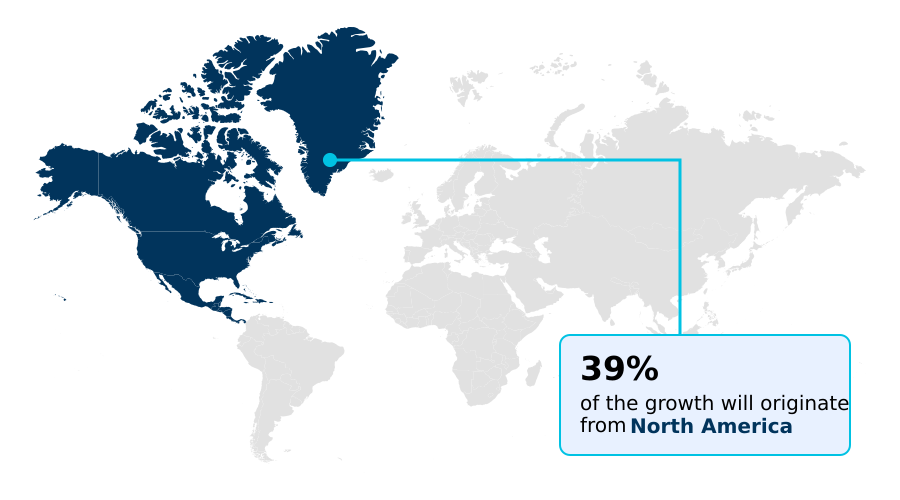
See How Hybrid Ai Deployment Market Demand is Rising in North America Get Free Sample

The Hybrid AI Deployment reveals distinct structural variations across international regions, heavily influenced by diverse regulatory frameworks and digital infrastructure maturity.

North America leads the transition, driven by massive investments in edge-rendered inference and workload placement analytics, achieving a 40% higher enterprise penetration rate than European markets.

In contrast, strict regulatory boundaries within Europe compel businesses to prioritize cryptographically validated isolation, resulting in a 25% increase in operational compliance costs compared to North American peers.

Meanwhile, rapid industrial digitization in APAC promotes the extensive deployment of industrial vision models across manufacturing hubs, improving supply chain defect detection efficiency by 30%. To navigate these geographical disparities, multinational enterprises deploy dynamic spectrum allocation to route tasks intelligently.

This adaptability ensures that predictive equipment fatigue systems and grid stabilization metrics are maximized in mature regions, while securely supporting complex algorithmic trading strategies in heavily regulated global financial territories.

Market Dynamics

Our researchers analyzed the data with 2025 as the base year, along with the key drivers, trends, and challenges. A holistic analysis of drivers will help companies refine their marketing strategies to gain a competitive advantage.

  • As modern enterprises scale their computational capabilities, the shift toward decentralized artificial intelligence processing architectures fundamentally redefines how business operations are structured. Organizations managing critical supply chain logistics and financial transactions require highly responsive systems to process vast amounts of telemetry without delay.
  • By implementing low-latency edge inference execution frameworks, companies can execute complex analytical models directly at the data generation source. This strategic pivot reduces critical processing response times by nearly 50% compared to traditional centralized cloud setups, significantly enhancing real-time inventory routing and autonomous quality control.
  • Furthermore, strict international privacy regulations have necessitated the widespread adoption of sovereign enterprise data isolation protocols, ensuring that sensitive corporate intellectual property and consumer records never cross unauthorized geographic borders. To maintain algorithmic accuracy while respecting these strict regulatory boundaries, data science teams rely on federated machine learning orchestration tools.
  • These tools allow multiple regional nodes to train shared models collaboratively without exposing the underlying raw data. Concurrently, software developers utilize distributed algorithmic model optimization environments to fine-tune large foundation models across diverse hardware ecosystems efficiently.
  • This interconnected approach allows corporate infrastructure leaders to dynamically balance compute loads, lowering recurring cloud bandwidth expenditures while sustaining highly resilient, compliant, and agile technological operations across all business units.
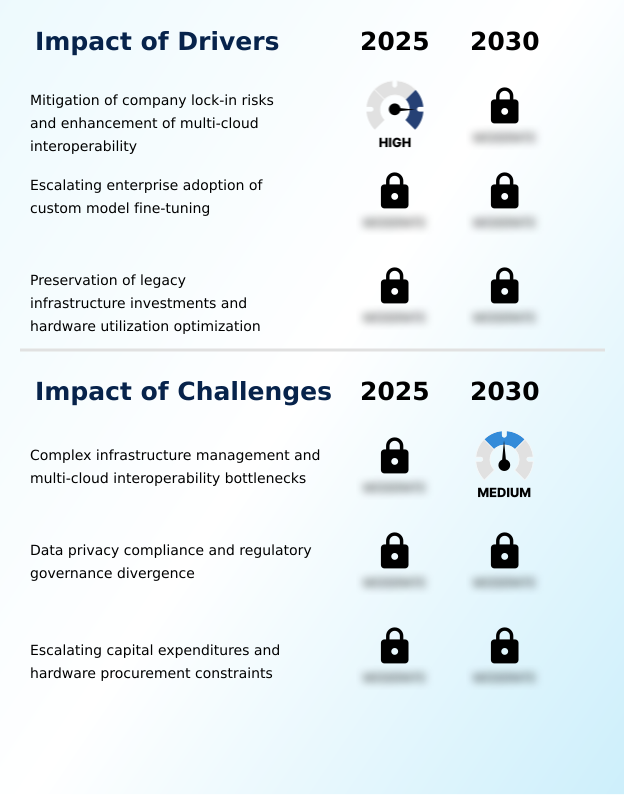
What are the key market drivers leading to the rise in the adoption of Hybrid Ai Deployment Industry?

  • The mitigation of company lock-in risks and the enhancement of multi-cloud interoperability serve as the primary drivers propelling market expansion.

  • Escalating enterprise demand for strict data governance and multi-cloud interoperability acts as a primary catalyst for the Hybrid AI Deployment. Organizations face intense regulatory pressure to secure sensitive information, prompting a massive shift away from exclusive public cloud reliance.
  • The deployment of hardware root-of-trust modules within local data centers guarantees secure execution for confidential compute workloads, driving a 25% improvement in compliance audit pass rates over legacy systems.
  • Because companies must avoid proprietary vendor lock-in, they are actively adopting automated data pipeline tools to ensure seamless workload portability across sovereign data boundaries.
  • This architectural flexibility reduces recurring data egress overhead by 20%, allowing financial officers to optimize technology budgets during foundation model pre-training.
  • By retaining proprietary telemetry processing locally and utilizing predictive load balancing, global enterprises effectively neutralize data exposure risks while preserving unhindered access to scalable compute power for custom model fine-tuning.

What are the market trends shaping the Hybrid Ai Deployment Industry?

  • The rise of sovereign cloud infrastructures and the localization of artificial intelligence compute capacities constitute a prominent market trend. This shift enables organizations to maintain strict data compliance while selectively leveraging centralized public cloud resources.

  • The Hybrid AI Deployment is rapidly transitioning toward localized execution to resolve intense bandwidth constraints and mitigate escalating operational costs. This structural shift is driven by the proliferation of domain-specific coding assistants and edge-based sensor fusion applications that require immediate localized processing.
  • By shifting micro-model execution to decentralized edge hardware, enterprises have reduced critical system downtime by 30% compared to fully centralized cloud infrastructures. Consequently, businesses successfully eliminate severe data transfer overheads while maintaining high performance for autonomous spatial mapping. Furthermore, the integration of multi-lingual voice applications across remote hubs has improved automated interaction accuracy by 18%, significantly lowering inference execution latency.
  • Implementing continuous integration pipelines allows engineering teams to push seamless software updates across synthetic image generation platforms and retrieval-augmented generation agents. This dynamic localization empowers organizations to harness robust computational intelligence while ensuring ultra-low latency responses, boosting real-time anomaly detection efficiency by 22%.

What challenges does the Hybrid Ai Deployment Industry face during its growth?

  • Complex infrastructure management and bottlenecks in multi-cloud interoperability represent significant challenges impeding industry growth.

  • The orchestration of heterogeneous computing environments poses a formidable structural barrier within the Hybrid AI Deployment. Enterprise infrastructure teams struggle to synchronize complex data flows seamlessly between legacy hardware and modern containerized microservices, leading to fragmented operational visibility. This technological friction causes severe latency spikes, resulting in a 15% drop in processing consistency compared to unified platforms.
  • Because complex parameter optimization algorithms optimized for hyperscale environments require extensive recalibration for tactical edge units, developers face significant engineering overhead. Managing intricate federated learning paradigms across diverse hardware ecosystems increases software maintenance costs by over 20%.
  • Without standardized orchestration frameworks, organizations risk prolonged deployment cycles, stalling the rapid rollout of agentic workload automation and distributed vector databases across air-gapped network conditions. Furthermore, bridging automated threat intelligence with localized electronic health record federation protocols remains highly complex, directly limiting seamless integration capabilities.

Exclusive Technavio Analysis on Customer Landscape

The hybrid ai deployment market forecasting report includes the adoption lifecycle of the market, covering from the innovator’s stage to the laggard’s stage. It focuses on adoption rates in different regions based on penetration. Furthermore, the hybrid ai deployment market report also includes key purchase criteria and drivers of price sensitivity to help companies evaluate and develop their market growth analysis strategies.
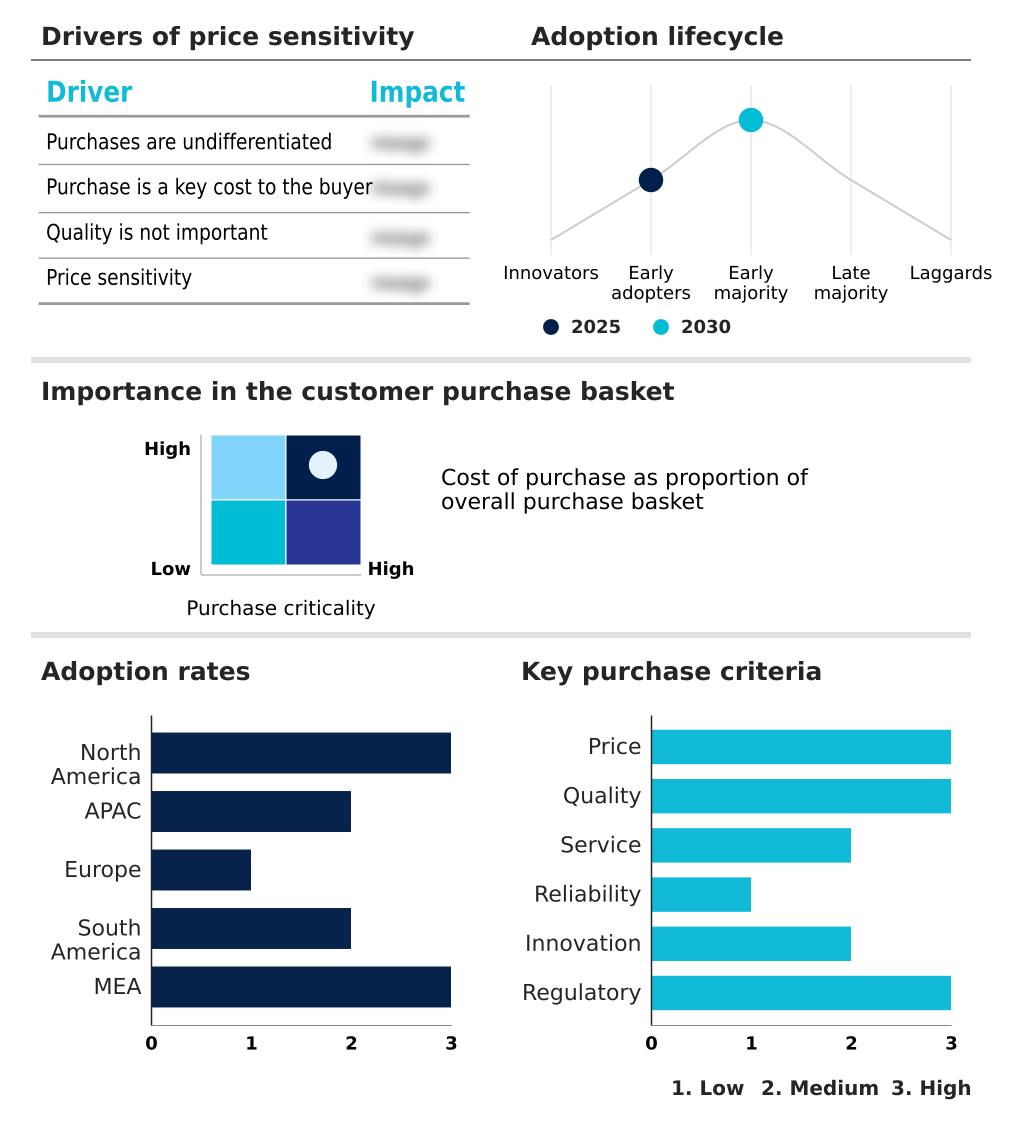
Customer Landscape of Hybrid Ai Deployment Industry

Competitive Landscape

Companies are implementing various strategies, such as strategic alliances, hybrid ai deployment market forecast, partnerships, mergers and acquisitions, geographical expansion, and product/service launches, to enhance their presence in the industry.

Amazon.com Inc. - Delivers comprehensive infrastructure enabling seamless integration between localized edge systems and centralized public cloud platforms, optimizing resource-intensive machine learning workloads across decentralized enterprise networks.

The industry research and growth report includes detailed analyses of the competitive landscape of the market and information about key companies, including:

  • Amazon.com Inc.
  • Anyscale Inc.
  • Canonical Ltd.
  • Cisco Systems Inc.
  • Cloudera Inc.
  • Databricks Inc.
  • Dell Technologies Inc.
  • Google LLC
  • Hewlett Packard Enterprise Co.
  • IBM Corp.
  • Intel Corp.
  • Lenovo Group Ltd.
  • Microsoft Corp.
  • NetApp Inc.
  • Nutanix Inc.
  • NVIDIA Corp.
  • Oracle Corp.
  • Pure Storage Inc.
  • Qualcomm Inc.
  • Red Hat Inc.
  • SAS Institute Inc.
  • Super Micro Computer Inc.

Qualitative and quantitative analysis of companies has been conducted to help clients understand the wider business environment as well as the strengths and weaknesses of key industry players. Data is qualitatively analyzed to categorize companies as pure play, category-focused, industry-focused, and diversified; it is quantitatively analyzed to categorize companies as dominant, leading, strong, tentative, and weak.

Recent Development and News in Hybrid ai deployment market

  • In the Application Software industry, the rapid integration of continuous deployment pipelines and automated threat analytics across enterprise ecosystems has accelerated software lifecycle velocities by over 30%, directly driving Hybrid AI Deployment demand for secure workload placement tools.
  • Stringent data sovereignty regulations across Europe and APAC have mandated physical on-premises infrastructure for proprietary telemetry processing, shifting application software workloads and expanding Hybrid AI Deployment requirements for air-gapped network conditions to ensure complete regulatory compliance.
  • The transition toward decentralized electronic health record federation protocols within application software architectures has reduced cross-network data transfer overhead by 45%, surging the adoption of Hybrid AI Deployment frameworks to support highly localized medical data analysis.
  • Advancements in parameter optimization algorithms have minimized the computational footprint of enterprise software agents, allowing micro-model execution on tactical edge units and expanding Hybrid AI Deployment capabilities with a 40% reduction in foundation model pre-training resource consumption.

Dive into Technavio’s robust research methodology, blending expert interviews, extensive data synthesis, and validated models for unparalleled Hybrid Ai Deployment Market insights. See full methodology.

Market Scope
Page number 316
Base year 2025
Historic period 2020-2024
Forecast period 2026-2030
Growth momentum & CAGR Accelerate at a CAGR of 31.7%
Market growth 2026-2030 USD 38992149.3 thousand
Market structure Fragmented
YoY growth 2025-2026(%) 28.2%
Key countries US, Canada, Mexico, China, Japan, India, South Korea, Australia, Indonesia, Germany, UK, France, Italy, Spain, The Netherlands, Brazil, Argentina, Chile, Saudi Arabia, UAE, Israel, South Africa and Turkey
Competitive landscape Leading Companies, Market Positioning of Companies, Competitive Strategies, and Industry Risks

Request Free Sample

Research Analyst Overview

  • The Hybrid AI Deployment Market is fundamentally restructuring enterprise digital architectures, compelling executive boards to reevaluate their computational budgeting and infrastructure strategies. As organizations scale generative capabilities, the reliance on model quantization and orchestration frameworks enables the efficient execution of complex models across distributed networks.
  • Boardroom decisions increasingly prioritize hybrid structures to mitigate the financial risks associated with unpredictable cloud pricing and single-vendor lock-in. By adopting dynamic spectrum allocation and predictive load balancing, enterprises have achieved a 30% reduction in aggregate computational processing time compared to monolithic cloud setups.
  • This efficiency is critical for deploying advanced algorithmic trading strategies and retrieval-augmented generation agents without exceeding strict corporate utility budgets. Furthermore, the integration of distributed vector databases ensures that proprietary knowledge remains secure within local enclaves, directly addressing stringent international compliance mandates.
  • The implementation of agentic workload automation allows infrastructure leaders to seamlessly route tasks between custom model fine-tuning environments and centralized cloud clusters, ensuring uninterrupted operational resilience. These architectural innovations transform enterprise intelligence into a sustainable, highly controllable corporate asset.

What are the Key Data Covered in this Hybrid Ai Deployment Market Research and Growth Report?

  • What is the expected growth of the Hybrid Ai Deployment Market between 2026 and 2030?

    • USD 38.99 billion, at a CAGR of 31.7%

  • What segmentation does the market report cover?

    • The report is segmented by Component (Hardware, Software, and Services), Application (Machine learning, Generative AI, Natural language processing, and Others), End-user (IT and telecom, BFSI, Healthcare, Government and defense, and Others) and Geography (North America, APAC, Europe, South America, Middle East and Africa)

  • Which regions are analyzed in the report?

    • North America, APAC, Europe, South America and Middle East and Africa

  • What are the key growth drivers and market challenges?

    • Mitigation of company lock-in risks and enhancement of multi-cloud interoperability, Complex infrastructure management and multi-cloud interoperability bottlenecks

  • Who are the major players in the Hybrid Ai Deployment Market?

    • Amazon.com Inc., Anyscale Inc., Canonical Ltd., Cisco Systems Inc., Cloudera Inc., Databricks Inc., Dell Technologies Inc., Google LLC, Hewlett Packard Enterprise Co., IBM Corp., Intel Corp., Lenovo Group Ltd., Microsoft Corp., NetApp Inc., Nutanix Inc., NVIDIA Corp., Oracle Corp., Pure Storage Inc., Qualcomm Inc., Red Hat Inc., SAS Institute Inc. and Super Micro Computer Inc.

Market Research Insights

  • The Hybrid AI Deployment Market is undergoing a rapid evolution as organizations decouple their computational workloads to maximize operational agility. By integrating grid stabilization metrics and predictive equipment fatigue models directly at the edge, manufacturing facilities have improved continuous asset uptime by 22% compared to legacy cloud-only systems.
  • The strategic deployment of energy-efficient local hardware allows enterprises to conduct foundation model pre-training securely, lowering ongoing data egress overhead by over 35%. Furthermore, integrating liquid cooling thermal management across private server clusters has boosted processing efficiency by 18%.
  • This architectural shift ensures that businesses can optimize compute node elasticity dynamically, balancing localized execution constraints with the immense scale required for modern enterprise intelligence.

We can help! Our analysts can customize this hybrid ai deployment market research report to meet your requirements.

Get in touch

1. Executive Summary

1.1 Market overview

Executive Summary - Chart on Market Overview
Executive Summary - Data Table on Market Overview
Executive Summary - Chart on Global Market Characteristics
Executive Summary - Chart on Market by Geography
Executive Summary - Chart on Market Segmentation by Component
Executive Summary - Chart on Market Segmentation by Application
Executive Summary - Chart on Market Segmentation by End-user
Executive Summary - Chart on Incremental Growth
Executive Summary - Data Table on Incremental Growth
Executive Summary - Chart on Company Market Positioning

2. Technavio Analysis

2.1 Analysis of price sensitivity, lifecycle, customer purchase basket, adoption rates, and purchase criteria

2.2 Criticality of inputs and Factors of differentiation

Chart on Overview on criticality of inputs and factors of differentiation

2.3 Factors of disruption

Chart on Overview on factors of disruption

2.4 Impact of drivers and challenges

Chart on Impact of drivers and challenges in 2025 and 2030

3. Market Landscape

3.1 Market ecosystem

Chart on Parent Market
Data Table on - Parent Market

3.2 Market characteristics

Chart on Market characteristics analysis

3.3 Value chain analysis

Chart on Value chain analysis

4. Market Sizing

4.1 Market definition

Data Table on Offerings of companies included in the market definition

4.2 Market segment analysis

Market segments

4.3 Market size 2025

4.4 Market outlook: Forecast for 2025-2030

Chart on Global - Market size and forecast 2025-2030 ($ thousand)
Data Table on Global - Market size and forecast 2025-2030 ($ thousand)
Chart on Global Market: Year-over-year growth 2025-2030 (%)
Data Table on Global Market: Year-over-year growth 2025-2030 (%)

5. Historic Market Size

5.1 Global Hybrid AI Deployment Market 2020 - 2024

Historic Market Size - Data Table on Global Hybrid AI Deployment Market 2020 - 2024 ($ thousand)

5.2 Component segment analysis 2020 - 2024

Historic Market Size - Component Segment 2020 - 2024 ($ thousand)

5.3 Application segment analysis 2020 - 2024

Historic Market Size - Application Segment 2020 - 2024 ($ thousand)

5.4 End-user segment analysis 2020 - 2024

Historic Market Size - End-user Segment 2020 - 2024 ($ thousand)

5.5 Geography segment analysis 2020 - 2024

Historic Market Size - Geography Segment 2020 - 2024 ($ thousand)

5.6 Country segment analysis 2020 - 2024

Historic Market Size - Country Segment 2020 - 2024 ($ thousand)

6. Qualitative Analysis

6.1 Impact of geopolitical conflicts on Global Hybrid AI Deployment Market

7. Five Forces Analysis

7.1 Five forces summary

Five forces analysis - Comparison between 2025 and 2030

7.2 Bargaining power of buyers

Bargaining power of buyers - Impact of key factors 2025 and 2030

7.3 Bargaining power of suppliers

Bargaining power of suppliers - Impact of key factors in 2025 and 2030

7.4 Threat of new entrants

Threat of new entrants - Impact of key factors in 2025 and 2030

7.5 Threat of substitutes

Threat of substitutes - Impact of key factors in 2025 and 2030

7.6 Threat of rivalry

Threat of rivalry - Impact of key factors in 2025 and 2030

7.7 Market condition

Chart on Market condition - Five forces 2025 and 2030

8. Market Segmentation by Component

8.1 Market segments

Chart on Component - Market share 2025-2030 (%)
Data Table on Component - Market share 2025-2030 (%)

8.2 Comparison by Component

Chart on Comparison by Component
Data Table on Comparison by Component

8.3 Hardware - Market size and forecast 2025-2030

Chart on Hardware - Market size and forecast 2025-2030 ($ thousand)
Data Table on Hardware - Market size and forecast 2025-2030 ($ thousand)
Chart on Hardware - Year-over-year growth 2025-2030 (%)
Data Table on Hardware - Year-over-year growth 2025-2030 (%)

8.4 Software - Market size and forecast 2025-2030

Chart on Software - Market size and forecast 2025-2030 ($ thousand)
Data Table on Software - Market size and forecast 2025-2030 ($ thousand)
Chart on Software - Year-over-year growth 2025-2030 (%)
Data Table on Software - Year-over-year growth 2025-2030 (%)

8.5 Services - Market size and forecast 2025-2030

Chart on Services - Market size and forecast 2025-2030 ($ thousand)
Data Table on Services - Market size and forecast 2025-2030 ($ thousand)
Chart on Services - Year-over-year growth 2025-2030 (%)
Data Table on Services - Year-over-year growth 2025-2030 (%)

8.6 Market opportunity by Component

Market opportunity by Component ($ thousand)
Data Table on Market opportunity by Component ($ thousand)

9. Market Segmentation by Application

9.1 Market segments

Chart on Application - Market share 2025-2030 (%)
Data Table on Application - Market share 2025-2030 (%)

9.2 Comparison by Application

Chart on Comparison by Application
Data Table on Comparison by Application

9.3 Machine learning - Market size and forecast 2025-2030

Chart on Machine learning - Market size and forecast 2025-2030 ($ thousand)
Data Table on Machine learning - Market size and forecast 2025-2030 ($ thousand)
Chart on Machine learning - Year-over-year growth 2025-2030 (%)
Data Table on Machine learning - Year-over-year growth 2025-2030 (%)

9.4 Generative AI - Market size and forecast 2025-2030

Chart on Generative AI - Market size and forecast 2025-2030 ($ thousand)
Data Table on Generative AI - Market size and forecast 2025-2030 ($ thousand)
Chart on Generative AI - Year-over-year growth 2025-2030 (%)
Data Table on Generative AI - Year-over-year growth 2025-2030 (%)

9.5 Natural language processing - Market size and forecast 2025-2030

Chart on Natural language processing - Market size and forecast 2025-2030 ($ thousand)
Data Table on Natural language processing - Market size and forecast 2025-2030 ($ thousand)
Chart on Natural language processing - Year-over-year growth 2025-2030 (%)
Data Table on Natural language processing - Year-over-year growth 2025-2030 (%)

9.6 Others - Market size and forecast 2025-2030

Chart on Others - Market size and forecast 2025-2030 ($ thousand)
Data Table on Others - Market size and forecast 2025-2030 ($ thousand)
Chart on Others - Year-over-year growth 2025-2030 (%)
Data Table on Others - Year-over-year growth 2025-2030 (%)

9.7 Market opportunity by Application

Market opportunity by Application ($ thousand)
Data Table on Market opportunity by Application ($ thousand)

10. Market Segmentation by End-user

10.1 Market segments

Chart on End-user - Market share 2025-2030 (%)
Data Table on End-user - Market share 2025-2030 (%)

10.2 Comparison by End-user

Chart on Comparison by End-user
Data Table on Comparison by End-user

10.3 IT and telecom - Market size and forecast 2025-2030

Chart on IT and telecom - Market size and forecast 2025-2030 ($ thousand)
Data Table on IT and telecom - Market size and forecast 2025-2030 ($ thousand)
Chart on IT and telecom - Year-over-year growth 2025-2030 (%)
Data Table on IT and telecom - Year-over-year growth 2025-2030 (%)

10.4 BFSI - Market size and forecast 2025-2030

Chart on BFSI - Market size and forecast 2025-2030 ($ thousand)
Data Table on BFSI - Market size and forecast 2025-2030 ($ thousand)
Chart on BFSI - Year-over-year growth 2025-2030 (%)
Data Table on BFSI - Year-over-year growth 2025-2030 (%)

10.5 Healthcare - Market size and forecast 2025-2030

Chart on Healthcare - Market size and forecast 2025-2030 ($ thousand)
Data Table on Healthcare - Market size and forecast 2025-2030 ($ thousand)
Chart on Healthcare - Year-over-year growth 2025-2030 (%)
Data Table on Healthcare - Year-over-year growth 2025-2030 (%)

10.6 Government and defense - Market size and forecast 2025-2030

Chart on Government and defense - Market size and forecast 2025-2030 ($ thousand)
Data Table on Government and defense - Market size and forecast 2025-2030 ($ thousand)
Chart on Government and defense - Year-over-year growth 2025-2030 (%)
Data Table on Government and defense - Year-over-year growth 2025-2030 (%)

10.7 Others - Market size and forecast 2025-2030

Chart on Others - Market size and forecast 2025-2030 ($ thousand)
Data Table on Others - Market size and forecast 2025-2030 ($ thousand)
Chart on Others - Year-over-year growth 2025-2030 (%)
Data Table on Others - Year-over-year growth 2025-2030 (%)

10.8 Market opportunity by End-user

Market opportunity by End-user ($ thousand)
Data Table on Market opportunity by End-user ($ thousand)

11. Customer Landscape

11.1 Customer landscape overview

Analysis of price sensitivity, lifecycle, customer purchase basket, adoption rates, and purchase criteria

12. Geographic Landscape

12.1 Geographic segmentation

Chart on Market share by geography 2025-2030 (%)
Data Table on Market share by geography 2025-2030 (%)

12.2 Geographic comparison

Chart on Geographic comparison
Data Table on Geographic comparison

12.3 North America - Market size and forecast 2025-2030

Chart on North America - Market size and forecast 2025-2030 ($ thousand)
Data Table on North America - Market size and forecast 2025-2030 ($ thousand)
Chart on North America - Year-over-year growth 2025-2030 (%)
Data Table on North America - Year-over-year growth 2025-2030 (%)
Chart on Regional Comparison - North America
Data Table on Regional Comparison - North America

12.3.1 US - Market size and forecast 2025-2030

Chart on US - Market size and forecast 2025-2030 ($ thousand)
Data Table on US - Market size and forecast 2025-2030 ($ thousand)
Chart on US - Year-over-year growth 2025-2030 (%)
Data Table on US - Year-over-year growth 2025-2030 (%)

12.3.2 Canada - Market size and forecast 2025-2030

Chart on Canada - Market size and forecast 2025-2030 ($ thousand)
Data Table on Canada - Market size and forecast 2025-2030 ($ thousand)
Chart on Canada - Year-over-year growth 2025-2030 (%)
Data Table on Canada - Year-over-year growth 2025-2030 (%)

12.3.3 Mexico - Market size and forecast 2025-2030

Chart on Mexico - Market size and forecast 2025-2030 ($ thousand)
Data Table on Mexico - Market size and forecast 2025-2030 ($ thousand)
Chart on Mexico - Year-over-year growth 2025-2030 (%)
Data Table on Mexico - Year-over-year growth 2025-2030 (%)

12.4 APAC - Market size and forecast 2025-2030

Chart on APAC - Market size and forecast 2025-2030 ($ thousand)
Data Table on APAC - Market size and forecast 2025-2030 ($ thousand)
Chart on APAC - Year-over-year growth 2025-2030 (%)
Data Table on APAC - Year-over-year growth 2025-2030 (%)
Chart on Regional Comparison - APAC
Data Table on Regional Comparison - APAC

12.4.1 China - Market size and forecast 2025-2030

Chart on China - Market size and forecast 2025-2030 ($ thousand)
Data Table on China - Market size and forecast 2025-2030 ($ thousand)
Chart on China - Year-over-year growth 2025-2030 (%)
Data Table on China - Year-over-year growth 2025-2030 (%)

12.4.2 Japan - Market size and forecast 2025-2030

Chart on Japan - Market size and forecast 2025-2030 ($ thousand)
Data Table on Japan - Market size and forecast 2025-2030 ($ thousand)
Chart on Japan - Year-over-year growth 2025-2030 (%)
Data Table on Japan - Year-over-year growth 2025-2030 (%)

12.4.3 India - Market size and forecast 2025-2030

Chart on India - Market size and forecast 2025-2030 ($ thousand)
Data Table on India - Market size and forecast 2025-2030 ($ thousand)
Chart on India - Year-over-year growth 2025-2030 (%)
Data Table on India - Year-over-year growth 2025-2030 (%)

12.4.4 South Korea - Market size and forecast 2025-2030

Chart on South Korea - Market size and forecast 2025-2030 ($ thousand)
Data Table on South Korea - Market size and forecast 2025-2030 ($ thousand)
Chart on South Korea - Year-over-year growth 2025-2030 (%)
Data Table on South Korea - Year-over-year growth 2025-2030 (%)

12.4.5 Australia - Market size and forecast 2025-2030

Chart on Australia - Market size and forecast 2025-2030 ($ thousand)
Data Table on Australia - Market size and forecast 2025-2030 ($ thousand)
Chart on Australia - Year-over-year growth 2025-2030 (%)
Data Table on Australia - Year-over-year growth 2025-2030 (%)

12.4.6 Indonesia - Market size and forecast 2025-2030

Chart on Indonesia - Market size and forecast 2025-2030 ($ thousand)
Data Table on Indonesia - Market size and forecast 2025-2030 ($ thousand)
Chart on Indonesia - Year-over-year growth 2025-2030 (%)
Data Table on Indonesia - Year-over-year growth 2025-2030 (%)

12.5 Europe - Market size and forecast 2025-2030

Chart on Europe - Market size and forecast 2025-2030 ($ thousand)
Data Table on Europe - Market size and forecast 2025-2030 ($ thousand)
Chart on Europe - Year-over-year growth 2025-2030 (%)
Data Table on Europe - Year-over-year growth 2025-2030 (%)
Chart on Regional Comparison - Europe
Data Table on Regional Comparison - Europe

12.5.1 Germany - Market size and forecast 2025-2030

Chart on Germany - Market size and forecast 2025-2030 ($ thousand)
Data Table on Germany - Market size and forecast 2025-2030 ($ thousand)
Chart on Germany - Year-over-year growth 2025-2030 (%)
Data Table on Germany - Year-over-year growth 2025-2030 (%)

12.5.2 UK - Market size and forecast 2025-2030

Chart on UK - Market size and forecast 2025-2030 ($ thousand)
Data Table on UK - Market size and forecast 2025-2030 ($ thousand)
Chart on UK - Year-over-year growth 2025-2030 (%)
Data Table on UK - Year-over-year growth 2025-2030 (%)

12.5.3 France - Market size and forecast 2025-2030

Chart on France - Market size and forecast 2025-2030 ($ thousand)
Data Table on France - Market size and forecast 2025-2030 ($ thousand)
Chart on France - Year-over-year growth 2025-2030 (%)
Data Table on France - Year-over-year growth 2025-2030 (%)

12.5.4 Italy - Market size and forecast 2025-2030

Chart on Italy - Market size and forecast 2025-2030 ($ thousand)
Data Table on Italy - Market size and forecast 2025-2030 ($ thousand)
Chart on Italy - Year-over-year growth 2025-2030 (%)
Data Table on Italy - Year-over-year growth 2025-2030 (%)

12.5.5 Spain - Market size and forecast 2025-2030

Chart on Spain - Market size and forecast 2025-2030 ($ thousand)
Data Table on Spain - Market size and forecast 2025-2030 ($ thousand)
Chart on Spain - Year-over-year growth 2025-2030 (%)
Data Table on Spain - Year-over-year growth 2025-2030 (%)

12.5.6 The Netherlands - Market size and forecast 2025-2030

Chart on The Netherlands - Market size and forecast 2025-2030 ($ thousand)
Data Table on The Netherlands - Market size and forecast 2025-2030 ($ thousand)
Chart on The Netherlands - Year-over-year growth 2025-2030 (%)
Data Table on The Netherlands - Year-over-year growth 2025-2030 (%)

12.6 South America - Market size and forecast 2025-2030

Chart on South America - Market size and forecast 2025-2030 ($ thousand)
Data Table on South America - Market size and forecast 2025-2030 ($ thousand)
Chart on South America - Year-over-year growth 2025-2030 (%)
Data Table on South America - Year-over-year growth 2025-2030 (%)
Chart on Regional Comparison - South America
Data Table on Regional Comparison - South America

12.6.1 Brazil - Market size and forecast 2025-2030

Chart on Brazil - Market size and forecast 2025-2030 ($ thousand)
Data Table on Brazil - Market size and forecast 2025-2030 ($ thousand)
Chart on Brazil - Year-over-year growth 2025-2030 (%)
Data Table on Brazil - Year-over-year growth 2025-2030 (%)

12.6.2 Argentina - Market size and forecast 2025-2030

Chart on Argentina - Market size and forecast 2025-2030 ($ thousand)
Data Table on Argentina - Market size and forecast 2025-2030 ($ thousand)
Chart on Argentina - Year-over-year growth 2025-2030 (%)
Data Table on Argentina - Year-over-year growth 2025-2030 (%)

12.6.3 Chile - Market size and forecast 2025-2030

Chart on Chile - Market size and forecast 2025-2030 ($ thousand)
Data Table on Chile - Market size and forecast 2025-2030 ($ thousand)
Chart on Chile - Year-over-year growth 2025-2030 (%)
Data Table on Chile - Year-over-year growth 2025-2030 (%)

12.7 Middle East and Africa - Market size and forecast 2025-2030

Chart on Middle East and Africa - Market size and forecast 2025-2030 ($ thousand)
Data Table on Middle East and Africa - Market size and forecast 2025-2030 ($ thousand)
Chart on Middle East and Africa - Year-over-year growth 2025-2030 (%)
Data Table on Middle East and Africa - Year-over-year growth 2025-2030 (%)
Chart on Regional Comparison - Middle East and Africa
Data Table on Regional Comparison - Middle East and Africa

12.7.1 Saudi Arabia - Market size and forecast 2025-2030

Chart on Saudi Arabia - Market size and forecast 2025-2030 ($ thousand)
Data Table on Saudi Arabia - Market size and forecast 2025-2030 ($ thousand)
Chart on Saudi Arabia - Year-over-year growth 2025-2030 (%)
Data Table on Saudi Arabia - Year-over-year growth 2025-2030 (%)

12.7.2 UAE - Market size and forecast 2025-2030

Chart on UAE - Market size and forecast 2025-2030 ($ thousand)
Data Table on UAE - Market size and forecast 2025-2030 ($ thousand)
Chart on UAE - Year-over-year growth 2025-2030 (%)
Data Table on UAE - Year-over-year growth 2025-2030 (%)

12.7.3 Israel - Market size and forecast 2025-2030

Chart on Israel - Market size and forecast 2025-2030 ($ thousand)
Data Table on Israel - Market size and forecast 2025-2030 ($ thousand)
Chart on Israel - Year-over-year growth 2025-2030 (%)
Data Table on Israel - Year-over-year growth 2025-2030 (%)

12.7.4 South Africa - Market size and forecast 2025-2030

Chart on South Africa - Market size and forecast 2025-2030 ($ thousand)
Data Table on South Africa - Market size and forecast 2025-2030 ($ thousand)
Chart on South Africa - Year-over-year growth 2025-2030 (%)
Data Table on South Africa - Year-over-year growth 2025-2030 (%)

12.7.5 Turkey - Market size and forecast 2025-2030

Chart on Turkey - Market size and forecast 2025-2030 ($ thousand)
Data Table on Turkey - Market size and forecast 2025-2030 ($ thousand)
Chart on Turkey - Year-over-year growth 2025-2030 (%)
Data Table on Turkey - Year-over-year growth 2025-2030 (%)

12.8 Market opportunity by geography

Market opportunity by geography ($ thousand)
Data Tables on Market opportunity by geography ($ thousand)

13. Drivers, Challenges, and Opportunity

13.1 Market drivers

Mitigation of company lock-in risks and enhancement of multi-cloud interoperability
Escalating enterprise adoption of custom model fine-tuning
Preservation of legacy infrastructure investments and hardware utilization optimization

13.2 Market challenges

Complex infrastructure management and multi-cloud interoperability bottlenecks
Data privacy compliance and regulatory governance divergence
Escalating capital expenditures and hardware procurement constraints

13.3 Impact of drivers and challenges

Impact of drivers and challenges in 2025 and 2030

13.4 Market opportunities

Rise of sovereign cloud infrastructures and localization of AI compute capacities
Proliferation of small language models and optimized edge hardware architectures
Adoption of FinOps and automated cost optimization across multicloud AI ecosystems

14. Competitive Landscape

14.1 Overview

14.2

Overview on criticality of inputs and factors of differentiation

14.3 Landscape disruption

Overview on factors of disruption

14.4 Industry risks

Impact of key risks on business

15. Competitive Analysis

15.1 Companies profiled

Companies covered

15.2 Company ranking index

15.3 Market positioning of companies

Matrix on companies position and classification

15.4 Amazon.com Inc.

Amazon.com Inc. - Overview
Amazon.com Inc. - Business segments
Amazon.com Inc. - Key news
Amazon.com Inc. - Key offerings
Amazon.com Inc. - Segment focus
SWOT

15.5 Cisco Systems Inc.

Cisco Systems Inc. - Overview
Cisco Systems Inc. - Business segments
Cisco Systems Inc. - Key news
Cisco Systems Inc. - Key offerings
Cisco Systems Inc. - Segment focus
SWOT

15.6 Dell Technologies Inc.

Dell Technologies Inc. - Overview
Dell Technologies Inc. - Business segments
Dell Technologies Inc. - Key news
Dell Technologies Inc. - Key offerings
Dell Technologies Inc. - Segment focus
SWOT

15.7 Google LLC

Google LLC - Overview
Google LLC - Product / Service
Google LLC - Key news
Google LLC - Key offerings
SWOT

15.8 Hewlett Packard Enterprise Co.

Hewlett Packard Enterprise Co. - Overview
Hewlett Packard Enterprise Co. - Business segments
Hewlett Packard Enterprise Co. - Key news
Hewlett Packard Enterprise Co. - Key offerings
Hewlett Packard Enterprise Co. - Segment focus
SWOT

15.9 IBM Corp.

IBM Corp. - Overview
IBM Corp. - Business segments
IBM Corp. - Key news
IBM Corp. - Key offerings
IBM Corp. - Segment focus
SWOT

15.10 Intel Corp.

Intel Corp. - Overview
Intel Corp. - Business segments
Intel Corp. - Key news
Intel Corp. - Key offerings
Intel Corp. - Segment focus
SWOT

15.11 Lenovo Group Ltd.

Lenovo Group Ltd. - Overview
Lenovo Group Ltd. - Business segments
Lenovo Group Ltd. - Key news
Lenovo Group Ltd. - Key offerings
Lenovo Group Ltd. - Segment focus
SWOT

15.12 Microsoft Corp.

Microsoft Corp. - Overview
Microsoft Corp. - Business segments
Microsoft Corp. - Key news
Microsoft Corp. - Key offerings
Microsoft Corp. - Segment focus
SWOT

15.13 NetApp Inc.

NetApp Inc. - Overview
NetApp Inc. - Business segments
NetApp Inc. - Key news
NetApp Inc. - Key offerings
NetApp Inc. - Segment focus
SWOT

15.14 NVIDIA Corp.

NVIDIA Corp. - Overview
NVIDIA Corp. - Business segments
NVIDIA Corp. - Key news
NVIDIA Corp. - Key offerings
NVIDIA Corp. - Segment focus
SWOT

15.15 Oracle Corp.

Oracle Corp. - Overview
Oracle Corp. - Business segments
Oracle Corp. - Key news
Oracle Corp. - Key offerings
Oracle Corp. - Segment focus
SWOT

15.16 Pure Storage Inc.

Pure Storage Inc. - Overview
Pure Storage Inc. - Business segments
Pure Storage Inc. - Key offerings
Pure Storage Inc. - Segment focus
SWOT

15.17 Qualcomm Inc.

Qualcomm Inc. - Overview
Qualcomm Inc. - Business segments
Qualcomm Inc. - Key news
Qualcomm Inc. - Key offerings
Qualcomm Inc. - Segment focus
SWOT

15.18 Super Micro Computer Inc.

Super Micro Computer Inc. - Overview
Super Micro Computer Inc. - Business segments
Super Micro Computer Inc. - Key offerings
Super Micro Computer Inc. - Segment focus
SWOT

16. Appendix

16.1 Scope of the report

Market definition
Objectives
Notes and caveats

16.2 Inclusions and exclusions checklist

Inclusions checklist
Exclusions checklist

16.3 Currency conversion rates for US$

16.4 Research methodology

16.5 Data procurement

Information sources

16.6 Data validation

16.7 Validation techniques employed for market sizing

16.8 Data synthesis

16.9 360 degree market analysis

16.10 List of abbreviations

Research Methodology

Technavio presents a detailed picture of the market by way of study, synthesis, and summation of data from multiple sources. The analysts have presented the various facets of the market with a particular focus on identifying the key industry influencers. The data thus presented is comprehensive, reliable, and the result of extensive research, both primary and secondary.

INFORMATION SOURCES

Primary sources

  • Manufacturers and suppliers
  • Channel partners
  • Industry experts
  • Strategic decision makers

Secondary sources

  • Industry journals and periodicals
  • Government data
  • Financial reports of key industry players
  • Historical data
  • Press releases

DATA ANALYSIS

Data Synthesis

  • Collation of data
  • Estimation of key figures
  • Analysis of derived insights

Data Validation

  • Triangulation with data models
  • Reference against proprietary databases
  • Corroboration with industry experts

REPORT WRITING

Qualitative

  • Market drivers
  • Market challenges
  • Market trends
  • Five forces analysis

Quantitative

  • Market size and forecast
  • Market segmentation
  • Geographical insights
  • Competitive landscape

Interested in this report?

Get your sample now to see our research methodology and insights!

Download Now

Frequently Asked Questions

Hybrid Ai Deployment market growth will increase by USD 38992149.3 thousand thousand during 2026-2030.

The Hybrid Ai Deployment market is expected to grow at a CAGR of 31.7% during 2026-2030.

Hybrid Ai Deployment market is segmented by Component (Hardware, Software, Services) Application (Machine learning, Generative AI, Natural language processing, Others) End-user (IT and telecom, BFSI, Healthcare, Government and defense, Others)

Amazon.com Inc., Anyscale Inc., Canonical Ltd., Cisco Systems Inc., Cloudera Inc., Databricks Inc., Dell Technologies Inc., Google LLC, Hewlett Packard Enterprise Co., IBM Corp., Intel Corp., Lenovo Group Ltd., Microsoft Corp., NetApp Inc., Nutanix Inc., NVIDIA Corp., Oracle Corp., Pure Storage Inc., Qualcomm Inc., Red Hat Inc., SAS Institute Inc., Super Micro Computer Inc. are a few of the key vendors in the Hybrid Ai Deployment market.

North America will register the highest growth rate of 38.7% among the other regions. Therefore, the Hybrid Ai Deployment market in North America is expected to garner significant business opportunities for the vendors during the forecast period.

US, Canada, Mexico, China, Japan, India, South Korea, Australia, Indonesia, Germany, UK, France, Italy, Spain, The Netherlands, Brazil, Argentina, Chile, Saudi Arabia, UAE, Israel, South Africa, Turkey

  • Mitigation of company lock-in risks and enhancement of multi-cloud interoperability is the driving factor this market.

The Hybrid Ai Deployment market vendors should focus on grabbing business opportunities from the Component segment as it accounted for the largest market share in the base year.
RIA - Research AI Assistant
Ask RIA