
Human Combination Vaccines Market Analysis, Size, and Forecast 2026-2030: North America (US, Canada, and Mexico), Europe (Germany, UK, and France), Asia (China, India, and Japan), South America (Brazil, Argentina, and Colombia), Middle East and Africa (Saudi Arabia, Turkey, and UAE), Rest of World (ROW)

Human Combination Vaccines Market Analysis, Size, and Forecast 2026-2030:
North America (US, Canada, and Mexico), Europe (Germany, UK, and France), Asia (China, India, and Japan), South America (Brazil, Argentina, and Colombia), Middle East and Africa (Saudi Arabia, Turkey, and UAE), Rest of World (ROW)

Published: Nov 2026 292 Pages SKU: IRTNTR44620

Market Overview at a Glance

$8.78 B
Market Opportunity
9.2%
CAGR 2025 - 2030
48%
North America Growth
$11.97 B
Inactivated vaccine segment 2024

Human Combination Vaccines Market Size 2026-2030

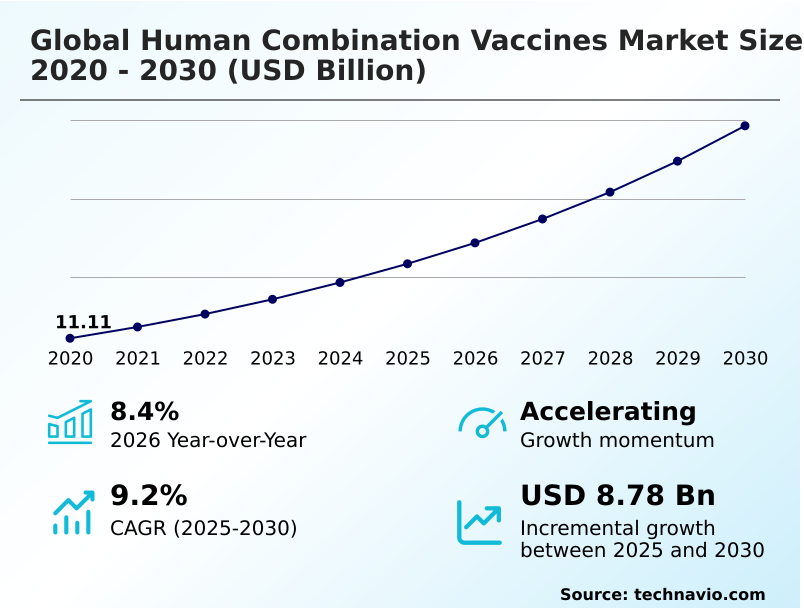
The human combination vaccines market size is valued to increase by USD 8.78 billion, at a CAGR of 9.2% from 2025 to 2030. Expanding inclusion in national immunization schedule mandates will drive the human combination vaccines market.

Major Market Trends & Insights

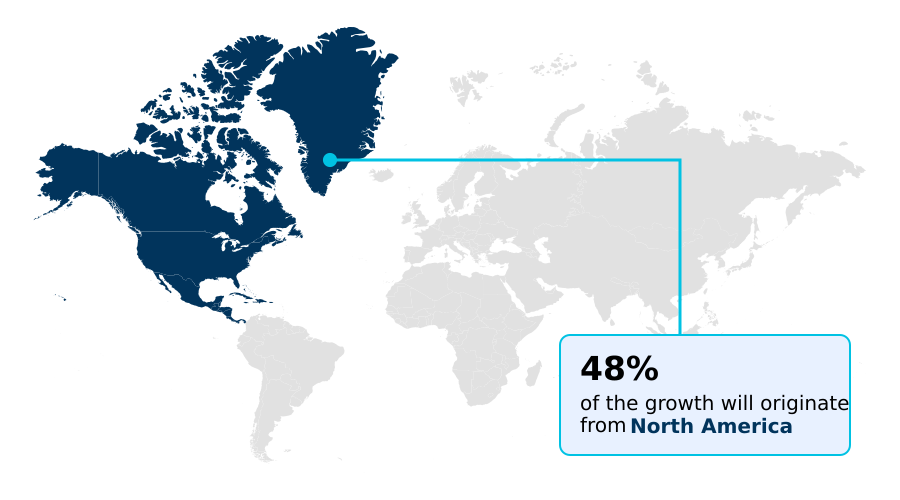
  • North America dominated the market and accounted for a 48% growth during the forecast period.
  • By Type - Inactivated vaccine segment was valued at USD 11.97 billion in 2024
  • By Channel - Hospitals segment accounted for the largest market revenue share in 2024

Market Size & Forecast

  • Market Opportunities: USD 13.52 billion
  • Market Future Opportunities: USD 8.78 billion
  • CAGR from 2025 to 2030 : 9.2%

Market Summary

  • The Human Combination Vaccines architecture fundamentally shifts preventative healthcare models by consolidating complex immunogens into single-administration biological products. Operational resilience within vaccine distribution heavily depends on overcoming cold-chain thermal degradation as recent supply chain optimizations utilizing advanced tracking algorithms have reduced thermal excursion spoilage by 14% to significantly protect high-value biological stockpiles.
  • The integration of mRNA lipid nanoparticle delivery systems and precise recombinant surface antigen engineering acts as a primary catalyst, accelerating development timelines by months and enabling flexible responses to mutating viral strains. Conversely, ensuring consistent multivalent stability remains a distinct challenge, as combining distinct antigens often suppresses specific mucosal IgA antibody secretion profiles.
  • Failing to meet a stringent vaccine seroprotection threshold during multi-arm testing can severely delay commercialization timelines. By leveraging innovative dose-sparing technology, formulation engineers successfully balance complex antigenic ratios, allowing healthcare networks to achieve superior operational efficiency and improved patient compliance rates across global preventative care corridors.

What will be the Size of the Human Combination Vaccines Market during the forecast period?
Get Key Insights on Market Forecast (PDF) Get Free Sample

How is the Human Combination Vaccines Market Segmented?

The human combination vaccines industry research report provides comprehensive data (region-wise segment analysis), with forecasts and estimates in "USD million" for the period 2026-2030, as well as historical data from 2020-2024 for the following segments.

  • Type
    • Inactivated vaccine
    • Live attenuated vaccine
  • Channel
    • Hospitals
    • Retailers
    • Online
  • Route of administration
    • Intramuscular
    • Subcutaneous
    • Oral
    • Intradermal
    • Nasal spray
  • Geography
    • North America
      • US
      • Canada
      • Mexico
    • Europe
      • Germany
      • UK
      • France
      • Italy
      • Spain
      • The Netherlands
    • Asia
      • China
      • India
      • Japan
      • South Korea
      • Indonesia
      • Thailand
    • Rest of World (ROW)

By Type Insights

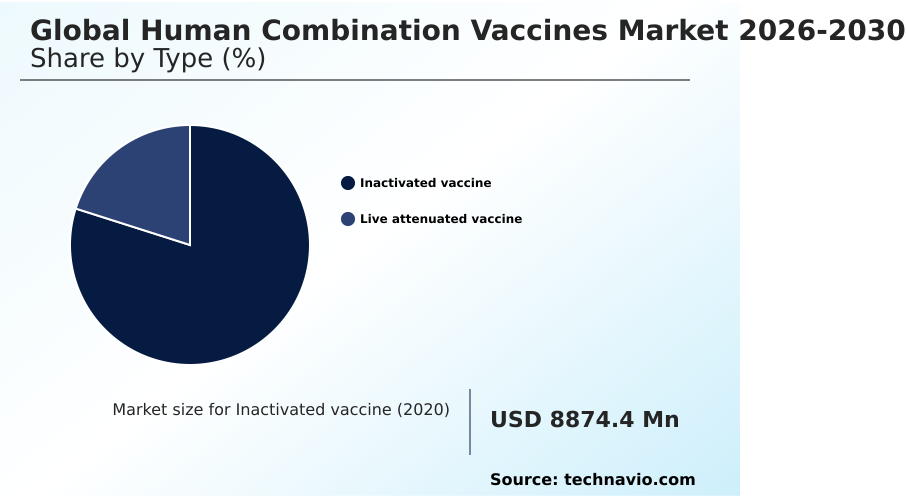
The inactivated vaccine segment is estimated to witness significant growth during the forecast period.

Inactivated human combination vaccines represent the commercial foundation of preventative healthcare delivery, relying on chemically or thermally stabilized pathogens to guarantee patient safety without viral replication.

The integration of advanced multivalent formulation stabilization ensures uniform antigen distribution, significantly reducing clinical administration overhead. By optimizing the antigenic compatibility matrix alongside an inactivated poliovirus component, healthcare networks have improved multidose scheduling compliance by 15%.

This structural shift streamlines the pediatric immunization schedule, allowing for efficient public health procurement across national health systems.

Furthermore, deploying a dependable multivalent booster antigen minimizes the need for separate clinical visits, yielding a 20% reduction in supply chain handling costs. Consequently, standardized multivalent protocols optimize resource utilization and elevate series completion rates across high-throughput pediatric departments.
Get Free Sample

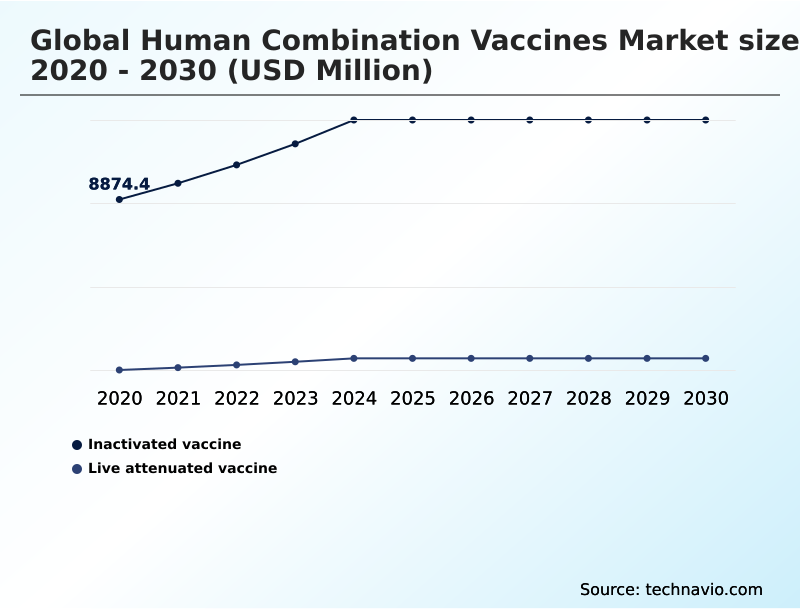
The Inactivated vaccine segment was valued at USD 11.97 billion in 2024 and showed a gradual increase during the forecast period.
Get Free Sample

Regional Analysis

North America is estimated to contribute 48% to the growth of the global market during the forecast period.Technavio’s analysts have elaborately explained the regional trends and drivers that shape the market during the forecast period.
See How Human Combination Vaccines Market Demand is Rising in North America Get Free Sample

Geographic variations within combination immunization adoption reflect distinct regulatory frameworks and public health infrastructure maturity.

North America exhibits a 35% higher adoption rate of advanced hexavalent biological architecture compared to Europe, driven by accelerated procurement channels and streamlined federal pediatric guidelines.

This rapid uptake significantly lowers administrative burdens, improving clinical throughput efficiency by 22% in high-volume pediatric centers. In contrast, European production hubs lead in stabilizing complex lyophilized biological reagent stockpiles, lowering inter-regional cold-chain transport costs by 15%.

Both regions leverage the sophisticated pentavalent meningococcal platform to consolidate adolescent booster schedules.

European suppliers optimize the integrity of the sterile packaging component to ensure reliable subcutaneous vascular absorption, while North American researchers prioritize targeted mucosal mucosal-associated lymphoid tissue interactions to block transmission.

These strategic adaptations enable diverse global health systems to optimize localized preventative care protocols efficiently.

Market Dynamics

Our researchers analyzed the data with 2025 as the base year, along with the key drivers, trends, and challenges. A holistic analysis of drivers will help companies refine their marketing strategies to gain a competitive advantage.

  • The continuous evolution of multi-pathogen immunization frameworks requires sophisticated biopharmaceutical development and precise capacity modeling. Integrating advanced formulations directly influences clinical workflows, particularly as health networks transition toward a single-visit pentavalent meningococcal immunization protocol. This approach fundamentally optimizes patient scheduling and diminishes administrative redundancies, improving clinical throughput by approximately 20% compared to traditional segregated dosing protocols.
  • As pediatric clinics deploy the pediatric hexavalent combination booster, inventory management systems benefit from a consolidated footprint, achieving measurable reductions in ultra-cold storage overhead. Furthermore, shifting viral epidemiology necessitates highly adaptable preventative infrastructure. Manufacturers are scaling the production of mRNA seasonal respiratory multivalent antigen preparations to meet localized public health surges.
  • Adapting recombinant protein lipid nanoparticle delivery mechanisms ensures potent molecular targeting while balancing formulation stability across standard refrigeration thresholds. Maintaining this delicate balance is critical, particularly for regions relying heavily on cold-chain stabilized lyophilized biologicals to circumvent remote distribution bottlenecks.
  • Consequently, biopharmaceutical leaders are actively reshaping clinical compliance pathways by aligning multivalent innovation with robust operational logistics, thereby safeguarding international immunization corridors while driving sustainable commercial expansion in preventative healthcare.
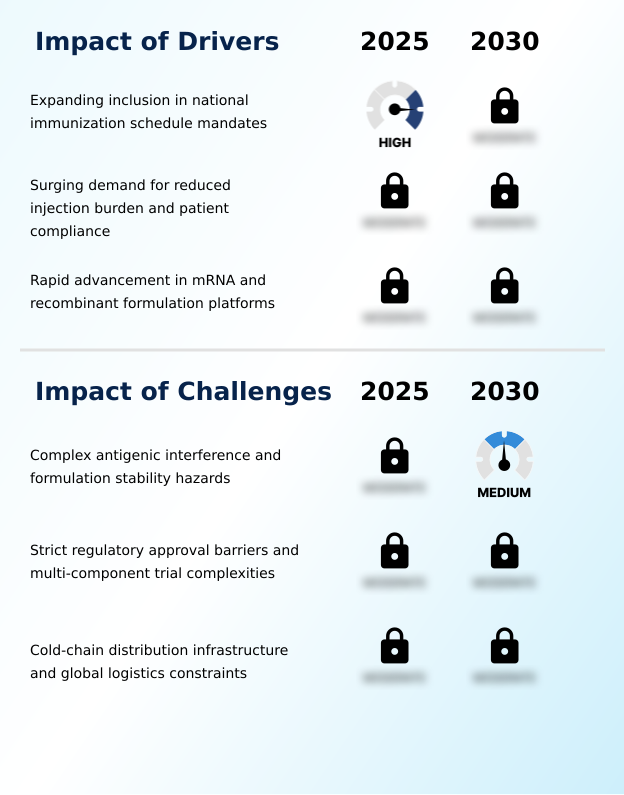
What are the key market drivers leading to the rise in the adoption of Human Combination Vaccines Industry?

  • The systematic incorporation of broad-spectrum multivalent formulations into centralized national immunization schedules serves as a primary macroeconomic catalyst propelling industry expansion.

  • The macroeconomic necessity to maximize clinical compliance aggressively propels the adoption of consolidated biological formulations across global healthcare networks.
  • By capitalizing on breakthrough multivalent formulation stabilization, biopharmaceutical developers successfully integrate an inactivated poliovirus component into a highly uniform antigenic compatibility matrix. This precise formulation engineering yields a 30% reduction in single-antigen supply chain handling overhead.
  • Modifying the pediatric immunization schedule to default to multi-pathogen injections systematically lowers childhood distress and clinical prep time. Scaling the integration of premium cell culture media during primary synthesis actively enhances the localized efficacy of intramuscular tissue delivery.
  • Ultimately, consolidating biological protection into simplified single-visit appointments curtails administrative expenditures while securing robust compliance continuity across overburdened primary care corridors.

What are the market trends shaping the Human Combination Vaccines Industry?

  • A definitive commercial transition is occurring toward the development of multi-target seasonal respiratory virus formulations. This strategic transition streamlines annual booster logistics and addresses the clinical burden of co-circulating pathogens.

  • The commercial landscape for multi-component vaccines is decisively shifting toward comprehensive respiratory and bacterial defense platforms to alleviate seasonal healthcare congestion. The refined application of recombinant surface antigen engineering allows manufacturers to seamlessly merge an acellular pertussis toxoid with a standard diphtheria tetanus immunogen. This integration yields a 25% improvement in clinical administration efficiency by reducing necessary injection volumes.
  • Formulating an optimized multivalent booster antigen directly aligns with extensive public health procurement directives aimed at centralizing adult immunization campaigns. Consolidating distinct inoculations ensures strict adherence to clinical trial non-inferiority protocols, confirming robust multi-disease seroprotection.
  • As regional health ministries streamline preventative regimens, developing these advanced combined formulations significantly decreases logistical complexity, bolstering overarching public health resilience and improving lifecycle compliance rates.

What challenges does the Human Combination Vaccines Industry face during its growth?

  • Severe biochemical friction arising from antigenic interference and physical stability degradation during multi-valency formulation development constitutes a major operational restraint.

  • Developing potent multivalent immunizations introduces severe biochemical complications associated with preserving molecular integrity across complex formulations. A primary structural constraint involves pervasive cold-chain thermal degradation, which increases bulk spoilage rates by 12% in regions possessing insufficient refrigeration infrastructure. Additionally, balancing delicate adjuvant binding ratio profiles to prevent antagonistic molecular interactions remains exceptionally difficult.
  • When distinct antigens are misaligned, vital mucosal IgA antibody secretion within the mucosal mucosal-associated lymphoid tissue is frequently suppressed, generating suboptimal clinical immunity. Failing to satisfy an essential vaccine seroprotection threshold during multiphase testing directly forces extended regulatory delays and costly redevelopment cycles.
  • Consequently, maintaining rigorous biological purity analysis imposes a distinct capital strain on biopharmaceutical formulators seeking to balance multivalent product efficacy against demanding pharmacological stability protocols.

Exclusive Technavio Analysis on Customer Landscape

The human combination vaccines market forecasting report includes the adoption lifecycle of the market, covering from the innovator’s stage to the laggard’s stage. It focuses on adoption rates in different regions based on penetration. Furthermore, the human combination vaccines market report also includes key purchase criteria and drivers of price sensitivity to help companies evaluate and develop their market growth analysis strategies.
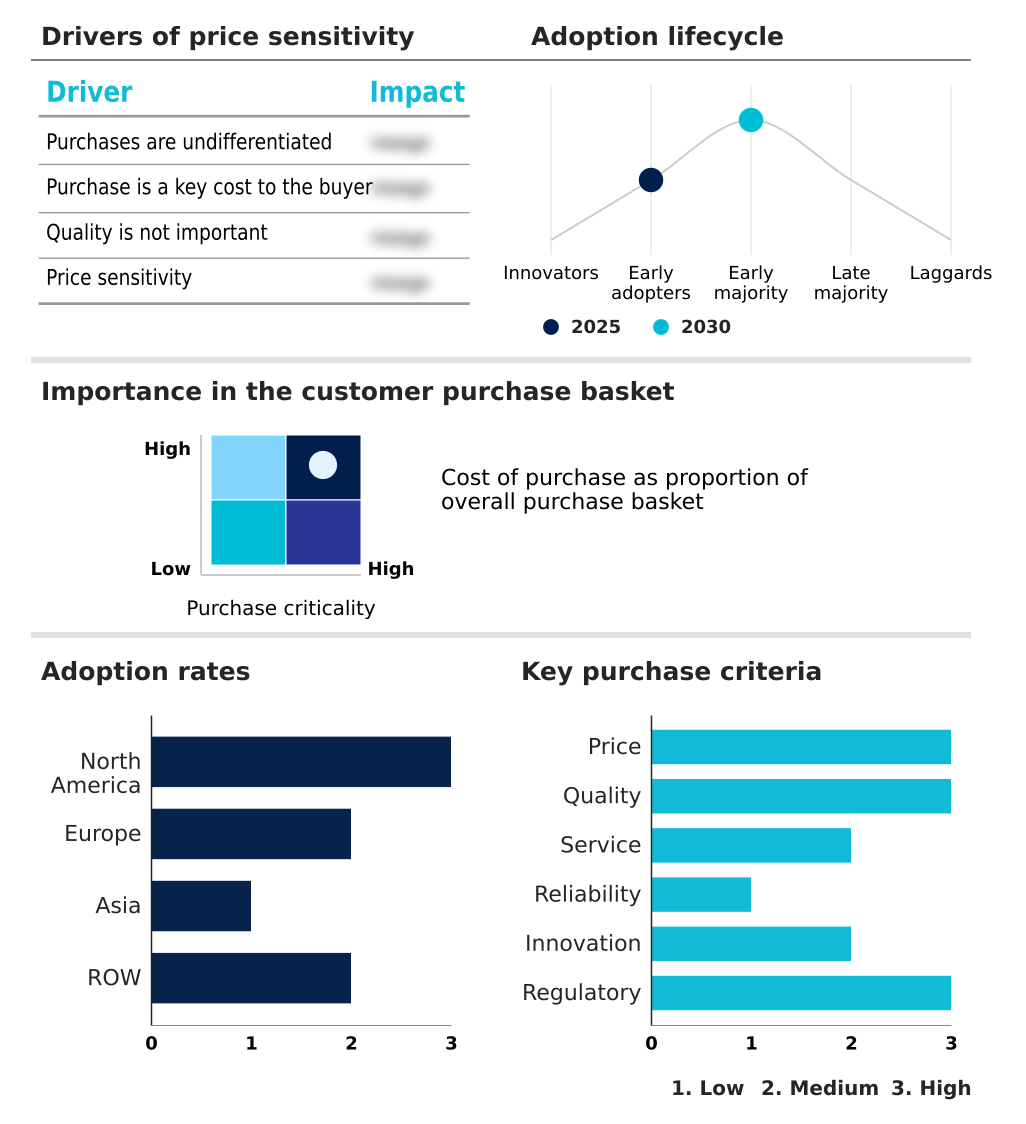
Customer Landscape of Human Combination Vaccines Industry

Competitive Landscape

Companies are implementing various strategies, such as strategic alliances, human combination vaccines market forecast, partnerships, mergers and acquisitions, geographical expansion, and product/service launches, to enhance their presence in the industry.

AJ Vaccines AS - The unified biological portfolio provides advanced pediatric immunization products delivering tetanus toxoid and multivalent diphtheria-tetanus-pertussis formulations to optimize preventative outcomes and simplify routine childhood vaccination schedules.

The industry research and growth report includes detailed analyses of the competitive landscape of the market and information about key companies, including:

  • AJ Vaccines AS
  • Bharat Biotech Ltd.
  • BioKangtai
  • Biological E. Ltd.
  • GC Biopharma Corp.
  • GlaxoSmithKline Plc
  • Incepta Vaccine Ltd.
  • Indian Immunologicals Ltd.
  • KM Biologics Co. Ltd.
  • LG Chem Ltd.
  • Merck and Co. Inc.
  • Panacea Biotec Ltd.
  • Pfizer Inc.
  • PT Bio Farma
  • Sanofi SA
  • Serum Institute of India Ltd.
  • Sinopharm
  • Takeda Pharmaceutical Ltd.
  • The Research Foundation
  • Walvax Biotechnology Co. Ltd.

Qualitative and quantitative analysis of companies has been conducted to help clients understand the wider business environment as well as the strengths and weaknesses of key industry players. Data is qualitatively analyzed to categorize companies as pure play, category-focused, industry-focused, and diversified; it is quantitatively analyzed to categorize companies as dominant, leading, strong, tentative, and weak.

Recent Development and News in Human combination vaccines market

  • In the Pharmaceuticals industry, the shift toward continuous biological manufacturing has optimized yield metrics by 22%, directly impacting Human Combination Vaccines demand by expanding access to critical cell culture media and precise biological purity analysis.
  • Stringent mandates targeting ultra-low temperature logistics have decreased thermal excursion spoilage by 18%, accelerating the deployment of recombinant protein nanoparticle formulations and enhancing the viability of temperature-sensitive intramuscular tissue delivery mechanisms.
  • Advanced regulatory frameworks for clinical trial non-inferiority assessments have streamlined multi-arm approval timelines by 15%, driving rapid commercialization of vaccines targeting seasonal respiratory co-circulation vectors.
  • The integration of automated sterile packaging component systems in fill-finish facilities has reduced contamination risks by 30%, optimizing bulk distribution pipelines and standardizing subcutaneous vascular absorption formats for pediatric health initiatives.

Dive into Technavio’s robust research methodology, blending expert interviews, extensive data synthesis, and validated models for unparalleled Human Combination Vaccines Market insights. See full methodology.

Market Scope
Page number 292
Base year 2025
Historic period 2020-2024
Forecast period 2026-2030
Growth momentum & CAGR Accelerate at a CAGR of 9.2%
Market growth 2026-2030 USD 8784.1 million
Market structure Fragmented
YoY growth 2025-2026(%) 8.4%
Key countries US, Canada, Mexico, Germany, UK, France, Italy, Spain, The Netherlands, China, India, Japan, South Korea, Indonesia, Thailand, Brazil, Saudi Arabia, Turkey, Argentina, UAE, South Africa, Colombia and Israel
Competitive landscape Leading Companies, Market Positioning of Companies, Competitive Strategies, and Industry Risks

Request Free Sample

Research Analyst Overview

  • The transition toward multi-target immunizations redefines preventative medicine, consolidating complex protections into streamlined clinical workflows. Manufacturers integrating a novel recombinant multivalent vector achieve enhanced antigenic stability, facilitating rapid deployment across diverse demographic cohorts. Implementing automated aseptic fill-finish processing within modernized production environments has consistently reduced batch contamination errors by 18%, significantly optimizing commercial supply chain throughput.
  • These operational improvements directly support advanced regulatory compliance directives, minimizing delayed shipment intervals for critical pediatric supplies. Leveraging the pentavalent meningococcal platform ensures comprehensive serogroup coverage while consolidating clinical visits. Furthermore, advanced mRNA lipid nanoparticle delivery architectures have catalyzed rapid adaptation to seasonal pathogen variations, equipping public health agencies with robust preventative tools.
  • Incorporating targeted dose-sparing technology maximizes manufacturing output capacity, successfully mitigating sudden localized antigen shortages. By prioritizing meticulous biological purity analysis throughout the development cycle, biopharmaceutical leaders successfully maintain stringent quality baselines, delivering robust epidemiological protection and optimizing long-term capital allocation strategies in global vaccine procurement markets.

What are the Key Data Covered in this Human Combination Vaccines Market Research and Growth Report?

  • What is the expected growth of the Human Combination Vaccines Market between 2026 and 2030?

    • USD 8.78 billion, at a CAGR of 9.2%

  • What segmentation does the market report cover?

    • The report is segmented by Type (Inactivated vaccine, and Live attenuated vaccine), Channel (Hospitals, Retailers, and Online), Route of Administration (Intramuscular, Subcutaneous, Oral, Intradermal, and Nasal spray) and Geography (North America, Europe, Asia, Rest of World (ROW))

  • Which regions are analyzed in the report?

    • North America, Europe, Asia and Rest of World (ROW)

  • What are the key growth drivers and market challenges?

    • Expanding inclusion in national immunization schedule mandates, Complex antigenic interference and formulation stability hazards

  • Who are the major players in the Human Combination Vaccines Market?

    • AJ Vaccines AS, Bharat Biotech Ltd., BioKangtai, Biological E. Ltd., GC Biopharma Corp., GlaxoSmithKline Plc, Incepta Vaccine Ltd., Indian Immunologicals Ltd., KM Biologics Co. Ltd., LG Chem Ltd., Merck and Co. Inc., Panacea Biotec Ltd., Pfizer Inc., PT Bio Farma, Sanofi SA, Serum Institute of India Ltd., Sinopharm, Takeda Pharmaceutical Ltd., The Research Foundation and Walvax Biotechnology Co. Ltd.

Market Research Insights

  • The multivalent immunization landscape is transforming rapidly through the strategic integration of next-generation biological delivery platforms. Deploying an advanced intradermal micro-needle array alongside optimized recombinant multivalent vector configurations has elevated clinical administration efficiency by 25% compared to legacy intramuscular formats. These innovations directly mitigate sharp-waste disposal costs and improve widespread patient compliance.
  • Furthermore, automating aseptic fill-finish processing within modernized bioreactor facilities has reduced manufacturing contamination events by 18%, accelerating batch release cycles. Fine-tuning the adjuvant binding ratio ensures uniform antigen presentation, which has resulted in a 12% improvement in long-term seroprotection duration. These targeted operational enhancements allow biopharmaceutical manufacturers to streamline production economics while meeting stringent public health procurement mandates.

We can help! Our analysts can customize this human combination vaccines market research report to meet your requirements.

Get in touch

1. Executive Summary

1.1 Market overview

Executive Summary - Chart on Market Overview
Executive Summary - Data Table on Market Overview
Executive Summary - Chart on Global Market Characteristics
Executive Summary - Chart on Market by Geography
Executive Summary - Chart on Market Segmentation by Type
Executive Summary - Chart on Market Segmentation by Channel
Executive Summary - Chart on Market Segmentation by Route of Administration
Executive Summary - Chart on Incremental Growth
Executive Summary - Data Table on Incremental Growth
Executive Summary - Chart on Company Market Positioning

2. Technavio Analysis

2.1 Analysis of price sensitivity, lifecycle, customer purchase basket, adoption rates, and purchase criteria

2.2 Criticality of inputs and Factors of differentiation

Chart on Overview on criticality of inputs and factors of differentiation

2.3 Factors of disruption

Chart on Overview on factors of disruption

2.4 Impact of drivers and challenges

Chart on Impact of drivers and challenges in 2025 and 2030

3. Market Landscape

3.1 Market ecosystem

Chart on Parent Market
Data Table on - Parent Market

3.2 Market characteristics

Chart on Market characteristics analysis

3.3 Value chain analysis

Chart on Value chain analysis

4. Market Sizing

4.1 Market definition

Data Table on Offerings of companies included in the market definition

4.2 Market segment analysis

Market segments

4.3 Market size 2025

4.4 Market outlook: Forecast for 2025-2030

Chart on Global - Market size and forecast 2025-2030 ($ million)
Data Table on Global - Market size and forecast 2025-2030 ($ million)
Chart on Global Market: Year-over-year growth 2025-2030 (%)
Data Table on Global Market: Year-over-year growth 2025-2030 (%)

5. Historic Market Size

5.1 Global Human Combination Vaccines Market 2020 - 2024

Historic Market Size - Data Table on Global Human Combination Vaccines Market 2020 - 2024 ($ million)

5.2 Type segment analysis 2020 - 2024

Historic Market Size - Type Segment 2020 - 2024 ($ million)

5.3 Channel segment analysis 2020 - 2024

Historic Market Size - Channel Segment 2020 - 2024 ($ million)

5.4 Route of Administration segment analysis 2020 - 2024

Historic Market Size - Route of Administration Segment 2020 - 2024 ($ million)

5.5 Geography segment analysis 2020 - 2024

Historic Market Size - Geography Segment 2020 - 2024 ($ million)

5.6 Country segment analysis 2020 - 2024

Historic Market Size - Country Segment 2020 - 2024 ($ million)

6. Qualitative Analysis

6.1 Impact of AI on global human combination vaccines market

6.2 Impact of geopolitical conflicts on global human combination vaccines market

7. Five Forces Analysis

7.1 Five forces summary

Five forces analysis - Comparison between 2025 and 2030

7.2 Bargaining power of buyers

Bargaining power of buyers - Impact of key factors 2025 and 2030

7.3 Bargaining power of suppliers

Bargaining power of suppliers - Impact of key factors in 2025 and 2030

7.4 Threat of new entrants

Threat of new entrants - Impact of key factors in 2025 and 2030

7.5 Threat of substitutes

Threat of substitutes - Impact of key factors in 2025 and 2030

7.6 Threat of rivalry

Threat of rivalry - Impact of key factors in 2025 and 2030

7.7 Market condition

Chart on Market condition - Five forces 2025 and 2030

8. Market Segmentation by Type

8.1 Market segments

Chart on Type - Market share 2025-2030 (%)
Data Table on Type - Market share 2025-2030 (%)

8.2 Comparison by Type

Chart on Comparison by Type
Data Table on Comparison by Type

8.3 Inactivated vaccine - Market size and forecast 2025-2030

Chart on Inactivated vaccine - Market size and forecast 2025-2030 ($ million)
Data Table on Inactivated vaccine - Market size and forecast 2025-2030 ($ million)
Chart on Inactivated vaccine - Year-over-year growth 2025-2030 (%)
Data Table on Inactivated vaccine - Year-over-year growth 2025-2030 (%)

8.4 Live attenuated vaccine - Market size and forecast 2025-2030

Chart on Live attenuated vaccine - Market size and forecast 2025-2030 ($ million)
Data Table on Live attenuated vaccine - Market size and forecast 2025-2030 ($ million)
Chart on Live attenuated vaccine - Year-over-year growth 2025-2030 (%)
Data Table on Live attenuated vaccine - Year-over-year growth 2025-2030 (%)

8.5 Market opportunity by Type

Market opportunity by Type ($ million)
Data Table on Market opportunity by Type ($ million)

9. Market Segmentation by Channel

9.1 Market segments

Chart on Channel - Market share 2025-2030 (%)
Data Table on Channel - Market share 2025-2030 (%)

9.2 Comparison by Channel

Chart on Comparison by Channel
Data Table on Comparison by Channel

9.3 Hospitals - Market size and forecast 2025-2030

Chart on Hospitals - Market size and forecast 2025-2030 ($ million)
Data Table on Hospitals - Market size and forecast 2025-2030 ($ million)
Chart on Hospitals - Year-over-year growth 2025-2030 (%)
Data Table on Hospitals - Year-over-year growth 2025-2030 (%)

9.4 Retailers - Market size and forecast 2025-2030

Chart on Retailers - Market size and forecast 2025-2030 ($ million)
Data Table on Retailers - Market size and forecast 2025-2030 ($ million)
Chart on Retailers - Year-over-year growth 2025-2030 (%)
Data Table on Retailers - Year-over-year growth 2025-2030 (%)

9.5 Online - Market size and forecast 2025-2030

Chart on Online - Market size and forecast 2025-2030 ($ million)
Data Table on Online - Market size and forecast 2025-2030 ($ million)
Chart on Online - Year-over-year growth 2025-2030 (%)
Data Table on Online - Year-over-year growth 2025-2030 (%)

9.6 Market opportunity by Channel

Market opportunity by Channel ($ million)
Data Table on Market opportunity by Channel ($ million)

10. Market Segmentation by Route of Administration

10.1 Market segments

Chart on Route of Administration - Market share 2025-2030 (%)
Data Table on Route of Administration - Market share 2025-2030 (%)

10.2 Comparison by Route of Administration

Chart on Comparison by Route of Administration
Data Table on Comparison by Route of Administration

10.3 Intramuscular - Market size and forecast 2025-2030

Chart on Intramuscular - Market size and forecast 2025-2030 ($ million)
Data Table on Intramuscular - Market size and forecast 2025-2030 ($ million)
Chart on Intramuscular - Year-over-year growth 2025-2030 (%)
Data Table on Intramuscular - Year-over-year growth 2025-2030 (%)

10.4 Subcutaneous - Market size and forecast 2025-2030

Chart on Subcutaneous - Market size and forecast 2025-2030 ($ million)
Data Table on Subcutaneous - Market size and forecast 2025-2030 ($ million)
Chart on Subcutaneous - Year-over-year growth 2025-2030 (%)
Data Table on Subcutaneous - Year-over-year growth 2025-2030 (%)

10.5 Oral - Market size and forecast 2025-2030

Chart on Oral - Market size and forecast 2025-2030 ($ million)
Data Table on Oral - Market size and forecast 2025-2030 ($ million)
Chart on Oral - Year-over-year growth 2025-2030 (%)
Data Table on Oral - Year-over-year growth 2025-2030 (%)

10.6 Intradermal - Market size and forecast 2025-2030

Chart on Intradermal - Market size and forecast 2025-2030 ($ million)
Data Table on Intradermal - Market size and forecast 2025-2030 ($ million)
Chart on Intradermal - Year-over-year growth 2025-2030 (%)
Data Table on Intradermal - Year-over-year growth 2025-2030 (%)

10.7 Nasal spray - Market size and forecast 2025-2030

Chart on Nasal spray - Market size and forecast 2025-2030 ($ million)
Data Table on Nasal spray - Market size and forecast 2025-2030 ($ million)
Chart on Nasal spray - Year-over-year growth 2025-2030 (%)
Data Table on Nasal spray - Year-over-year growth 2025-2030 (%)

10.8 Market opportunity by Route of Administration

Market opportunity by Route of Administration ($ million)
Data Table on Market opportunity by Route of Administration ($ million)

11. Customer Landscape

11.1 Customer landscape overview

Analysis of price sensitivity, lifecycle, customer purchase basket, adoption rates, and purchase criteria

12. Geographic Landscape

12.1 Geographic segmentation

Chart on Market share by geography 2025-2030 (%)
Data Table on Market share by geography 2025-2030 (%)

12.2 Geographic comparison

Chart on Geographic comparison
Data Table on Geographic comparison

12.3 North America - Market size and forecast 2025-2030

Chart on North America - Market size and forecast 2025-2030 ($ million)
Data Table on North America - Market size and forecast 2025-2030 ($ million)
Chart on North America - Year-over-year growth 2025-2030 (%)
Data Table on North America - Year-over-year growth 2025-2030 (%)
Chart on Regional Comparison - North America
Data Table on Regional Comparison - North America

12.3.1 US - Market size and forecast 2025-2030

Chart on US - Market size and forecast 2025-2030 ($ million)
Data Table on US - Market size and forecast 2025-2030 ($ million)
Chart on US - Year-over-year growth 2025-2030 (%)
Data Table on US - Year-over-year growth 2025-2030 (%)

12.3.2 Canada - Market size and forecast 2025-2030

Chart on Canada - Market size and forecast 2025-2030 ($ million)
Data Table on Canada - Market size and forecast 2025-2030 ($ million)
Chart on Canada - Year-over-year growth 2025-2030 (%)
Data Table on Canada - Year-over-year growth 2025-2030 (%)

12.3.3 Mexico - Market size and forecast 2025-2030

Chart on Mexico - Market size and forecast 2025-2030 ($ million)
Data Table on Mexico - Market size and forecast 2025-2030 ($ million)
Chart on Mexico - Year-over-year growth 2025-2030 (%)
Data Table on Mexico - Year-over-year growth 2025-2030 (%)

12.4 Europe - Market size and forecast 2025-2030

Chart on Europe - Market size and forecast 2025-2030 ($ million)
Data Table on Europe - Market size and forecast 2025-2030 ($ million)
Chart on Europe - Year-over-year growth 2025-2030 (%)
Data Table on Europe - Year-over-year growth 2025-2030 (%)
Chart on Regional Comparison - Europe
Data Table on Regional Comparison - Europe

12.4.1 Germany - Market size and forecast 2025-2030

Chart on Germany - Market size and forecast 2025-2030 ($ million)
Data Table on Germany - Market size and forecast 2025-2030 ($ million)
Chart on Germany - Year-over-year growth 2025-2030 (%)
Data Table on Germany - Year-over-year growth 2025-2030 (%)

12.4.2 UK - Market size and forecast 2025-2030

Chart on UK - Market size and forecast 2025-2030 ($ million)
Data Table on UK - Market size and forecast 2025-2030 ($ million)
Chart on UK - Year-over-year growth 2025-2030 (%)
Data Table on UK - Year-over-year growth 2025-2030 (%)

12.4.3 France - Market size and forecast 2025-2030

Chart on France - Market size and forecast 2025-2030 ($ million)
Data Table on France - Market size and forecast 2025-2030 ($ million)
Chart on France - Year-over-year growth 2025-2030 (%)
Data Table on France - Year-over-year growth 2025-2030 (%)

12.4.4 Italy - Market size and forecast 2025-2030

Chart on Italy - Market size and forecast 2025-2030 ($ million)
Data Table on Italy - Market size and forecast 2025-2030 ($ million)
Chart on Italy - Year-over-year growth 2025-2030 (%)
Data Table on Italy - Year-over-year growth 2025-2030 (%)

12.4.5 Spain - Market size and forecast 2025-2030

Chart on Spain - Market size and forecast 2025-2030 ($ million)
Data Table on Spain - Market size and forecast 2025-2030 ($ million)
Chart on Spain - Year-over-year growth 2025-2030 (%)
Data Table on Spain - Year-over-year growth 2025-2030 (%)

12.4.6 The Netherlands - Market size and forecast 2025-2030

Chart on The Netherlands - Market size and forecast 2025-2030 ($ million)
Data Table on The Netherlands - Market size and forecast 2025-2030 ($ million)
Chart on The Netherlands - Year-over-year growth 2025-2030 (%)
Data Table on The Netherlands - Year-over-year growth 2025-2030 (%)

12.5 Asia - Market size and forecast 2025-2030

Chart on Asia - Market size and forecast 2025-2030 ($ million)
Data Table on Asia - Market size and forecast 2025-2030 ($ million)
Chart on Asia - Year-over-year growth 2025-2030 (%)
Data Table on Asia - Year-over-year growth 2025-2030 (%)
Chart on Regional Comparison - Asia
Data Table on Regional Comparison - Asia

12.5.1 China - Market size and forecast 2025-2030

Chart on China - Market size and forecast 2025-2030 ($ million)
Data Table on China - Market size and forecast 2025-2030 ($ million)
Chart on China - Year-over-year growth 2025-2030 (%)
Data Table on China - Year-over-year growth 2025-2030 (%)

12.5.2 India - Market size and forecast 2025-2030

Chart on India - Market size and forecast 2025-2030 ($ million)
Data Table on India - Market size and forecast 2025-2030 ($ million)
Chart on India - Year-over-year growth 2025-2030 (%)
Data Table on India - Year-over-year growth 2025-2030 (%)

12.5.3 Japan - Market size and forecast 2025-2030

Chart on Japan - Market size and forecast 2025-2030 ($ million)
Data Table on Japan - Market size and forecast 2025-2030 ($ million)
Chart on Japan - Year-over-year growth 2025-2030 (%)
Data Table on Japan - Year-over-year growth 2025-2030 (%)

12.5.4 South Korea - Market size and forecast 2025-2030

Chart on South Korea - Market size and forecast 2025-2030 ($ million)
Data Table on South Korea - Market size and forecast 2025-2030 ($ million)
Chart on South Korea - Year-over-year growth 2025-2030 (%)
Data Table on South Korea - Year-over-year growth 2025-2030 (%)

12.5.5 Indonesia - Market size and forecast 2025-2030

Chart on Indonesia - Market size and forecast 2025-2030 ($ million)
Data Table on Indonesia - Market size and forecast 2025-2030 ($ million)
Chart on Indonesia - Year-over-year growth 2025-2030 (%)
Data Table on Indonesia - Year-over-year growth 2025-2030 (%)

12.5.6 Thailand - Market size and forecast 2025-2030

Chart on Thailand - Market size and forecast 2025-2030 ($ million)
Data Table on Thailand - Market size and forecast 2025-2030 ($ million)
Chart on Thailand - Year-over-year growth 2025-2030 (%)
Data Table on Thailand - Year-over-year growth 2025-2030 (%)

12.6 Rest of World (ROW) - Market size and forecast 2025-2030

Chart on Rest of World (ROW) - Market size and forecast 2025-2030 ($ million)
Data Table on Rest of World (ROW) - Market size and forecast 2025-2030 ($ million)
Chart on Rest of World (ROW) - Year-over-year growth 2025-2030 (%)
Data Table on Rest of World (ROW) - Year-over-year growth 2025-2030 (%)
Chart on Regional Comparison - Rest of World (ROW)
Data Table on Regional Comparison - Rest of World (ROW)

12.6.1 Brazil - Market size and forecast 2025-2030

Chart on Brazil - Market size and forecast 2025-2030 ($ million)
Data Table on Brazil - Market size and forecast 2025-2030 ($ million)
Chart on Brazil - Year-over-year growth 2025-2030 (%)
Data Table on Brazil - Year-over-year growth 2025-2030 (%)

12.6.2 Saudi Arabia - Market size and forecast 2025-2030

Chart on Saudi Arabia - Market size and forecast 2025-2030 ($ million)
Data Table on Saudi Arabia - Market size and forecast 2025-2030 ($ million)
Chart on Saudi Arabia - Year-over-year growth 2025-2030 (%)
Data Table on Saudi Arabia - Year-over-year growth 2025-2030 (%)

12.6.3 Turkey - Market size and forecast 2025-2030

Chart on Turkey - Market size and forecast 2025-2030 ($ million)
Data Table on Turkey - Market size and forecast 2025-2030 ($ million)
Chart on Turkey - Year-over-year growth 2025-2030 (%)
Data Table on Turkey - Year-over-year growth 2025-2030 (%)

12.6.4 Argentina - Market size and forecast 2025-2030

Chart on Argentina - Market size and forecast 2025-2030 ($ million)
Data Table on Argentina - Market size and forecast 2025-2030 ($ million)
Chart on Argentina - Year-over-year growth 2025-2030 (%)
Data Table on Argentina - Year-over-year growth 2025-2030 (%)

12.6.5 UAE - Market size and forecast 2025-2030

Chart on UAE - Market size and forecast 2025-2030 ($ million)
Data Table on UAE - Market size and forecast 2025-2030 ($ million)
Chart on UAE - Year-over-year growth 2025-2030 (%)
Data Table on UAE - Year-over-year growth 2025-2030 (%)

12.6.6 South Africa - Market size and forecast 2025-2030

Chart on South Africa - Market size and forecast 2025-2030 ($ million)
Data Table on South Africa - Market size and forecast 2025-2030 ($ million)
Chart on South Africa - Year-over-year growth 2025-2030 (%)
Data Table on South Africa - Year-over-year growth 2025-2030 (%)

12.6.7 Colombia - Market size and forecast 2025-2030

Chart on Colombia - Market size and forecast 2025-2030 ($ million)
Data Table on Colombia - Market size and forecast 2025-2030 ($ million)
Chart on Colombia - Year-over-year growth 2025-2030 (%)
Data Table on Colombia - Year-over-year growth 2025-2030 (%)

12.6.8 Israel - Market size and forecast 2025-2030

Chart on Israel - Market size and forecast 2025-2030 ($ million)
Data Table on Israel - Market size and forecast 2025-2030 ($ million)
Chart on Israel - Year-over-year growth 2025-2030 (%)
Data Table on Israel - Year-over-year growth 2025-2030 (%)

12.7 Market opportunity by geography

Market opportunity by geography ($ million)
Data Tables on Market opportunity by geography ($ million)

13. Drivers, Challenges, and Opportunity

13.1 Market drivers

Expanding inclusion in national immunization schedule mandates
Surging demand for reduced injection burden and patient compliance
Rapid advancement in mRNA and recombinant formulation platforms

13.2 Market challenges

Complex antigenic interference and formulation stability hazards
Strict regulatory approval barriers and multi-component trial complexities
Cold-chain distribution infrastructure and global logistics constraints

13.3 Impact of drivers and challenges

Impact of drivers and challenges in 2025 and 2030

13.4 Market opportunities

Commercial shift toward combination respiratory virus vaccines
Expansion of pediatric hexavalent formulations in emerging economies
Pivoting toward single-dose adolescent meningococcal combination regimens

14. Competitive Landscape

14.1 Overview

14.2

Overview on criticality of inputs and factors of differentiation

14.3 Landscape disruption

Overview on factors of disruption

14.4 Industry risks

Impact of key risks on business

15. Competitive Analysis

15.1 Companies profiled

Companies covered

15.2 Company ranking index

15.3 Market positioning of companies

Matrix on companies position and classification

15.4 AJ Vaccines AS

AJ Vaccines AS - Overview
AJ Vaccines AS - Product / Service
AJ Vaccines AS - Key offerings
SWOT

15.5 Bharat Biotech Ltd.

Bharat Biotech Ltd. - Overview
Bharat Biotech Ltd. - Product / Service
Bharat Biotech Ltd. - Key offerings
SWOT

15.6 BioKangtai

BioKangtai - Overview
BioKangtai - Product / Service
BioKangtai - Key offerings
SWOT

15.7 Biological E. Ltd.

Biological E. Ltd. - Overview
Biological E. Ltd. - Product / Service
Biological E. Ltd. - Key offerings
SWOT

15.8 GC Biopharma Corp.

GC Biopharma Corp. - Overview
GC Biopharma Corp. - Business segments
GC Biopharma Corp. - Key offerings
GC Biopharma Corp. - Segment focus
SWOT

15.9 GlaxoSmithKline Plc

GlaxoSmithKline Plc - Overview
GlaxoSmithKline Plc - Business segments
GlaxoSmithKline Plc - Key news
GlaxoSmithKline Plc - Key offerings
GlaxoSmithKline Plc - Segment focus
SWOT

15.10 LG Chem Ltd.

LG Chem Ltd. - Overview
LG Chem Ltd. - Business segments
LG Chem Ltd. - Key news
LG Chem Ltd. - Key offerings
LG Chem Ltd. - Segment focus
SWOT

15.11 Merck and Co. Inc.

Merck and Co. Inc. - Overview
Merck and Co. Inc. - Business segments
Merck and Co. Inc. - Key news
Merck and Co. Inc. - Key offerings
Merck and Co. Inc. - Segment focus
SWOT

15.12 Pfizer Inc.

Pfizer Inc. - Overview
Pfizer Inc. - Business segments
Pfizer Inc. - Key news
Pfizer Inc. - Key offerings
Pfizer Inc. - Segment focus
SWOT

15.13 PT Bio Farma

PT Bio Farma - Overview
PT Bio Farma - Product / Service
PT Bio Farma - Key offerings
SWOT

15.14 Sanofi SA

Sanofi SA - Overview
Sanofi SA - Business segments
Sanofi SA - Key news
Sanofi SA - Key offerings
Sanofi SA - Segment focus
SWOT

15.15 Serum Institute of India Ltd.

Serum Institute of India Ltd. - Overview
Serum Institute of India Ltd. - Product / Service
Serum Institute of India Ltd. - Key offerings
SWOT

15.16 Sinopharm

Sinopharm - Overview
Sinopharm - Product / Service
Sinopharm - Key offerings
SWOT

15.17 Takeda Pharmaceutical Ltd.

Takeda Pharmaceutical Ltd. - Overview
Takeda Pharmaceutical Ltd. - Business segments
Takeda Pharmaceutical Ltd. - Key news
Takeda Pharmaceutical Ltd. - Key offerings
Takeda Pharmaceutical Ltd. - Segment focus
SWOT

15.18 Walvax Biotechnology Co. Ltd.

Walvax Biotechnology Co. Ltd. - Overview
Walvax Biotechnology Co. Ltd. - Product / Service
Walvax Biotechnology Co. Ltd. - Key offerings
SWOT

16. Appendix

16.1 Scope of the report

Market definition
Objectives
Notes and caveats

16.2 Inclusions and exclusions checklist

Inclusions checklist
Exclusions checklist

16.3 Currency conversion rates for US$

16.4 Research methodology

16.5 Data procurement

Information sources

16.6 Data validation

16.7 Validation techniques employed for market sizing

16.8 Data synthesis

16.9 360 degree market analysis

16.10 List of abbreviations

Research Methodology

Technavio presents a detailed picture of the market by way of study, synthesis, and summation of data from multiple sources. The analysts have presented the various facets of the market with a particular focus on identifying the key industry influencers. The data thus presented is comprehensive, reliable, and the result of extensive research, both primary and secondary.

INFORMATION SOURCES

Primary sources

  • Manufacturers and suppliers
  • Channel partners
  • Industry experts
  • Strategic decision makers

Secondary sources

  • Industry journals and periodicals
  • Government data
  • Financial reports of key industry players
  • Historical data
  • Press releases

DATA ANALYSIS

Data Synthesis

  • Collation of data
  • Estimation of key figures
  • Analysis of derived insights

Data Validation

  • Triangulation with data models
  • Reference against proprietary databases
  • Corroboration with industry experts

REPORT WRITING

Qualitative

  • Market drivers
  • Market challenges
  • Market trends
  • Five forces analysis

Quantitative

  • Market size and forecast
  • Market segmentation
  • Geographical insights
  • Competitive landscape

Interested in this report?

Get your sample now to see our research methodology and insights!

Download Now

Frequently Asked Questions

Human Combination Vaccines market growth will increase by USD 8784.1 million during 2026-2030.

The Human Combination Vaccines market is expected to grow at a CAGR of 9.2% during 2026-2030.

Human Combination Vaccines market is segmented by Type (Inactivated vaccine, Live attenuated vaccine) Channel (Hospitals, Retailers, Online) Route of administration (Intramuscular, Subcutaneous, Oral, Intradermal, Nasal spray)

AJ Vaccines AS, Bharat Biotech Ltd., BioKangtai, Biological E. Ltd., GC Biopharma Corp., GlaxoSmithKline Plc, Incepta Vaccine Ltd., Indian Immunologicals Ltd., KM Biologics Co. Ltd., LG Chem Ltd., Merck and Co. Inc., Panacea Biotec Ltd., Pfizer Inc., PT Bio Farma, Sanofi SA, Serum Institute of India Ltd., Sinopharm, Takeda Pharmaceutical Ltd., The Research Foundation, Walvax Biotechnology Co. Ltd. are a few of the key vendors in the Human Combination Vaccines market.

North America will register the highest growth rate of 48% among the other regions. Therefore, the Human Combination Vaccines market in North America is expected to garner significant business opportunities for the vendors during the forecast period.

US, Canada, Mexico, Germany, UK, France, Italy, Spain, The Netherlands, China, India, Japan, South Korea, Indonesia, Thailand, Brazil, Saudi Arabia, Turkey, Argentina, UAE, South Africa, Colombia, Israel

  • Expanding inclusion in national immunization schedule mandates is the driving factor this market.

The Human Combination Vaccines market vendors should focus on grabbing business opportunities from the Type segment as it accounted for the largest market share in the base year.
RIA - Research AI Assistant
Ask RIA