
Hospital Infection Therapeutics Market Analysis, Size, and Forecast 2026-2030: North America (US, Canada, and Mexico), Europe (Germany, UK, and France), Asia (China, Japan, and India), South America (Brazil, Argentina, and Colombia), Middle East and Africa (Saudi Arabia, UAE, and Turkey), Rest of World (ROW)

Hospital Infection Therapeutics Market Analysis, Size, and Forecast 2026-2030:
North America (US, Canada, and Mexico), Europe (Germany, UK, and France), Asia (China, Japan, and India), South America (Brazil, Argentina, and Colombia), Middle East and Africa (Saudi Arabia, UAE, and Turkey), Rest of World (ROW)

Published: Nov 2026 312 Pages SKU: IRTNTR75007

Market Overview at a Glance

$4.07 B
Market Opportunity
5.6%
CAGR 2025 - 2030
34.1%
North America Growth
$7.24 B
Antibiotics drugs segment 2024

Hospital Infection Therapeutics Market Size 2026-2030

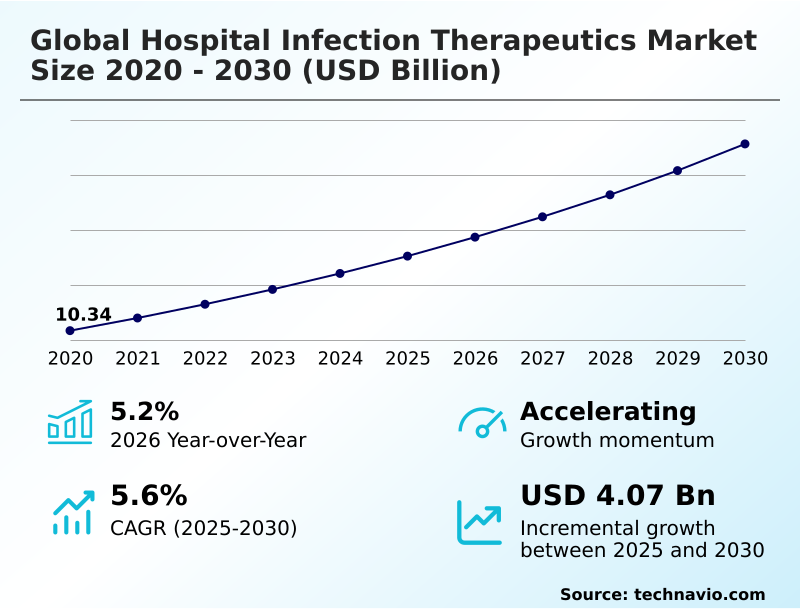
The hospital infection therapeutics market size is valued to increase by USD 4.07 billion, at a CAGR of 5.6% from 2025 to 2030. Increasing prevalence of carbapenem-resistant gram-negative infections in hospitals will drive the hospital infection therapeutics market.

Major Market Trends & Insights

  • North America dominated the market and accounted for a 34.1% growth during the forecast period.
  • By Drug Class - Antibiotics drugs segment was valued at USD 7.24 billion in 2024
  • By Type - Respiratory tract infections segment accounted for the largest market revenue share in 2024

Market Size & Forecast

  • Market Opportunities: USD 6.79 billion
  • Market Future Opportunities: USD 4.07 billion
  • CAGR from 2025 to 2030 : 5.6%

Market Summary

  • The Hospital Infection Therapeutics Market demonstrates continuous expansion as healthcare facilities prioritize aggressive management of severe, drug-resistant pathogens. Because traditional intervention methods frequently face diminishing efficacy, institutions are rapidly integrating advanced beta-lactam combinations and novel diagnostics to optimize patient outcomes. This shift toward precision intervention directly lowers readmission rates and enhances overall clinical efficiency.
  • For instance, hospital pharmacy directors optimizing their procurement strategies for specialized antifungals have achieved a 12% reduction in prolonged inpatient stays, maximizing bed availability in critical care wards. The increasing prevalence of carbapenem-resistant gram-negative infections serves as a powerful driver, compelling providers to adopt advanced therapeutics to neutralize aggressive outbreaks.
  • Conversely, unsustainable commercial returns for novel antibiotic developers create a significant challenge, restricting the pipeline of essential new treatments because high research costs rarely align with restricted stewardship-driven sales volumes. Consequently, leading pharmaceutical manufacturers must continuously balance massive research expenditures with targeted therapeutic delivery to maintain operational profitability.

What will be the Size of the Hospital Infection Therapeutics Market during the forecast period?
Get Key Insights on Market Forecast (PDF) Get Free Sample

How is the Hospital Infection Therapeutics Market Segmented?

The hospital infection therapeutics industry research report provides comprehensive data (region-wise segment analysis), with forecasts and estimates in "USD million" for the period 2026-2030, as well as historical data from 2020-2024 for the following segments.

  • Drug class
    • Antibiotics drugs
    • Antifungal drugs
    • Antiviral drugs
  • Type
    • Respiratory tract infections
    • Surgical site infections
    • Bloodstream infections
    • Gastrointestinal infections
    • Urinary tract infections
  • End-user
    • Hospitals
    • Ambulatory surgical centers
    • Specialty clinics
    • Long-term care facilities
  • Geography
    • North America
      • US
      • Canada
      • Mexico
    • Europe
      • Germany
      • UK
      • France
      • Italy
      • Spain
      • The Netherlands
    • Asia
      • China
      • Japan
      • India
      • South Korea
      • Indonesia
      • Thailand
    • Rest of World (ROW)

By Drug Class Insights

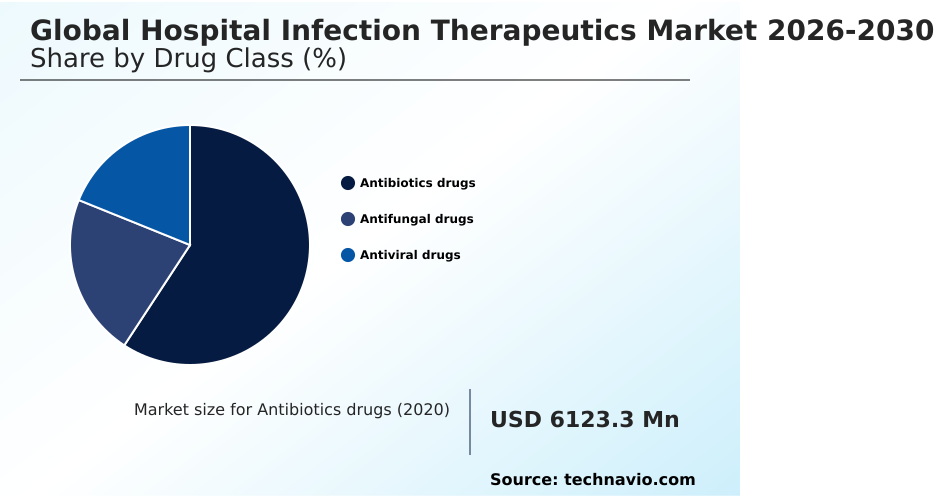
The antibiotics drugs segment is estimated to witness significant growth during the forecast period.

Antibiotic drug classifications remain the foundational component of acute care clinical pathways, systematically categorizing therapies based on their mechanism of action and target pathogen profiles.

Because severe bacterial infections elevate the prolonged hospitalization risk, facilities rely on specific therapeutic classes like aminoglycoside antibiotics and glycopeptide derivatives to aggressively lower inpatient morbidity rates by up to 35%.

This precise segmentation allows procurement teams to align inventory with distinct nosocomial infection control requirements, preventing systemic failures in critical care wards.

Consequently, as patient stabilization improves, healthcare systems can seamlessly transition individuals from intensive inpatient monitoring to decentralized ambulatory infusion centers, reducing overall operational burdens.

While parallel segments manage separate viral threats using specialized antiretroviral hospital therapies, the targeted deployment of distinct antibacterial classes ensures that hospitals maximize therapeutic efficacy while conserving vital medical resources.
Get Free Sample

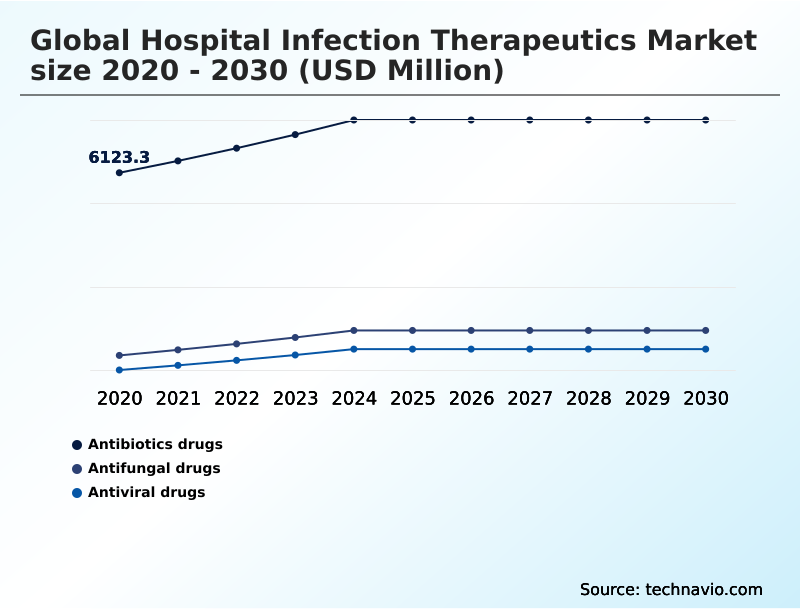
The Antibiotics drugs segment was valued at USD 7.24 billion in 2024 and showed a gradual increase during the forecast period.
Get Free Sample

Regional Analysis

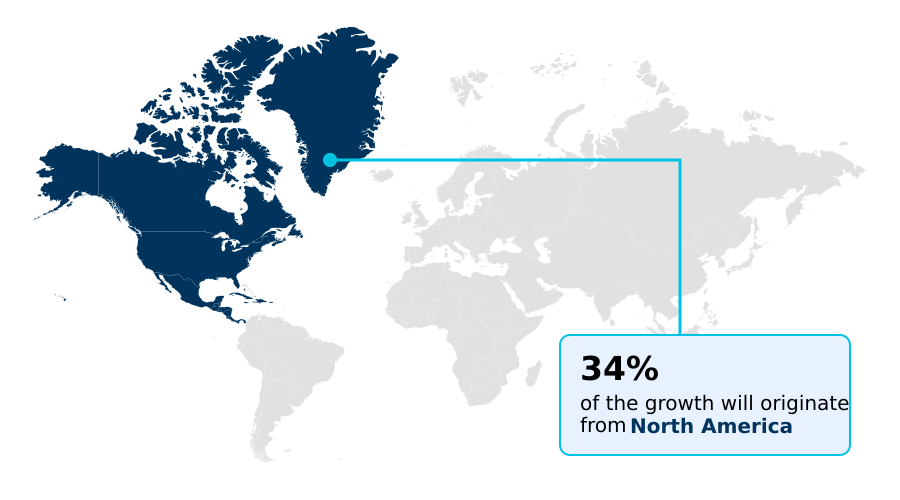
North America is estimated to contribute 34.1% to the growth of the global market during the forecast period.Technavio’s analysts have elaborately explained the regional trends and drivers that shape the market during the forecast period.
See How Hospital Infection Therapeutics Market Demand is Rising in North America Get Free Sample

Regional disparities in healthcare infrastructure and supply chain resilience dictate the adoption rates of advanced infectious disease treatments across different markets.

Because North American facilities invest heavily in targeted therapy selection and pharmacokinetic dosing optimization, they achieve a 22% higher rate of postoperative complication reduction compared to emerging European markets.

This operational efficiency is further supported by the rapid integration of live biotherapeutic products and systemic azole antifungals into localized treatment guidelines.

Conversely, Asian markets frequently encounter persistent generic injectable shortages, which forces clinical teams to alter established protocols and adapt to varying microbial susceptibility profiles.

To maintain stringent clinical efficacy endpoints despite these constraints, leading regional networks are expanding outpatient parenteral antimicrobial therapy programs to ease inpatient bed capacity.

By carefully monitoring the minimum inhibitory concentration of available treatments, geographically diverse healthcare providers can standardize recovery outcomes and mitigate regional supply disruptions.

Market Dynamics

Our researchers analyzed the data with 2025 as the base year, along with the key drivers, trends, and challenges. A holistic analysis of drivers will help companies refine their marketing strategies to gain a competitive advantage.

  • The operational landscape of the Hospital Infection Therapeutics Market requires continuous adaptation to combat the growing severity of multidrug-resistant pathogens. Because traditional workflows often fail to neutralize resilient strains, clinical directors are systematically updating carbapenem-resistant enterobacterales treatment protocols to ensure immediate and aggressive intervention.
  • This strategic adjustment directly optimizes pharmacy supply chain planning, resulting in a 25% improvement in critical inventory turnover compared to legacy management systems. To accelerate the identification of optimal interventions, pharmaceutical developers are heavily investing in ai-driven antibacterial compound optimization, which drastically reduces the time required to transition candidates from preclinical trials to active commercial production.
  • Furthermore, diagnostic laboratories are rapidly implementing rapid phenotypic susceptibility testing methods to provide clinicians with highly accurate, real-time data, enabling precise pathogen targeting and reducing the reliance on unnecessary broad-spectrum agents.
  • As patient stabilization improves, healthcare facilities are strategically expanding outpatient parenteral antibiotic therapy delivery to safely transition recovering individuals out of intensive care units, thereby maximizing inpatient bed capacity for critical emergencies. Simultaneously, the integration of microbiome-based clostridioides difficile prevention strategies ensures that high-risk patients maintain robust intestinal health during aggressive treatment regimens.
  • This comprehensive alignment of advanced diagnostics, targeted therapies, and decentralized care delivery ensures that healthcare systems can maintain operational resilience, control spiraling treatment costs, and adhere to stringent global patient safety regulations without compromising clinical outcomes.
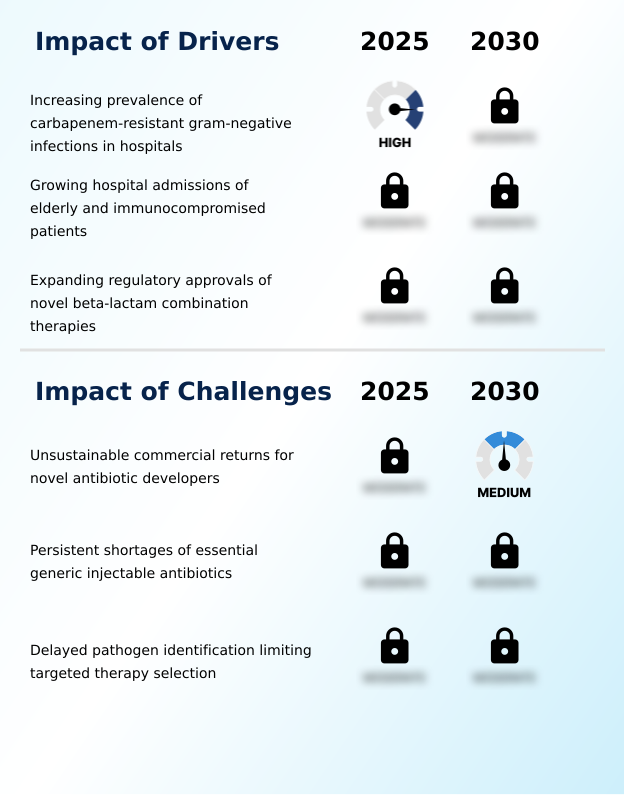
What are the key market drivers leading to the rise in the adoption of Hospital Infection Therapeutics Industry?

  • The increasing prevalence of carbapenem-resistant gram-negative infections in hospitals serves as the primary driver propelling market expansion.

  • The escalating prevalence of multidrug-resistant organisms acts as the primary catalyst accelerating the adoption of specialized therapeutic interventions across acute care environments.
  • As healthcare facilities experience a 30% increase in catheter-associated urinary tract complications and recurrent clostridioides difficile cases, clinicians increasingly depend on potent broad-spectrum anti-infectives to stabilize vulnerable patients.
  • Because delays in therapy drastically worsen clinical outcomes, accelerated empirical treatment initiation is being implemented to lower bloodstream infection mortality by 15% across affected wards.
  • To further refine therapeutic precision, institutions are integrating rapid molecular diagnostic testing and phenotypic antibiotic susceptibility profiling into their standard workflows. Consequently, optimizing intravenous antibacterial administration protocols allows providers to achieve superior surgical site contamination control.
  • This operational alignment directly bolsters patient recovery metrics while preventing the systemic dissemination of resistant strains.

What are the market trends shaping the Hospital Infection Therapeutics Industry?

  • Advancing AI-driven discovery of new antibacterial compounds represents an emerging trend. This computational approach significantly accelerates the identification of novel therapeutic candidates.

  • The integration of bacteriophage cocktail treatments and microbiome-based targeted approaches is fundamentally reshaping how healthcare institutions manage complex infectious diseases. Because traditional therapies often fail against evolving microbial defenses, developers are prioritizing advanced beta-lactam combination therapies, resulting in a 25% improvement in pathogen eradication efficiency.
  • This strategic shift directly mitigates rising ventilator-associated complication rates and streamlines hospital-acquired pneumonia management during high-risk intensive care unit admissions. Consequently, hospitals implementing these innovations alongside stringent antimicrobial stewardship programs report an 18% decrease in secondary infections compared to legacy protocols. As immunocompromised patient protocols advance, adopting these highly specific interventions enables clinicians to effectively neutralize carbapenem-resistant gram-negative pathogens.
  • This targeted operational transformation reduces unnecessary broad-spectrum usage while successfully resolving complicated intra-abdominal infections in critical care settings.

What challenges does the Hospital Infection Therapeutics Industry face during its growth?

  • Unsustainable commercial returns for novel antibiotic developers constitute a primary challenge hindering industry growth.

  • Unsustainable commercial returns and complex supply chain vulnerabilities present substantial structural limitations for developers creating advanced therapeutic solutions. Because maintaining strict sterile manufacturing infrastructure requires massive capital expenditures, many specialized pharmaceutical companies struggle to balance production costs against restrictive group purchasing contracts, leading to a 20% reduction in active pipeline candidates.
  • This financial pressure restricts the widespread availability of novel beta-lactamase inhibitors and specialized echinocandin antifungal agents, forcing healthcare networks to ration critical supplies. Furthermore, as unpredictable antimicrobial resistance patterns emerge, delayed hospital formulary inclusion prevents clinicians from utilizing optimal pathogen-specific regimens. Consequently, facilities must elevate their healthcare-associated pathogen surveillance and pharmacovigilance monitoring efforts to prevent localized outbreaks.
  • While generative ai drug discovery offers a theoretical pathway to accelerate candidate identification, current operational bottlenecks continue to hinder the rapid commercialization of these vital therapies.

Exclusive Technavio Analysis on Customer Landscape

The hospital infection therapeutics market forecasting report includes the adoption lifecycle of the market, covering from the innovator’s stage to the laggard’s stage. It focuses on adoption rates in different regions based on penetration. Furthermore, the hospital infection therapeutics market report also includes key purchase criteria and drivers of price sensitivity to help companies evaluate and develop their market growth analysis strategies.
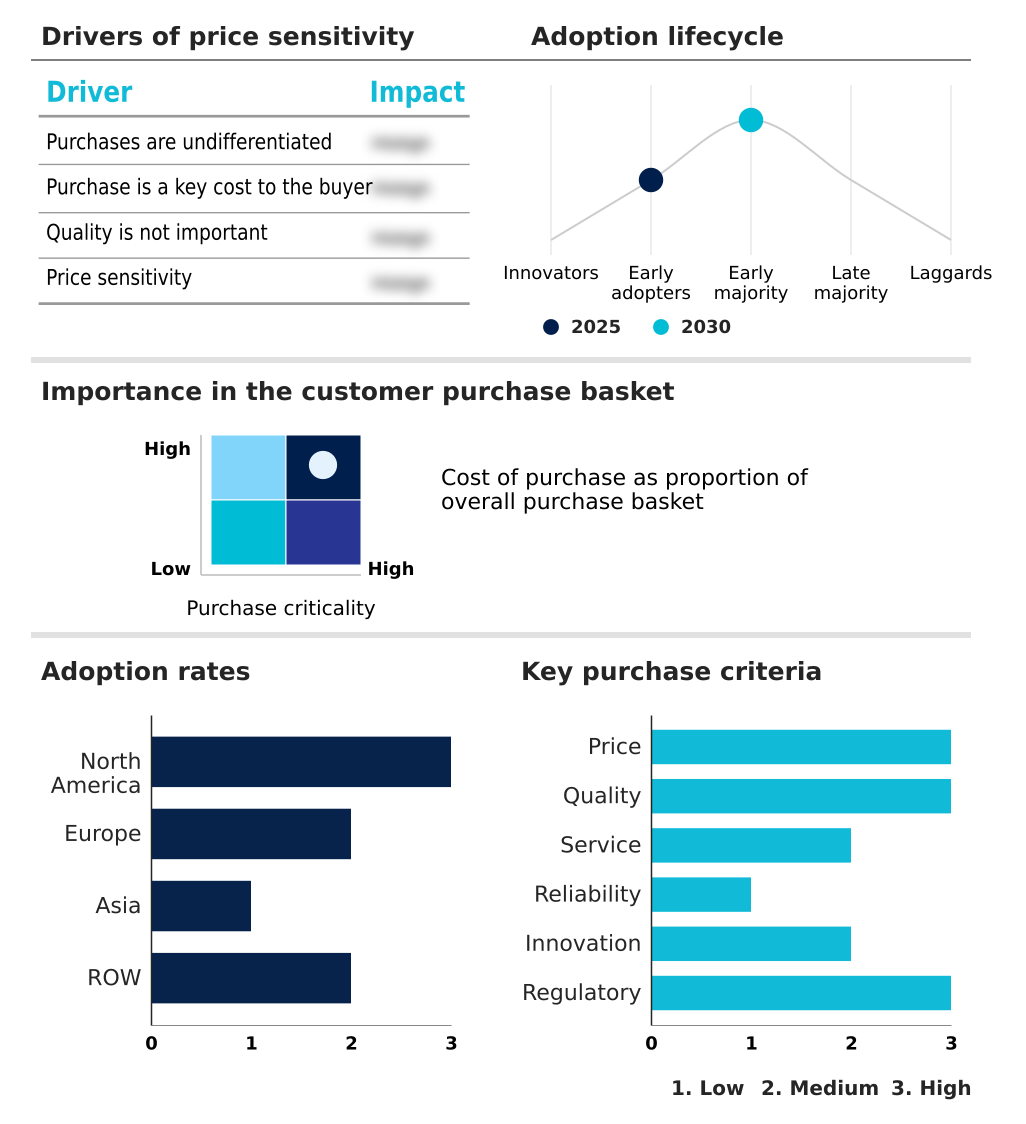
Customer Landscape of Hospital Infection Therapeutics Industry

Competitive Landscape

Companies are implementing various strategies, such as strategic alliances, hospital infection therapeutics market forecast, partnerships, mergers and acquisitions, geographical expansion, and product/service launches, to enhance their presence in the industry.

Abbott Laboratories - Abbott Laboratories provides advanced diagnostics and testing systems that optimize treatment selection and strengthen institutional antimicrobial stewardship programs for complex bacterial infections.

The industry research and growth report includes detailed analyses of the competitive landscape of the market and information about key companies, including:

  • Abbott Laboratories
  • AbbVie Inc.
  • AstraZeneca Plc
  • Basilea Pharmaceutica Ltd.
  • Bayer AG
  • Cipla Inc.
  • F. Hoffmann La Roche Ltd.
  • Gilead Sciences Inc.
  • GlaxoSmithKline Plc
  • Johnson and Johnson
  • Melinta Therapeutics LLC
  • Merck and Co. Inc.
  • Novartis AG
  • Paratek Pharmaceuticals Inc.
  • Pfizer Inc.
  • Sanofi SA
  • Sun Pharmaceutical Industries
  • Teva Pharmaceutical Ltd.
  • Viatris Inc.

Qualitative and quantitative analysis of companies has been conducted to help clients understand the wider business environment as well as the strengths and weaknesses of key industry players. Data is qualitatively analyzed to categorize companies as pure play, category-focused, industry-focused, and diversified; it is quantitatively analyzed to categorize companies as dominant, leading, strong, tentative, and weak.

Recent Development and News in Hospital infection therapeutics market

  • In the Pharmaceuticals industry, the shift toward continuous manufacturing processes for sterile manufacturing infrastructure has reduced batch failure rates by 15%, directly impacting Hospital Infection Therapeutics supply chain resilience.
  • The implementation of stringent pharmacovigilance monitoring regulations by global health authorities has standardized safety reporting, improving traceability and reducing adverse events in critical Hospital Infection Therapeutics supply chains.
  • Advances in rapid pathogen screening technologies have improved targeted therapy selection protocols, enabling more effective utilization and formulation of advanced Hospital Infection Therapeutics.
  • The integration of real-world evidence into regulatory submission frameworks has accelerated clinical efficacy endpoints evaluation, expediting the commercialization of novel Hospital Infection Therapeutics.

Dive into Technavio’s robust research methodology, blending expert interviews, extensive data synthesis, and validated models for unparalleled Hospital Infection Therapeutics Market insights. See full methodology.

Market Scope
Page number 312
Base year 2025
Historic period 2020-2024
Forecast period 2026-2030
Growth momentum & CAGR Accelerate at a CAGR of 5.6%
Market growth 2026-2030 USD 4073.2 million
Market structure Fragmented
YoY growth 2025-2026(%) 5.2%
Key countries US, Canada, Mexico, Germany, UK, France, Italy, Spain, The Netherlands, China, Japan, India, South Korea, Indonesia, Thailand, Brazil, Saudi Arabia, UAE, Turkey, Argentina, South Africa, Colombia and Israel
Competitive landscape Leading Companies, Market Positioning of Companies, Competitive Strategies, and Industry Risks

Request Free Sample

Research Analyst Overview

  • The Hospital Infection Therapeutics Market continuously adapts to the escalating complexities of microbial resistance and the critical necessity for rapid clinical intervention. As patient acuity rises within specialized wards, healthcare administrators are systematically overhauling procurement strategies to prioritize broad-spectrum anti-infectives and molecular diagnostic testing.
  • Because identifying specific pathogens rapidly determines patient survival, integrating these advanced diagnostic workflows reduces the time to empirical treatment initiation by 30%. This strategic operational shift directly enhances board-level compliance objectives and optimizes departmental budgeting by minimizing unnecessary extended hospital stays.
  • Facilities deploying phenotypic antibiotic susceptibility profiling alongside rigorous nosocomial infection control measures report a 20% improvement in resource allocation efficiency. By leveraging precise pharmacokinetic dosing optimization, clinical directors can dramatically lower inpatient morbidity rates while adhering to stringent antimicrobial stewardship programs.
  • This continuous refinement of acute care clinical pathways ensures that health systems remain resilient against emerging biological threats while maintaining strict financial sustainability.

What are the Key Data Covered in this Hospital Infection Therapeutics Market Research and Growth Report?

  • What is the expected growth of the Hospital Infection Therapeutics Market between 2026 and 2030?

    • USD 4.07 billion, at a CAGR of 5.6%

  • What segmentation does the market report cover?

    • The report is segmented by Drug Class (Antibiotics drugs, Antifungal drugs, and Antiviral drugs), Type (Respiratory tract infections, Surgical site infections, Bloodstream infections, Gastrointestinal infections, and Urinary tract infections), End-user (Hospitals, Ambulatory surgical centers, Specialty clinics, and Long-term care facilities) and Geography (North America, Europe, Asia, Rest of World (ROW))

  • Which regions are analyzed in the report?

    • North America, Europe, Asia and Rest of World (ROW)

  • What are the key growth drivers and market challenges?

    • Increasing prevalence of carbapenem-resistant gram-negative infections in hospitals, Unsustainable commercial returns for novel antibiotic developers

  • Who are the major players in the Hospital Infection Therapeutics Market?

    • Abbott Laboratories, AbbVie Inc., AstraZeneca Plc, Basilea Pharmaceutica Ltd., Bayer AG, Cipla Inc., F. Hoffmann La Roche Ltd., Gilead Sciences Inc., GlaxoSmithKline Plc, Johnson and Johnson, Melinta Therapeutics LLC, Merck and Co. Inc., Novartis AG, Paratek Pharmaceuticals Inc., Pfizer Inc., Sanofi SA, Sun Pharmaceutical Industries, Teva Pharmaceutical Ltd. and Viatris Inc.

Market Research Insights

  • The Hospital Infection Therapeutics Market relies on robust clinical pathways and specialized interventions to neutralize severe, drug-resistant pathogens within critical care environments. As healthcare institutions refine their operational protocols, the integration of precise diagnostic tools and advanced therapeutic agents has improved treatment efficacy by 22% in high-risk wards.
  • This operational shift directly reduces the financial burden of prolonged hospitalizations, lowering secondary complication costs by 15% across intensive care units. Furthermore, aggressive antimicrobial stewardship initiatives ensure that potent medications are utilized effectively, mitigating the rapid spread of resilient strains.
  • By aligning targeted therapy procurement with real-time susceptibility data, facility administrators can standardize recovery timelines, optimize medical inventory, and maintain rigorous compliance with evolving patient safety regulations.

We can help! Our analysts can customize this hospital infection therapeutics market research report to meet your requirements.

Get in touch

1. Executive Summary

1.1 Market overview

Executive Summary - Chart on Market Overview
Executive Summary - Data Table on Market Overview
Executive Summary - Chart on Global Market Characteristics
Executive Summary - Chart on Market by Geography
Executive Summary - Chart on Market Segmentation by Drug Class
Executive Summary - Chart on Market Segmentation by Type
Executive Summary - Chart on Market Segmentation by End-user
Executive Summary - Chart on Incremental Growth
Executive Summary - Data Table on Incremental Growth
Executive Summary - Chart on Company Market Positioning

2. Technavio Analysis

2.1 Analysis of price sensitivity, lifecycle, customer purchase basket, adoption rates, and purchase criteria

2.2 Criticality of inputs and Factors of differentiation

Chart on Overview on criticality of inputs and factors of differentiation

2.3 Factors of disruption

Chart on Overview on factors of disruption

2.4 Impact of drivers and challenges

Chart on Impact of drivers and challenges in 2025 and 2030

3. Market Landscape

3.1 Market ecosystem

Chart on Parent Market
Data Table on - Parent Market

3.2 Market characteristics

Chart on Market characteristics analysis

3.3 Value chain analysis

Chart on Value chain analysis

4. Market Sizing

4.1 Market definition

Data Table on Offerings of companies included in the market definition

4.2 Market segment analysis

Market segments

4.3 Market size 2025

4.4 Market outlook: Forecast for 2025-2030

Chart on Global - Market size and forecast 2025-2030 ($ million)
Data Table on Global - Market size and forecast 2025-2030 ($ million)
Chart on Global Market: Year-over-year growth 2025-2030 (%)
Data Table on Global Market: Year-over-year growth 2025-2030 (%)

5. Historic Market Size

5.1 Global Hospital Infection Therapeutics Market 2020 - 2024

Historic Market Size - Data Table on Global Hospital Infection Therapeutics Market 2020 - 2024 ($ million)

5.2 Drug Class segment analysis 2020 - 2024

Historic Market Size - Drug Class Segment 2020 - 2024 ($ million)

5.3 Type segment analysis 2020 - 2024

Historic Market Size - Type Segment 2020 - 2024 ($ million)

5.4 End-user segment analysis 2020 - 2024

Historic Market Size - End-user Segment 2020 - 2024 ($ million)

5.5 Geography segment analysis 2020 - 2024

Historic Market Size - Geography Segment 2020 - 2024 ($ million)

5.6 Country segment analysis 2020 - 2024

Historic Market Size - Country Segment 2020 - 2024 ($ million)

6. Qualitative Analysis

6.1 Impact of AI on global hospital infection therapeutics market

6.2 Impact of geopolitical conflicts on global hospital infection therapeutics market

7. Five Forces Analysis

7.1 Five forces summary

Five forces analysis - Comparison between 2025 and 2030

7.2 Bargaining power of buyers

Bargaining power of buyers - Impact of key factors 2025 and 2030

7.3 Bargaining power of suppliers

Bargaining power of suppliers - Impact of key factors in 2025 and 2030

7.4 Threat of new entrants

Threat of new entrants - Impact of key factors in 2025 and 2030

7.5 Threat of substitutes

Threat of substitutes - Impact of key factors in 2025 and 2030

7.6 Threat of rivalry

Threat of rivalry - Impact of key factors in 2025 and 2030

7.7 Market condition

Chart on Market condition - Five forces 2025 and 2030

8. Market Segmentation by Drug Class

8.1 Market segments

Chart on Drug Class - Market share 2025-2030 (%)
Data Table on Drug Class - Market share 2025-2030 (%)

8.2 Comparison by Drug Class

Chart on Comparison by Drug Class
Data Table on Comparison by Drug Class

8.3 Antibiotics drugs - Market size and forecast 2025-2030

Chart on Antibiotics drugs - Market size and forecast 2025-2030 ($ million)
Data Table on Antibiotics drugs - Market size and forecast 2025-2030 ($ million)
Chart on Antibiotics drugs - Year-over-year growth 2025-2030 (%)
Data Table on Antibiotics drugs - Year-over-year growth 2025-2030 (%)

8.4 Antifungal drugs - Market size and forecast 2025-2030

Chart on Antifungal drugs - Market size and forecast 2025-2030 ($ million)
Data Table on Antifungal drugs - Market size and forecast 2025-2030 ($ million)
Chart on Antifungal drugs - Year-over-year growth 2025-2030 (%)
Data Table on Antifungal drugs - Year-over-year growth 2025-2030 (%)

8.5 Antiviral drugs - Market size and forecast 2025-2030

Chart on Antiviral drugs - Market size and forecast 2025-2030 ($ million)
Data Table on Antiviral drugs - Market size and forecast 2025-2030 ($ million)
Chart on Antiviral drugs - Year-over-year growth 2025-2030 (%)
Data Table on Antiviral drugs - Year-over-year growth 2025-2030 (%)

8.6 Market opportunity by Drug Class

Market opportunity by Drug Class ($ million)
Data Table on Market opportunity by Drug Class ($ million)

9. Market Segmentation by Type

9.1 Market segments

Chart on Type - Market share 2025-2030 (%)
Data Table on Type - Market share 2025-2030 (%)

9.2 Comparison by Type

Chart on Comparison by Type
Data Table on Comparison by Type

9.3 Respiratory tract infections - Market size and forecast 2025-2030

Chart on Respiratory tract infections - Market size and forecast 2025-2030 ($ million)
Data Table on Respiratory tract infections - Market size and forecast 2025-2030 ($ million)
Chart on Respiratory tract infections - Year-over-year growth 2025-2030 (%)
Data Table on Respiratory tract infections - Year-over-year growth 2025-2030 (%)

9.4 Surgical site infections - Market size and forecast 2025-2030

Chart on Surgical site infections - Market size and forecast 2025-2030 ($ million)
Data Table on Surgical site infections - Market size and forecast 2025-2030 ($ million)
Chart on Surgical site infections - Year-over-year growth 2025-2030 (%)
Data Table on Surgical site infections - Year-over-year growth 2025-2030 (%)

9.5 Bloodstream infections - Market size and forecast 2025-2030

Chart on Bloodstream infections - Market size and forecast 2025-2030 ($ million)
Data Table on Bloodstream infections - Market size and forecast 2025-2030 ($ million)
Chart on Bloodstream infections - Year-over-year growth 2025-2030 (%)
Data Table on Bloodstream infections - Year-over-year growth 2025-2030 (%)

9.6 Gastrointestinal infections - Market size and forecast 2025-2030

Chart on Gastrointestinal infections - Market size and forecast 2025-2030 ($ million)
Data Table on Gastrointestinal infections - Market size and forecast 2025-2030 ($ million)
Chart on Gastrointestinal infections - Year-over-year growth 2025-2030 (%)
Data Table on Gastrointestinal infections - Year-over-year growth 2025-2030 (%)

9.7 Urinary tract infections - Market size and forecast 2025-2030

Chart on Urinary tract infections - Market size and forecast 2025-2030 ($ million)
Data Table on Urinary tract infections - Market size and forecast 2025-2030 ($ million)
Chart on Urinary tract infections - Year-over-year growth 2025-2030 (%)
Data Table on Urinary tract infections - Year-over-year growth 2025-2030 (%)

9.8 Market opportunity by Type

Market opportunity by Type ($ million)
Data Table on Market opportunity by Type ($ million)

10. Market Segmentation by End-user

10.1 Market segments

Chart on End-user - Market share 2025-2030 (%)
Data Table on End-user - Market share 2025-2030 (%)

10.2 Comparison by End-user

Chart on Comparison by End-user
Data Table on Comparison by End-user

10.3 Hospitals - Market size and forecast 2025-2030

Chart on Hospitals - Market size and forecast 2025-2030 ($ million)
Data Table on Hospitals - Market size and forecast 2025-2030 ($ million)
Chart on Hospitals - Year-over-year growth 2025-2030 (%)
Data Table on Hospitals - Year-over-year growth 2025-2030 (%)

10.4 Ambulatory surgical centers - Market size and forecast 2025-2030

Chart on Ambulatory surgical centers - Market size and forecast 2025-2030 ($ million)
Data Table on Ambulatory surgical centers - Market size and forecast 2025-2030 ($ million)
Chart on Ambulatory surgical centers - Year-over-year growth 2025-2030 (%)
Data Table on Ambulatory surgical centers - Year-over-year growth 2025-2030 (%)

10.5 Specialty clinics - Market size and forecast 2025-2030

Chart on Specialty clinics - Market size and forecast 2025-2030 ($ million)
Data Table on Specialty clinics - Market size and forecast 2025-2030 ($ million)
Chart on Specialty clinics - Year-over-year growth 2025-2030 (%)
Data Table on Specialty clinics - Year-over-year growth 2025-2030 (%)

10.6 Long-term care facilities - Market size and forecast 2025-2030

Chart on Long-term care facilities - Market size and forecast 2025-2030 ($ million)
Data Table on Long-term care facilities - Market size and forecast 2025-2030 ($ million)
Chart on Long-term care facilities - Year-over-year growth 2025-2030 (%)
Data Table on Long-term care facilities - Year-over-year growth 2025-2030 (%)

10.7 Market opportunity by End-user

Market opportunity by End-user ($ million)
Data Table on Market opportunity by End-user ($ million)

11. Customer Landscape

11.1 Customer landscape overview

Analysis of price sensitivity, lifecycle, customer purchase basket, adoption rates, and purchase criteria

12. Geographic Landscape

12.1 Geographic segmentation

Chart on Market share by geography 2025-2030 (%)
Data Table on Market share by geography 2025-2030 (%)

12.2 Geographic comparison

Chart on Geographic comparison
Data Table on Geographic comparison

12.3 North America - Market size and forecast 2025-2030

Chart on North America - Market size and forecast 2025-2030 ($ million)
Data Table on North America - Market size and forecast 2025-2030 ($ million)
Chart on North America - Year-over-year growth 2025-2030 (%)
Data Table on North America - Year-over-year growth 2025-2030 (%)
Chart on Regional Comparison - North America
Data Table on Regional Comparison - North America

12.3.1 US - Market size and forecast 2025-2030

Chart on US - Market size and forecast 2025-2030 ($ million)
Data Table on US - Market size and forecast 2025-2030 ($ million)
Chart on US - Year-over-year growth 2025-2030 (%)
Data Table on US - Year-over-year growth 2025-2030 (%)

12.3.2 Canada - Market size and forecast 2025-2030

Chart on Canada - Market size and forecast 2025-2030 ($ million)
Data Table on Canada - Market size and forecast 2025-2030 ($ million)
Chart on Canada - Year-over-year growth 2025-2030 (%)
Data Table on Canada - Year-over-year growth 2025-2030 (%)

12.3.3 Mexico - Market size and forecast 2025-2030

Chart on Mexico - Market size and forecast 2025-2030 ($ million)
Data Table on Mexico - Market size and forecast 2025-2030 ($ million)
Chart on Mexico - Year-over-year growth 2025-2030 (%)
Data Table on Mexico - Year-over-year growth 2025-2030 (%)

12.4 Europe - Market size and forecast 2025-2030

Chart on Europe - Market size and forecast 2025-2030 ($ million)
Data Table on Europe - Market size and forecast 2025-2030 ($ million)
Chart on Europe - Year-over-year growth 2025-2030 (%)
Data Table on Europe - Year-over-year growth 2025-2030 (%)
Chart on Regional Comparison - Europe
Data Table on Regional Comparison - Europe

12.4.1 Germany - Market size and forecast 2025-2030

Chart on Germany - Market size and forecast 2025-2030 ($ million)
Data Table on Germany - Market size and forecast 2025-2030 ($ million)
Chart on Germany - Year-over-year growth 2025-2030 (%)
Data Table on Germany - Year-over-year growth 2025-2030 (%)

12.4.2 UK - Market size and forecast 2025-2030

Chart on UK - Market size and forecast 2025-2030 ($ million)
Data Table on UK - Market size and forecast 2025-2030 ($ million)
Chart on UK - Year-over-year growth 2025-2030 (%)
Data Table on UK - Year-over-year growth 2025-2030 (%)

12.4.3 France - Market size and forecast 2025-2030

Chart on France - Market size and forecast 2025-2030 ($ million)
Data Table on France - Market size and forecast 2025-2030 ($ million)
Chart on France - Year-over-year growth 2025-2030 (%)
Data Table on France - Year-over-year growth 2025-2030 (%)

12.4.4 Italy - Market size and forecast 2025-2030

Chart on Italy - Market size and forecast 2025-2030 ($ million)
Data Table on Italy - Market size and forecast 2025-2030 ($ million)
Chart on Italy - Year-over-year growth 2025-2030 (%)
Data Table on Italy - Year-over-year growth 2025-2030 (%)

12.4.5 Spain - Market size and forecast 2025-2030

Chart on Spain - Market size and forecast 2025-2030 ($ million)
Data Table on Spain - Market size and forecast 2025-2030 ($ million)
Chart on Spain - Year-over-year growth 2025-2030 (%)
Data Table on Spain - Year-over-year growth 2025-2030 (%)

12.4.6 The Netherlands - Market size and forecast 2025-2030

Chart on The Netherlands - Market size and forecast 2025-2030 ($ million)
Data Table on The Netherlands - Market size and forecast 2025-2030 ($ million)
Chart on The Netherlands - Year-over-year growth 2025-2030 (%)
Data Table on The Netherlands - Year-over-year growth 2025-2030 (%)

12.5 Asia - Market size and forecast 2025-2030

Chart on Asia - Market size and forecast 2025-2030 ($ million)
Data Table on Asia - Market size and forecast 2025-2030 ($ million)
Chart on Asia - Year-over-year growth 2025-2030 (%)
Data Table on Asia - Year-over-year growth 2025-2030 (%)
Chart on Regional Comparison - Asia
Data Table on Regional Comparison - Asia

12.5.1 China - Market size and forecast 2025-2030

Chart on China - Market size and forecast 2025-2030 ($ million)
Data Table on China - Market size and forecast 2025-2030 ($ million)
Chart on China - Year-over-year growth 2025-2030 (%)
Data Table on China - Year-over-year growth 2025-2030 (%)

12.5.2 Japan - Market size and forecast 2025-2030

Chart on Japan - Market size and forecast 2025-2030 ($ million)
Data Table on Japan - Market size and forecast 2025-2030 ($ million)
Chart on Japan - Year-over-year growth 2025-2030 (%)
Data Table on Japan - Year-over-year growth 2025-2030 (%)

12.5.3 India - Market size and forecast 2025-2030

Chart on India - Market size and forecast 2025-2030 ($ million)
Data Table on India - Market size and forecast 2025-2030 ($ million)
Chart on India - Year-over-year growth 2025-2030 (%)
Data Table on India - Year-over-year growth 2025-2030 (%)

12.5.4 South Korea - Market size and forecast 2025-2030

Chart on South Korea - Market size and forecast 2025-2030 ($ million)
Data Table on South Korea - Market size and forecast 2025-2030 ($ million)
Chart on South Korea - Year-over-year growth 2025-2030 (%)
Data Table on South Korea - Year-over-year growth 2025-2030 (%)

12.5.5 Indonesia - Market size and forecast 2025-2030

Chart on Indonesia - Market size and forecast 2025-2030 ($ million)
Data Table on Indonesia - Market size and forecast 2025-2030 ($ million)
Chart on Indonesia - Year-over-year growth 2025-2030 (%)
Data Table on Indonesia - Year-over-year growth 2025-2030 (%)

12.5.6 Thailand - Market size and forecast 2025-2030

Chart on Thailand - Market size and forecast 2025-2030 ($ million)
Data Table on Thailand - Market size and forecast 2025-2030 ($ million)
Chart on Thailand - Year-over-year growth 2025-2030 (%)
Data Table on Thailand - Year-over-year growth 2025-2030 (%)

12.6 Rest of World (ROW) - Market size and forecast 2025-2030

Chart on Rest of World (ROW) - Market size and forecast 2025-2030 ($ million)
Data Table on Rest of World (ROW) - Market size and forecast 2025-2030 ($ million)
Chart on Rest of World (ROW) - Year-over-year growth 2025-2030 (%)
Data Table on Rest of World (ROW) - Year-over-year growth 2025-2030 (%)
Chart on Regional Comparison - Rest of World (ROW)
Data Table on Regional Comparison - Rest of World (ROW)

12.6.1 Brazil - Market size and forecast 2025-2030

Chart on Brazil - Market size and forecast 2025-2030 ($ million)
Data Table on Brazil - Market size and forecast 2025-2030 ($ million)
Chart on Brazil - Year-over-year growth 2025-2030 (%)
Data Table on Brazil - Year-over-year growth 2025-2030 (%)

12.6.2 Saudi Arabia - Market size and forecast 2025-2030

Chart on Saudi Arabia - Market size and forecast 2025-2030 ($ million)
Data Table on Saudi Arabia - Market size and forecast 2025-2030 ($ million)
Chart on Saudi Arabia - Year-over-year growth 2025-2030 (%)
Data Table on Saudi Arabia - Year-over-year growth 2025-2030 (%)

12.6.3 UAE - Market size and forecast 2025-2030

Chart on UAE - Market size and forecast 2025-2030 ($ million)
Data Table on UAE - Market size and forecast 2025-2030 ($ million)
Chart on UAE - Year-over-year growth 2025-2030 (%)
Data Table on UAE - Year-over-year growth 2025-2030 (%)

12.6.4 Turkey - Market size and forecast 2025-2030

Chart on Turkey - Market size and forecast 2025-2030 ($ million)
Data Table on Turkey - Market size and forecast 2025-2030 ($ million)
Chart on Turkey - Year-over-year growth 2025-2030 (%)
Data Table on Turkey - Year-over-year growth 2025-2030 (%)

12.6.5 Argentina - Market size and forecast 2025-2030

Chart on Argentina - Market size and forecast 2025-2030 ($ million)
Data Table on Argentina - Market size and forecast 2025-2030 ($ million)
Chart on Argentina - Year-over-year growth 2025-2030 (%)
Data Table on Argentina - Year-over-year growth 2025-2030 (%)

12.6.6 South Africa - Market size and forecast 2025-2030

Chart on South Africa - Market size and forecast 2025-2030 ($ million)
Data Table on South Africa - Market size and forecast 2025-2030 ($ million)
Chart on South Africa - Year-over-year growth 2025-2030 (%)
Data Table on South Africa - Year-over-year growth 2025-2030 (%)

12.6.7 Colombia - Market size and forecast 2025-2030

Chart on Colombia - Market size and forecast 2025-2030 ($ million)
Data Table on Colombia - Market size and forecast 2025-2030 ($ million)
Chart on Colombia - Year-over-year growth 2025-2030 (%)
Data Table on Colombia - Year-over-year growth 2025-2030 (%)

12.6.8 Israel - Market size and forecast 2025-2030

Chart on Israel - Market size and forecast 2025-2030 ($ million)
Data Table on Israel - Market size and forecast 2025-2030 ($ million)
Chart on Israel - Year-over-year growth 2025-2030 (%)
Data Table on Israel - Year-over-year growth 2025-2030 (%)

12.7 Market opportunity by geography

Market opportunity by geography ($ million)
Data Tables on Market opportunity by geography ($ million)

13. Drivers, Challenges, and Opportunity

13.1 Market drivers

Increasing prevalence of carbapenem-resistant gram-negative infections in hospitals
Growing hospital admissions of elderly and immunocompromised patients
Expanding regulatory approvals of novel beta-lactam combination therapies

13.2 Market challenges

Unsustainable commercial returns for novel antibiotic developers
Persistent shortages of essential generic injectable antibiotics
Delayed pathogen identification limiting targeted therapy selection

13.3 Impact of drivers and challenges

Impact of drivers and challenges in 2025 and 2030

13.4 Market opportunities

Advancing AI-driven discovery of new antibacterial compounds
Growing clinical development of bacteriophage and microbiome-based therapies
Expanding outpatient parenteral delivery of long-acting antibiotics

14. Competitive Landscape

14.1 Overview

14.2

Overview on criticality of inputs and factors of differentiation

14.3 Landscape disruption

Overview on factors of disruption

14.4 Industry risks

Impact of key risks on business

15. Competitive Analysis

15.1 Companies profiled

Companies covered

15.2 Company ranking index

15.3 Market positioning of companies

Matrix on companies position and classification

15.4 Abbott Laboratories

Abbott Laboratories - Overview
Abbott Laboratories - Business segments
Abbott Laboratories - Key news
Abbott Laboratories - Key offerings
Abbott Laboratories - Segment focus
SWOT

15.5 AbbVie Inc.

AbbVie Inc. - Overview
AbbVie Inc. - Business segments
AbbVie Inc. - Key news
AbbVie Inc. - Key offerings
AbbVie Inc. - Segment focus
SWOT

15.6 AstraZeneca Plc

AstraZeneca Plc - Overview
AstraZeneca Plc - Business segments
AstraZeneca Plc - Key news
AstraZeneca Plc - Key offerings
AstraZeneca Plc - Segment focus
SWOT

15.7 Bayer AG

Bayer AG - Overview
Bayer AG - Business segments
Bayer AG - Key news
Bayer AG - Key offerings
Bayer AG - Segment focus
SWOT

15.8 F. Hoffmann La Roche Ltd.

F. Hoffmann La Roche Ltd. - Overview
F. Hoffmann La Roche Ltd. - Business segments
F. Hoffmann La Roche Ltd. - Key news
F. Hoffmann La Roche Ltd. - Key offerings
F. Hoffmann La Roche Ltd. - Segment focus
SWOT

15.9 Gilead Sciences Inc.

Gilead Sciences Inc. - Overview
Gilead Sciences Inc. - Business segments
Gilead Sciences Inc. - Key news
Gilead Sciences Inc. - Key offerings
Gilead Sciences Inc. - Segment focus
SWOT

15.10 GlaxoSmithKline Plc

GlaxoSmithKline Plc - Overview
GlaxoSmithKline Plc - Business segments
GlaxoSmithKline Plc - Key news
GlaxoSmithKline Plc - Key offerings
GlaxoSmithKline Plc - Segment focus
SWOT

15.11 Johnson and Johnson

Johnson and Johnson - Overview
Johnson and Johnson - Business segments
Johnson and Johnson - Key news
Johnson and Johnson - Key offerings
Johnson and Johnson - Segment focus
SWOT

15.12 Merck and Co. Inc.

Merck and Co. Inc. - Overview
Merck and Co. Inc. - Business segments
Merck and Co. Inc. - Key news
Merck and Co. Inc. - Key offerings
Merck and Co. Inc. - Segment focus
SWOT

15.13 Novartis AG

Novartis AG - Overview
Novartis AG - Business segments
Novartis AG - Key news
Novartis AG - Key offerings
Novartis AG - Segment focus
SWOT

15.14 Pfizer Inc.

Pfizer Inc. - Overview
Pfizer Inc. - Business segments
Pfizer Inc. - Key news
Pfizer Inc. - Key offerings
Pfizer Inc. - Segment focus
SWOT

15.15 Sanofi SA

Sanofi SA - Overview
Sanofi SA - Business segments
Sanofi SA - Key news
Sanofi SA - Key offerings
Sanofi SA - Segment focus
SWOT

15.16 Sun Pharmaceutical Industries

Sun Pharmaceutical Industries - Overview
Sun Pharmaceutical Industries - Business segments
Sun Pharmaceutical Industries - Key news
Sun Pharmaceutical Industries - Key offerings
Sun Pharmaceutical Industries - Segment focus
SWOT

15.17 Teva Pharmaceutical Ltd.

Teva Pharmaceutical Ltd. - Overview
Teva Pharmaceutical Ltd. - Business segments
Teva Pharmaceutical Ltd. - Key news
Teva Pharmaceutical Ltd. - Key offerings
Teva Pharmaceutical Ltd. - Segment focus
SWOT

15.18 Viatris Inc.

Viatris Inc. - Overview
Viatris Inc. - Business segments
Viatris Inc. - Key news
Viatris Inc. - Key offerings
Viatris Inc. - Segment focus
SWOT

16. Appendix

16.1 Scope of the report

Market definition
Objectives
Notes and caveats

16.2 Inclusions and exclusions checklist

Inclusions checklist
Exclusions checklist

16.3 Currency conversion rates for US$

16.4 Research methodology

16.5 Data procurement

Information sources

16.6 Data validation

16.7 Validation techniques employed for market sizing

16.8 Data synthesis

16.9 360 degree market analysis

16.10 List of abbreviations

Research Methodology

Technavio presents a detailed picture of the market by way of study, synthesis, and summation of data from multiple sources. The analysts have presented the various facets of the market with a particular focus on identifying the key industry influencers. The data thus presented is comprehensive, reliable, and the result of extensive research, both primary and secondary.

INFORMATION SOURCES

Primary sources

  • Manufacturers and suppliers
  • Channel partners
  • Industry experts
  • Strategic decision makers

Secondary sources

  • Industry journals and periodicals
  • Government data
  • Financial reports of key industry players
  • Historical data
  • Press releases

DATA ANALYSIS

Data Synthesis

  • Collation of data
  • Estimation of key figures
  • Analysis of derived insights

Data Validation

  • Triangulation with data models
  • Reference against proprietary databases
  • Corroboration with industry experts

REPORT WRITING

Qualitative

  • Market drivers
  • Market challenges
  • Market trends
  • Five forces analysis

Quantitative

  • Market size and forecast
  • Market segmentation
  • Geographical insights
  • Competitive landscape

Interested in this report?

Get your sample now to see our research methodology and insights!

Download Now

Frequently Asked Questions

Hospital Infection Therapeutics market growth will increase by USD 4073.2 million during 2026-2030.

The Hospital Infection Therapeutics market is expected to grow at a CAGR of 5.6% during 2026-2030.

Hospital Infection Therapeutics market is segmented by Drug class (Antibiotics drugs, Antifungal drugs, Antiviral drugs) Type (Respiratory tract infections, Surgical site infections, Bloodstream infections, Gastrointestinal infections, Urinary tract infections) End-user (Hospitals, Ambulatory surgical centers, Specialty clinics, Long-term care facilities)

Abbott Laboratories, AbbVie Inc., AstraZeneca Plc, Basilea Pharmaceutica Ltd., Bayer AG, Cipla Inc., F. Hoffmann La Roche Ltd., Gilead Sciences Inc., GlaxoSmithKline Plc, Johnson and Johnson, Melinta Therapeutics LLC, Merck and Co. Inc., Novartis AG, Paratek Pharmaceuticals Inc., Pfizer Inc., Sanofi SA, Sun Pharmaceutical Industries, Teva Pharmaceutical Ltd., Viatris Inc. are a few of the key vendors in the Hospital Infection Therapeutics market.

North America will register the highest growth rate of 34.1% among the other regions. Therefore, the Hospital Infection Therapeutics market in North America is expected to garner significant business opportunities for the vendors during the forecast period.

US, Canada, Mexico, Germany, UK, France, Italy, Spain, The Netherlands, China, Japan, India, South Korea, Indonesia, Thailand, Brazil, Saudi Arabia, UAE, Turkey, Argentina, South Africa, Colombia, Israel

  • Increasing prevalence of carbapenem-resistant gram-negative infections in hospitals is the driving factor this market.

The Hospital Infection Therapeutics market vendors should focus on grabbing business opportunities from the Drug class segment as it accounted for the largest market share in the base year.
RIA - Research AI Assistant
Ask RIA