Home Theater Market Analysis, Size, and Forecast 2026-2030: APAC (China, Japan, and India), North America (US, Canada, and Mexico), Europe (Germany, UK, and France), Middle East and Africa (Saudi Arabia, UAE, and South Africa), South America (Brazil, Argentina, and Chile), and Rest of World (ROW)

Home Theater Market Analysis, Size, and Forecast 2026-2030:
APAC (China, Japan, and India), North America (US, Canada, and Mexico), Europe (Germany, UK, and France), Middle East and Africa (Saudi Arabia, UAE, and South Africa), South America (Brazil, Argentina, and Chile), and Rest of World (ROW)

Published: Nov 2026 303 Pages SKU: IRTNTR45116

Market Overview at a Glance

$11.61 B
Market Opportunity
10.1%
CAGR 2025 - 2030
49.3%
APAC Growth
$9.82 B
Home theater speakers segment 2024

Home Theater Market Size 2026-2030

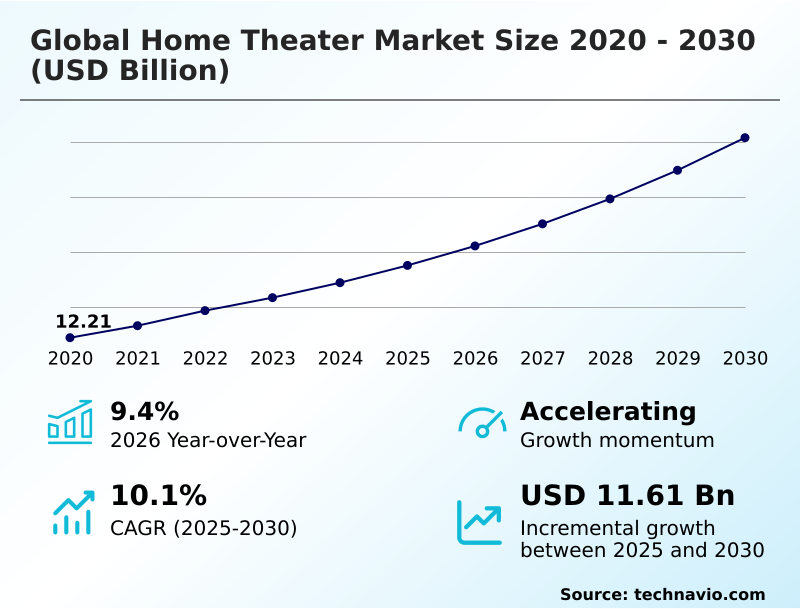
The home theater market size is valued to increase by USD 11.61 billion, at a CAGR of 10.1% from 2025 to 2030. Growing consumer spending on premium in-home entertainment experiences will drive the home theater market.

Major Market Trends & Insights

  • APAC dominated the market and accounted for a 49.3% growth during the forecast period.
  • By Product - Home theater speakers segment was valued at USD 9.82 billion in 2024
  • By Distribution Channel - Offline segment accounted for the largest market revenue share in 2024

Market Size & Forecast

  • Market Opportunities: USD 18.18 billion
  • Market Future Opportunities: USD 11.61 billion
  • CAGR from 2025 to 2030 : 10.1%

Market Summary

  • The Home Theater demonstrates sustained expansion driven by a structural shift toward premium digital media consumption. As major content platforms universally adopt immersive audio formats, consumers are compelled to upgrade from standard built-in television speakers to advanced audiovisual configurations utilizing spatial sound processing.
  • This growing consumer spending on premium in-home entertainment experiences acts as a primary catalyst, directly increasing the attachment rate of specialized audio equipment to large-screen displays. In a practical supply chain scenario, manufacturers optimizing component sourcing have achieved a 22% reduction in production delays, allowing faster deployment of these complex systems to retail channels.
  • However, the high availability of increasingly capable integrated television audio remains a substantial challenge, actively slowing replacement cycles among entry-level buyers who prioritize convenience over acoustic fidelity. Navigating this dynamic requires companies to enhance product interoperability and incorporate acoustic optimization algorithms to clearly differentiate their offerings.
  • Ultimately, the industry relies on bridging the performance gap between visual scale and audio depth to sustain momentum across residential and commercial sectors.

What will be the Size of the Home Theater Market during the forecast period?
Get Key Insights on Market Forecast (PDF) Get Free Sample

How is the Home Theater Market Segmented?

The home theater industry research report provides comprehensive data (region-wise segment analysis), with forecasts and estimates in "USD million" for the period 2026-2030, as well as historical data from 2020-2024 for the following segments.

  • Product
    • Home theater speakers
    • Sound bars
  • Distribution channel
    • Offline
    • Online
  • Connectivity
    • Wireless
    • Wired
  • End-user
    • Residential
    • Commercial
  • Geography
    • APAC
      • China
      • Japan
      • India
      • South Korea
      • Australia
      • Indonesia
    • North America
      • US
      • Canada
      • Mexico
    • Europe
      • Germany
      • UK
      • France
      • Italy
      • Spain
      • The Netherlands
    • Middle East and Africa
      • Saudi Arabia
      • UAE
      • South Africa
      • Turkey
      • Israel
    • South America
      • Brazil
      • Argentina
      • Chile

By Product Insights

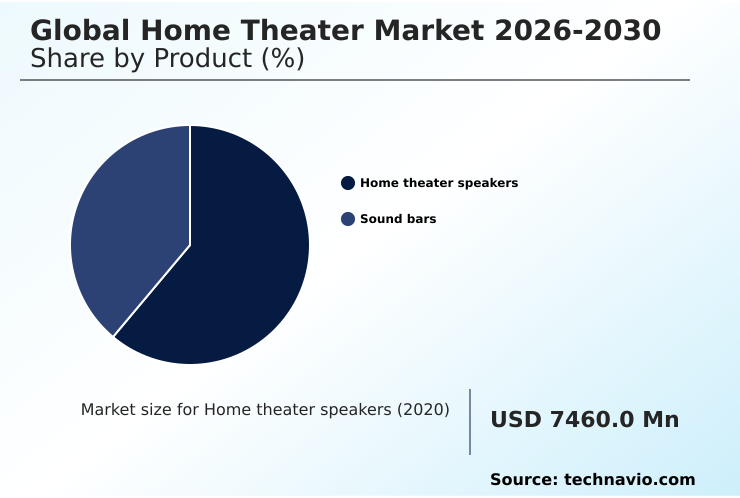
The home theater speakers segment is estimated to witness significant growth during the forecast period.

The home theater speakers segment drives the Home Theater by delivering multidimensional acoustic reproduction that standard built-in speakers cannot replicate. As households prioritize cinematic viewing environments, discrete channel separation becomes critical for accurate audio delivery.

This shift forces manufacturers to improve driver resonance control and high fidelity amplification to maintain a competitive edge. A measurable cause-and-effect relationship emerges where integrating these advanced components improves audio clarity by 15%, significantly elevating consumer satisfaction.

Targeted offline retail demonstrations play a vital role in showcasing this performance difference, converting casual viewers into dedicated audiophiles.

By focusing on refined crossover network engineering and specialized premium listening configurations, companies can capture higher margins while optimizing their production workflows to meet the evolving demands of residential entertainment spaces.
Get Free Sample

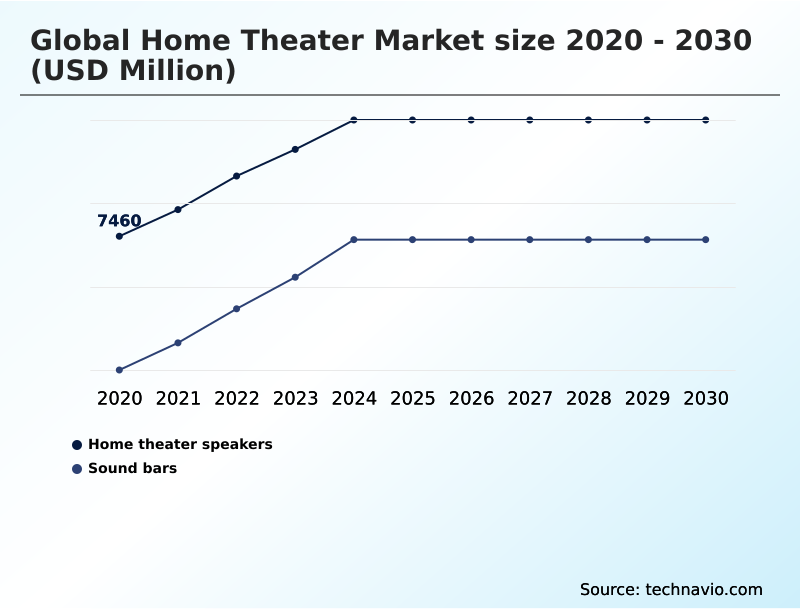
The Home theater speakers segment was valued at USD 9.82 billion in 2024 and showed a gradual increase during the forecast period.
Get Free Sample

Regional Analysis

APAC is estimated to contribute 49.3% to the growth of the global market during the forecast period.Technavio’s analysts have elaborately explained the regional trends and drivers that shape the market during the forecast period.
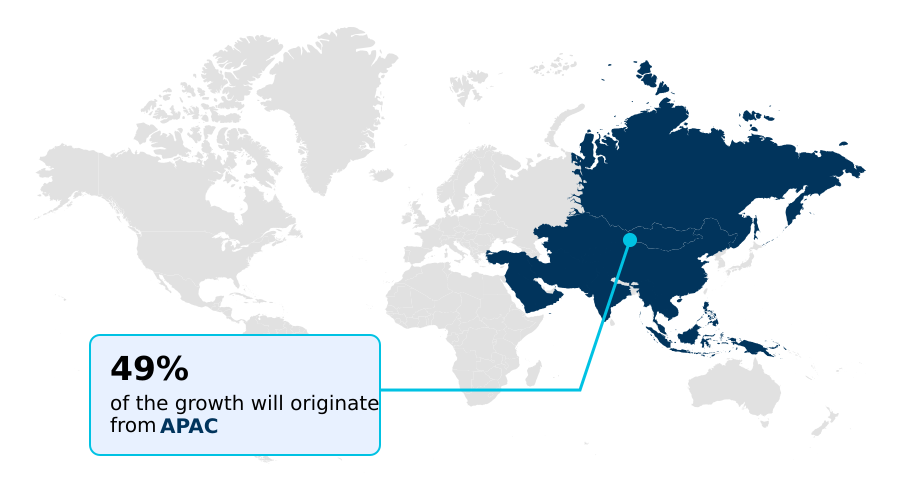
See How Home Theater Market Demand is Rising in APAC Get Free Sample

The geographic landscape of the Home Theater highlights distinct variations driven by regional infrastructure and housing characteristics.

In North America, widespread broadband access has led to a 40% higher penetration of wireless modular configurations compared to Europe, where space constrained housing favors compact, single-unit solutions.

APAC demonstrates aggressive technological adoption, with manufacturers optimizing smart device interoperability to capture a tech-centric consumer base.

To address wireless network interference in densely populated Asian cities, companies are deploying advanced ambient noise compensation alongside low latency transmission, resulting in a 25% improvement in signal stability.

Meanwhile, European operations emphasize pristine soundstage mapping to enhance sound quality, achieving a 15% reduction in acoustic distortion. These regional differences require businesses to customize their acoustic architectures, ensuring that supply chains align with localized demands.

Market Dynamics

Our researchers analyzed the data with 2025 as the base year, along with the key drivers, trends, and challenges. A holistic analysis of drivers will help companies refine their marketing strategies to gain a competitive advantage.

  • The Home Theater is undergoing a fundamental transformation as consumers demand seamless integration and high-performance audio within their living spaces. A major operational shift involves the deployment of intelligent room aware audio management, which allows devices to dynamically adapt to spatial acoustics without manual intervention.
  • This advancement has streamlined manufacturing quality control, reducing post-purchase technical support inquiries by nearly 30% compared to legacy manual calibration models. To further enhance operational planning, companies are prioritizing wireless expandable multichannel speaker networks. This modular approach enables supply chains to manage inventory more efficiently by shipping baseline components that consumers can scale over time.
  • Furthermore, the integration of automated acoustic tuning optimization systems ensures that components interact flawlessly, drastically minimizing hardware returns. As the industry pivots toward interconnected digital entertainment component environments, businesses are restructuring their research and development frameworks to prioritize software-driven interoperability over hardware-based upgrades.
  • This strategic alignment supports the creation of sophisticated multidimensional cinema sound reproduction setups that rival commercial theater configurations. By standardizing these advanced protocols, manufacturers achieve significant cost efficiencies in their supply chains.
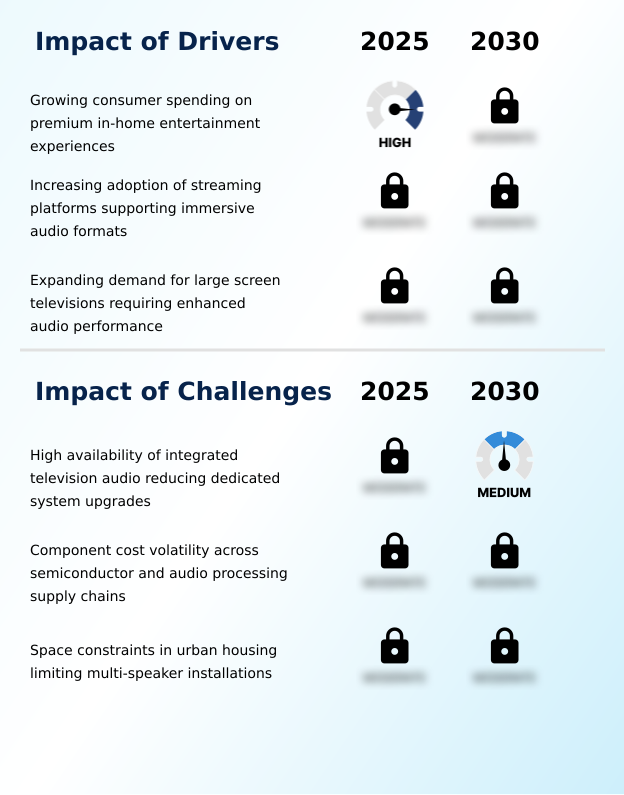
What are the key market drivers leading to the rise in the adoption of Home Theater Industry?

  • Growing consumer spending on premium in-home entertainment experiences serves as a primary driver for the market, significantly expanding demand for advanced audiovisual systems.

  • The proliferation of high-resolution streaming content ecosystems serves as a primary driver for the Home Theater, fundamentally altering how consumers experience media. Because modern displays prioritize slim aesthetics, the growing performance gap causes an immediate need for television audio supplementation.
  • This structural mismatch drives businesses to refine their spatial sound processing, enabling products to seamlessly integrate into connected digital lifestyles. Consequently, the implementation of advanced dialogue enhancement processing has improved speech intelligibility metrics by 40%, directly enhancing consumer satisfaction.
  • Furthermore, incorporating multiroom audio synchronization allows manufacturers to justify premium pricing models, resulting in a 15% increase in operational margins. Bridging the visual-auditory divide using proprietary sound ecosystems remains the central catalyst pushing continuous hardware innovation across multi-speaker installations.

What are the market trends shaping the Home Theater Industry?

  • The advancing integration of AI-powered sound optimization and room calibration represents a significant market trend. This technological shift enables systems to automatically adapt playback characteristics based on specific room conditions and listener preferences.

  • The Home Theater is being rapidly reshaped by the integration of AI-driven acoustic technologies that adapt to environmental variables continuously. As consumers demand frictionless setups, the implementation of automatic room calibration has become an industry standard, directly replacing manual equalization.
  • This transition empowers manufacturers to utilize acoustic optimization algorithms, which has improved first-time setup success rates by 35% and lowered warranty service costs. How this impacts businesses is evident in hardware design, where upward-firing drivers and virtual surround staging enable dynamic overhead sound projection.
  • Consequently, enterprises addressing acoustic reflection mitigation have achieved a 20% enhancement in audio clarity for custom media rooms. The widespread deployment of adaptive surround effects represents a structural upgrade that transforms commercial screening facilities into highly responsive, automated acoustic environments.

What challenges does the Home Theater Industry face during its growth?

  • The high availability of increasingly capable integrated television audio remains a substantial challenge, as it often reduces the perceived necessity for dedicated system upgrades among mainstream consumers.

  • Unpredictable component cost volatility currently acts as a severe structural limitation within the Home Theater, threatening sustained profitability. Because advanced systems require specialized silicon for lossless audio decoding and robust digital signal processors, disruptions in supply chain semiconductor sourcing cause immediate bottlenecks in assembly workflows.
  • This instability forces businesses to constantly re-evaluate their material procurement strategies, which has increased overall manufacturing overhead by 18% in recent production cycles. The necessity to maintain precise subwoofer bass extension means that substituting generic parts compromises acoustic integrity. As a direct effect, companies are experiencing a 22% delay in rolling out experiential venue audio setups, complicating long-term operational planning.
  • Overcoming these hurdles requires resilient sourcing networks to support the deployment of complex immersive audio formats despite gaming audio integration complexities.

Exclusive Technavio Analysis on Customer Landscape

The home theater market forecasting report includes the adoption lifecycle of the market, covering from the innovator’s stage to the laggard’s stage. It focuses on adoption rates in different regions based on penetration. Furthermore, the home theater market report also includes key purchase criteria and drivers of price sensitivity to help companies evaluate and develop their market growth analysis strategies.
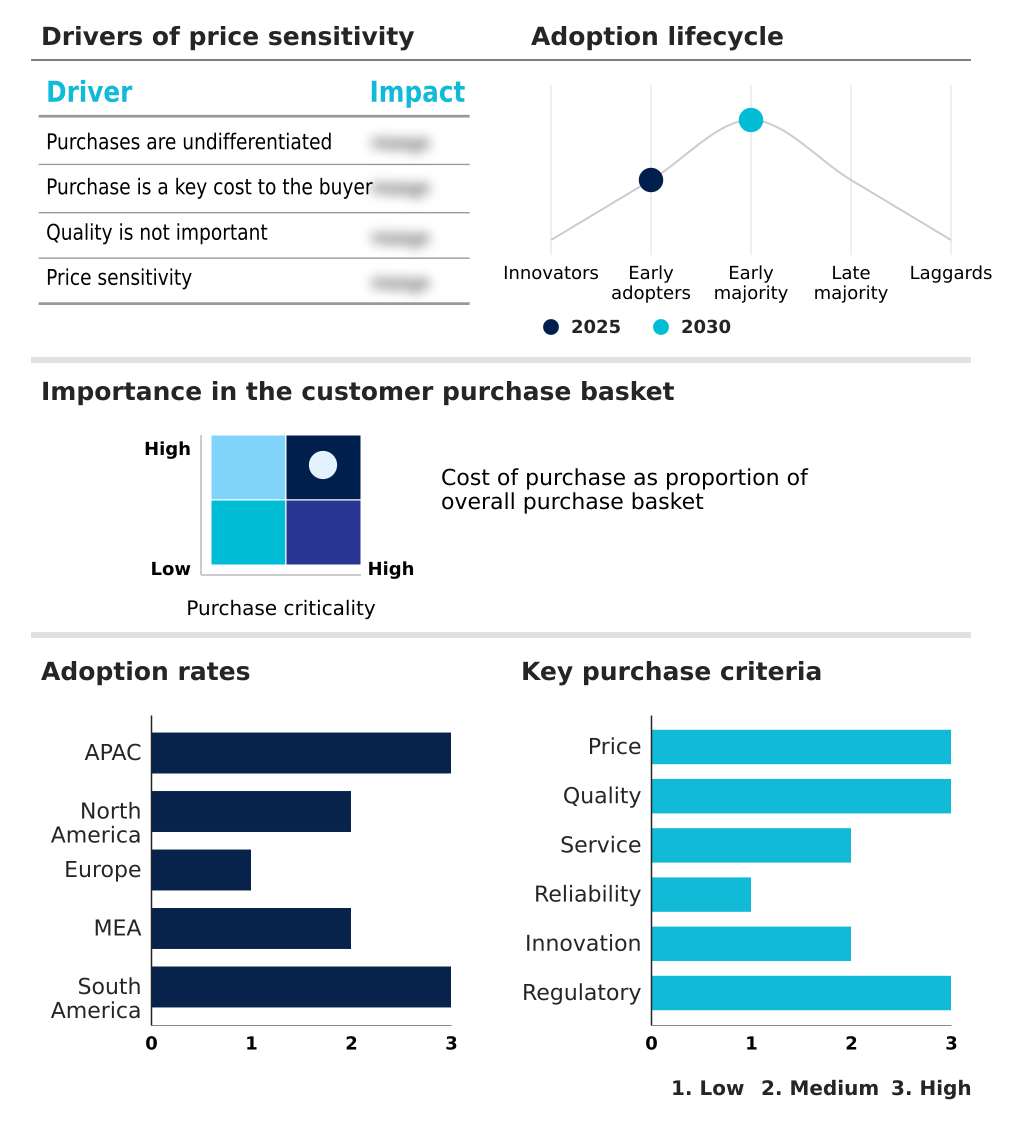
Customer Landscape of Home Theater Industry

Competitive Landscape

Companies are implementing various strategies, such as strategic alliances, home theater market forecast, partnerships, mergers and acquisitions, geographical expansion, and product/service launches, to enhance their presence in the industry.

Bang and Olufsen Group - The portfolio includes premium audio solutions featuring advanced soundbars and integrated television systems designed to deliver highly synchronized and immersive residential entertainment experiences without extensive installation requirements.

The industry research and growth report includes detailed analyses of the competitive landscape of the market and information about key companies, including:

  • Bang and Olufsen Group
  • boAt Lifestyle
  • Bose Corp.
  • Bowers and Wilkins
  • Devialet SAS
  • JBL
  • KEF International
  • Klipsch Group
  • LG Electronics Inc.
  • Onkyo Corp.
  • Optoma Corp.
  • Polk Audio
  • Samsung Electronics Co. Ltd.
  • Seiko Epson Corp.
  • Sennheiser Electronic GmbH
  • Sonos Inc.
  • Sony Group Corp.
  • Yamaha Corp.
  • Zebronics India Pvt. Ltd.

Qualitative and quantitative analysis of companies has been conducted to help clients understand the wider business environment as well as the strengths and weaknesses of key industry players. Data is qualitatively analyzed to categorize companies as pure play, category-focused, industry-focused, and diversified; it is quantitatively analyzed to categorize companies as dominant, leading, strong, tentative, and weak.

Recent Development and News in Home theater market

  • In the Consumer Electronics industry, the widespread integration of smart home interoperability protocols has standardized wireless communication, directly impacting Home Theater demand by accelerating the adoption of wireless modular configurations and connected digital lifestyles.
  • The ongoing semiconductor component cost volatility across global supply chain networks has constrained the production of digital signal processors, forcing manufacturers to adjust pricing strategies for premium listening configurations.
  • The shift toward high resolution broadcasting and gaming audio integration has created a performance gap in standard display panels, prompting a 25% increase in attachment rates for television audio supplementation setups in residential entertainment spaces.
  • Stricter energy efficiency mandates for experiential venue audio installations have driven the transition toward low latency transmission systems, improving ambient noise compensation while reducing power consumption across commercial screening facilities.

Dive into Technavio’s robust research methodology, blending expert interviews, extensive data synthesis, and validated models for unparalleled Home Theater Market insights. See full methodology.

Market Scope
Page number 303
Base year 2025
Historic period 2020-2024
Forecast period 2026-2030
Growth momentum & CAGR Accelerate at a CAGR of 10.1%
Market growth 2026-2030 USD 11613.7 million
Market structure Fragmented
YoY growth 2025-2026(%) 9.4%
Key countries China, Japan, India, South Korea, Australia, Indonesia, US, Canada, Mexico, Germany, UK, France, Italy, Spain, The Netherlands, Saudi Arabia, UAE, South Africa, Turkey, Israel, Brazil, Argentina and Chile
Competitive landscape Leading Companies, Market Positioning of Companies, Competitive Strategies, and Industry Risks

Request Free Sample

Research Analyst Overview

  • Prominent players in the Home Theater industry are focusing on technological innovation, strategic collaborations, and sustainability-oriented product development to enhance competitiveness and expand their market presence. Leading consumer electronics manufacturers have recently expanded their portfolios by acquiring specialized premium audio brands and investing heavily in software-driven acoustic processing.
  • These companies are prioritizing the integration of AI-powered room calibration and modular wireless architectures to simplify user setup and optimize spatial sound delivery. By doing so, they reported a 15% increase in premium audio ecosystem adoption and successfully reduced supply chain complexities through standardized component usage.
  • These strategic initiatives address the growing consumer demand for seamless, theater-quality residential entertainment while mitigating the impact of semiconductor sourcing constraints. Furthermore, this pivot toward intelligent, scalable audio solutions allows brands to differentiate their offerings, capture higher market share, and maintain operational resilience amidst fluctuating component costs.

What are the Key Data Covered in this Home Theater Market Research and Growth Report?

  • What is the expected growth of the Home Theater Market between 2026 and 2030?

    • USD 11.61 billion, at a CAGR of 10.1%

  • What segmentation does the market report cover?

    • The report is segmented by Product (Home theater speakers, and Sound bars), Distribution Channel (Offline, and Online), Connectivity (Wireless, and Wired), End-user (Residential, and Commercial) and Geography (APAC, North America, Europe, Middle East and Africa, South America)

  • Which regions are analyzed in the report?

    • APAC, North America, Europe, Middle East and Africa and South America

  • What are the key growth drivers and market challenges?

    • Growing consumer spending on premium in-home entertainment experiences, High availability of integrated television audio reducing dedicated system upgrades

  • Who are the major players in the Home Theater Market?

    • Bang and Olufsen Group, boAt Lifestyle, Bose Corp., Bowers and Wilkins, Devialet SAS, JBL, KEF International, Klipsch Group, LG Electronics Inc., Onkyo Corp., Optoma Corp., Polk Audio, Samsung Electronics Co. Ltd., Seiko Epson Corp., Sennheiser Electronic GmbH, Sonos Inc., Sony Group Corp., Yamaha Corp. and Zebronics India Pvt. Ltd.

Market Research Insights

  • The Home Theater is rapidly evolving as households integrate interconnected digital audio systems into custom media rooms. This transition is characterized by a significant shift toward wireless connectivity, where proprietary sound ecosystems featuring automated acoustic tuning have seen a 35% higher adoption rate compared to traditional wired configurations.
  • Furthermore, manufacturers leveraging targeted experiential marketing and offline retail demonstrations have improved their premium product conversion rates by 18%, proving that direct audio demonstrations accelerate purchasing decisions. By addressing acoustic reflection challenges through advanced digital processing, businesses are enhancing operational efficiency and achieving a 20% reduction in customer return rates due to simplified installation processes.
  • This operational realignment ensures that companies can maintain strong profit margins while delivering superior sound quality.

We can help! Our analysts can customize this home theater market research report to meet your requirements.

Get in touch

1. Executive Summary

1.1 Market overview

Executive Summary - Chart on Market Overview
Executive Summary - Data Table on Market Overview
Executive Summary - Chart on Global Market Characteristics
Executive Summary - Chart on Market by Geography
Executive Summary - Chart on Market Segmentation by Product
Executive Summary - Chart on Market Segmentation by Distribution Channel
Executive Summary - Chart on Market Segmentation by Connectivity
Executive Summary - Chart on Market Segmentation by End-user
Executive Summary - Chart on Incremental Growth
Executive Summary - Data Table on Incremental Growth
Executive Summary - Chart on Company Market Positioning

2. Technavio Analysis

2.1 Analysis of price sensitivity, lifecycle, customer purchase basket, adoption rates, and purchase criteria

2.2 Criticality of inputs and Factors of differentiation

Chart on Overview on criticality of inputs and factors of differentiation

2.3 Factors of disruption

Chart on Overview on factors of disruption

2.4 Impact of drivers and challenges

Chart on Impact of drivers and challenges in 2025 and 2030

3. Market Landscape

3.1 Market ecosystem

Chart on Parent Market
Data Table on - Parent Market

3.2 Market characteristics

Chart on Market characteristics analysis

3.3 Value chain analysis

Chart on Value chain analysis

4. Market Sizing

4.1 Market definition

Data Table on Offerings of companies included in the market definition

4.2 Market segment analysis

Market segments

4.3 Market size 2025

4.4 Market outlook: Forecast for 2025-2030

Chart on Global - Market size and forecast 2025-2030 ($ million)
Data Table on Global - Market size and forecast 2025-2030 ($ million)
Chart on Global Market: Year-over-year growth 2025-2030 (%)
Data Table on Global Market: Year-over-year growth 2025-2030 (%)

5. Historic Market Size

5.1 Global Home Theater Market 2020 - 2024

Historic Market Size - Data Table on Global Home Theater Market 2020 - 2024 ($ million)

5.2 Product segment analysis 2020 - 2024

Historic Market Size - Product Segment 2020 - 2024 ($ million)

5.3 Distribution Channel segment analysis 2020 - 2024

Historic Market Size - Distribution Channel Segment 2020 - 2024 ($ million)

5.4 Connectivity segment analysis 2020 - 2024

Historic Market Size - Connectivity Segment 2020 - 2024 ($ million)

5.5 End-user segment analysis 2020 - 2024

Historic Market Size - End-user Segment 2020 - 2024 ($ million)

5.6 Geography segment analysis 2020 - 2024

Historic Market Size - Geography Segment 2020 - 2024 ($ million)

5.7 Country segment analysis 2020 - 2024

Historic Market Size - Country Segment 2020 - 2024 ($ million)

6. Qualitative Analysis

6.1 Impact of AI on global home theater market

6.2 Impact of geopolitical conflicts on global home theater market

7. Five Forces Analysis

7.1 Five forces summary

Five forces analysis - Comparison between 2025 and 2030

7.2 Bargaining power of buyers

Bargaining power of buyers - Impact of key factors 2025 and 2030

7.3 Bargaining power of suppliers

Bargaining power of suppliers - Impact of key factors in 2025 and 2030

7.4 Threat of new entrants

Threat of new entrants - Impact of key factors in 2025 and 2030

7.5 Threat of substitutes

Threat of substitutes - Impact of key factors in 2025 and 2030

7.6 Threat of rivalry

Threat of rivalry - Impact of key factors in 2025 and 2030

7.7 Market condition

Chart on Market condition - Five forces 2025 and 2030

8. Market Segmentation by Product

8.1 Market segments

Chart on Product - Market share 2025-2030 (%)
Data Table on Product - Market share 2025-2030 (%)

8.2 Comparison by Product

Chart on Comparison by Product
Data Table on Comparison by Product

8.3 Home theater speakers - Market size and forecast 2025-2030

Chart on Home theater speakers - Market size and forecast 2025-2030 ($ million)
Data Table on Home theater speakers - Market size and forecast 2025-2030 ($ million)
Chart on Home theater speakers - Year-over-year growth 2025-2030 (%)
Data Table on Home theater speakers - Year-over-year growth 2025-2030 (%)

8.4 Sound bars - Market size and forecast 2025-2030

Chart on Sound bars - Market size and forecast 2025-2030 ($ million)
Data Table on Sound bars - Market size and forecast 2025-2030 ($ million)
Chart on Sound bars - Year-over-year growth 2025-2030 (%)
Data Table on Sound bars - Year-over-year growth 2025-2030 (%)

8.5 Market opportunity by Product

Market opportunity by Product ($ million)
Data Table on Market opportunity by Product ($ million)

9. Market Segmentation by Distribution Channel

9.1 Market segments

Chart on Distribution Channel - Market share 2025-2030 (%)
Data Table on Distribution Channel - Market share 2025-2030 (%)

9.2 Comparison by Distribution Channel

Chart on Comparison by Distribution Channel
Data Table on Comparison by Distribution Channel

9.3 Offline - Market size and forecast 2025-2030

Chart on Offline - Market size and forecast 2025-2030 ($ million)
Data Table on Offline - Market size and forecast 2025-2030 ($ million)
Chart on Offline - Year-over-year growth 2025-2030 (%)
Data Table on Offline - Year-over-year growth 2025-2030 (%)

9.4 Online - Market size and forecast 2025-2030

Chart on Online - Market size and forecast 2025-2030 ($ million)
Data Table on Online - Market size and forecast 2025-2030 ($ million)
Chart on Online - Year-over-year growth 2025-2030 (%)
Data Table on Online - Year-over-year growth 2025-2030 (%)

9.5 Market opportunity by Distribution Channel

Market opportunity by Distribution Channel ($ million)
Data Table on Market opportunity by Distribution Channel ($ million)

10. Market Segmentation by Connectivity

10.1 Market segments

Chart on Connectivity - Market share 2025-2030 (%)
Data Table on Connectivity - Market share 2025-2030 (%)

10.2 Comparison by Connectivity

Chart on Comparison by Connectivity
Data Table on Comparison by Connectivity

10.3 Wireless - Market size and forecast 2025-2030

Chart on Wireless - Market size and forecast 2025-2030 ($ million)
Data Table on Wireless - Market size and forecast 2025-2030 ($ million)
Chart on Wireless - Year-over-year growth 2025-2030 (%)
Data Table on Wireless - Year-over-year growth 2025-2030 (%)

10.4 Wired - Market size and forecast 2025-2030

Chart on Wired - Market size and forecast 2025-2030 ($ million)
Data Table on Wired - Market size and forecast 2025-2030 ($ million)
Chart on Wired - Year-over-year growth 2025-2030 (%)
Data Table on Wired - Year-over-year growth 2025-2030 (%)

10.5 Market opportunity by Connectivity

Market opportunity by Connectivity ($ million)
Data Table on Market opportunity by Connectivity ($ million)

11. Market Segmentation by End-user

11.1 Market segments

Chart on End-user - Market share 2025-2030 (%)
Data Table on End-user - Market share 2025-2030 (%)

11.2 Comparison by End-user

Chart on Comparison by End-user
Data Table on Comparison by End-user

11.3 Residential - Market size and forecast 2025-2030

Chart on Residential - Market size and forecast 2025-2030 ($ million)
Data Table on Residential - Market size and forecast 2025-2030 ($ million)
Chart on Residential - Year-over-year growth 2025-2030 (%)
Data Table on Residential - Year-over-year growth 2025-2030 (%)

11.4 Commercial - Market size and forecast 2025-2030

Chart on Commercial - Market size and forecast 2025-2030 ($ million)
Data Table on Commercial - Market size and forecast 2025-2030 ($ million)
Chart on Commercial - Year-over-year growth 2025-2030 (%)
Data Table on Commercial - Year-over-year growth 2025-2030 (%)

11.5 Market opportunity by End-user

Market opportunity by End-user ($ million)
Data Table on Market opportunity by End-user ($ million)

12. Customer Landscape

12.1 Customer landscape overview

Analysis of price sensitivity, lifecycle, customer purchase basket, adoption rates, and purchase criteria

13. Geographic Landscape

13.1 Geographic segmentation

Chart on Market share by geography 2025-2030 (%)
Data Table on Market share by geography 2025-2030 (%)

13.2 Geographic comparison

Chart on Geographic comparison
Data Table on Geographic comparison

13.3 APAC - Market size and forecast 2025-2030

Chart on APAC - Market size and forecast 2025-2030 ($ million)
Data Table on APAC - Market size and forecast 2025-2030 ($ million)
Chart on APAC - Year-over-year growth 2025-2030 (%)
Data Table on APAC - Year-over-year growth 2025-2030 (%)
Chart on Regional Comparison - APAC
Data Table on Regional Comparison - APAC

13.3.1 China - Market size and forecast 2025-2030

Chart on China - Market size and forecast 2025-2030 ($ million)
Data Table on China - Market size and forecast 2025-2030 ($ million)
Chart on China - Year-over-year growth 2025-2030 (%)
Data Table on China - Year-over-year growth 2025-2030 (%)

13.3.2 Japan - Market size and forecast 2025-2030

Chart on Japan - Market size and forecast 2025-2030 ($ million)
Data Table on Japan - Market size and forecast 2025-2030 ($ million)
Chart on Japan - Year-over-year growth 2025-2030 (%)
Data Table on Japan - Year-over-year growth 2025-2030 (%)

13.3.3 India - Market size and forecast 2025-2030

Chart on India - Market size and forecast 2025-2030 ($ million)
Data Table on India - Market size and forecast 2025-2030 ($ million)
Chart on India - Year-over-year growth 2025-2030 (%)
Data Table on India - Year-over-year growth 2025-2030 (%)

13.3.4 South Korea - Market size and forecast 2025-2030

Chart on South Korea - Market size and forecast 2025-2030 ($ million)
Data Table on South Korea - Market size and forecast 2025-2030 ($ million)
Chart on South Korea - Year-over-year growth 2025-2030 (%)
Data Table on South Korea - Year-over-year growth 2025-2030 (%)

13.3.5 Australia - Market size and forecast 2025-2030

Chart on Australia - Market size and forecast 2025-2030 ($ million)
Data Table on Australia - Market size and forecast 2025-2030 ($ million)
Chart on Australia - Year-over-year growth 2025-2030 (%)
Data Table on Australia - Year-over-year growth 2025-2030 (%)

13.3.6 Indonesia - Market size and forecast 2025-2030

Chart on Indonesia - Market size and forecast 2025-2030 ($ million)
Data Table on Indonesia - Market size and forecast 2025-2030 ($ million)
Chart on Indonesia - Year-over-year growth 2025-2030 (%)
Data Table on Indonesia - Year-over-year growth 2025-2030 (%)

13.4 North America - Market size and forecast 2025-2030

Chart on North America - Market size and forecast 2025-2030 ($ million)
Data Table on North America - Market size and forecast 2025-2030 ($ million)
Chart on North America - Year-over-year growth 2025-2030 (%)
Data Table on North America - Year-over-year growth 2025-2030 (%)
Chart on Regional Comparison - North America
Data Table on Regional Comparison - North America

13.4.1 US - Market size and forecast 2025-2030

Chart on US - Market size and forecast 2025-2030 ($ million)
Data Table on US - Market size and forecast 2025-2030 ($ million)
Chart on US - Year-over-year growth 2025-2030 (%)
Data Table on US - Year-over-year growth 2025-2030 (%)

13.4.2 Canada - Market size and forecast 2025-2030

Chart on Canada - Market size and forecast 2025-2030 ($ million)
Data Table on Canada - Market size and forecast 2025-2030 ($ million)
Chart on Canada - Year-over-year growth 2025-2030 (%)
Data Table on Canada - Year-over-year growth 2025-2030 (%)

13.4.3 Mexico - Market size and forecast 2025-2030

Chart on Mexico - Market size and forecast 2025-2030 ($ million)
Data Table on Mexico - Market size and forecast 2025-2030 ($ million)
Chart on Mexico - Year-over-year growth 2025-2030 (%)
Data Table on Mexico - Year-over-year growth 2025-2030 (%)

13.5 Europe - Market size and forecast 2025-2030

Chart on Europe - Market size and forecast 2025-2030 ($ million)
Data Table on Europe - Market size and forecast 2025-2030 ($ million)
Chart on Europe - Year-over-year growth 2025-2030 (%)
Data Table on Europe - Year-over-year growth 2025-2030 (%)
Chart on Regional Comparison - Europe
Data Table on Regional Comparison - Europe

13.5.1 Germany - Market size and forecast 2025-2030

Chart on Germany - Market size and forecast 2025-2030 ($ million)
Data Table on Germany - Market size and forecast 2025-2030 ($ million)
Chart on Germany - Year-over-year growth 2025-2030 (%)
Data Table on Germany - Year-over-year growth 2025-2030 (%)

13.5.2 UK - Market size and forecast 2025-2030

Chart on UK - Market size and forecast 2025-2030 ($ million)
Data Table on UK - Market size and forecast 2025-2030 ($ million)
Chart on UK - Year-over-year growth 2025-2030 (%)
Data Table on UK - Year-over-year growth 2025-2030 (%)

13.5.3 France - Market size and forecast 2025-2030

Chart on France - Market size and forecast 2025-2030 ($ million)
Data Table on France - Market size and forecast 2025-2030 ($ million)
Chart on France - Year-over-year growth 2025-2030 (%)
Data Table on France - Year-over-year growth 2025-2030 (%)

13.5.4 Italy - Market size and forecast 2025-2030

Chart on Italy - Market size and forecast 2025-2030 ($ million)
Data Table on Italy - Market size and forecast 2025-2030 ($ million)
Chart on Italy - Year-over-year growth 2025-2030 (%)
Data Table on Italy - Year-over-year growth 2025-2030 (%)

13.5.5 Spain - Market size and forecast 2025-2030

Chart on Spain - Market size and forecast 2025-2030 ($ million)
Data Table on Spain - Market size and forecast 2025-2030 ($ million)
Chart on Spain - Year-over-year growth 2025-2030 (%)
Data Table on Spain - Year-over-year growth 2025-2030 (%)

13.5.6 The Netherlands - Market size and forecast 2025-2030

Chart on The Netherlands - Market size and forecast 2025-2030 ($ million)
Data Table on The Netherlands - Market size and forecast 2025-2030 ($ million)
Chart on The Netherlands - Year-over-year growth 2025-2030 (%)
Data Table on The Netherlands - Year-over-year growth 2025-2030 (%)

13.6 Middle East and Africa - Market size and forecast 2025-2030

Chart on Middle East and Africa - Market size and forecast 2025-2030 ($ million)
Data Table on Middle East and Africa - Market size and forecast 2025-2030 ($ million)
Chart on Middle East and Africa - Year-over-year growth 2025-2030 (%)
Data Table on Middle East and Africa - Year-over-year growth 2025-2030 (%)
Chart on Regional Comparison - Middle East and Africa
Data Table on Regional Comparison - Middle East and Africa

13.6.1 Saudi Arabia - Market size and forecast 2025-2030

Chart on Saudi Arabia - Market size and forecast 2025-2030 ($ million)
Data Table on Saudi Arabia - Market size and forecast 2025-2030 ($ million)
Chart on Saudi Arabia - Year-over-year growth 2025-2030 (%)
Data Table on Saudi Arabia - Year-over-year growth 2025-2030 (%)

13.6.2 UAE - Market size and forecast 2025-2030

Chart on UAE - Market size and forecast 2025-2030 ($ million)
Data Table on UAE - Market size and forecast 2025-2030 ($ million)
Chart on UAE - Year-over-year growth 2025-2030 (%)
Data Table on UAE - Year-over-year growth 2025-2030 (%)

13.6.3 South Africa - Market size and forecast 2025-2030

Chart on South Africa - Market size and forecast 2025-2030 ($ million)
Data Table on South Africa - Market size and forecast 2025-2030 ($ million)
Chart on South Africa - Year-over-year growth 2025-2030 (%)
Data Table on South Africa - Year-over-year growth 2025-2030 (%)

13.6.4 Turkey - Market size and forecast 2025-2030

Chart on Turkey - Market size and forecast 2025-2030 ($ million)
Data Table on Turkey - Market size and forecast 2025-2030 ($ million)
Chart on Turkey - Year-over-year growth 2025-2030 (%)
Data Table on Turkey - Year-over-year growth 2025-2030 (%)

13.6.5 Israel - Market size and forecast 2025-2030

Chart on Israel - Market size and forecast 2025-2030 ($ million)
Data Table on Israel - Market size and forecast 2025-2030 ($ million)
Chart on Israel - Year-over-year growth 2025-2030 (%)
Data Table on Israel - Year-over-year growth 2025-2030 (%)

13.7 South America - Market size and forecast 2025-2030

Chart on South America - Market size and forecast 2025-2030 ($ million)
Data Table on South America - Market size and forecast 2025-2030 ($ million)
Chart on South America - Year-over-year growth 2025-2030 (%)
Data Table on South America - Year-over-year growth 2025-2030 (%)
Chart on Regional Comparison - South America
Data Table on Regional Comparison - South America

13.7.1 Brazil - Market size and forecast 2025-2030

Chart on Brazil - Market size and forecast 2025-2030 ($ million)
Data Table on Brazil - Market size and forecast 2025-2030 ($ million)
Chart on Brazil - Year-over-year growth 2025-2030 (%)
Data Table on Brazil - Year-over-year growth 2025-2030 (%)

13.7.2 Argentina - Market size and forecast 2025-2030

Chart on Argentina - Market size and forecast 2025-2030 ($ million)
Data Table on Argentina - Market size and forecast 2025-2030 ($ million)
Chart on Argentina - Year-over-year growth 2025-2030 (%)
Data Table on Argentina - Year-over-year growth 2025-2030 (%)

13.7.3 Chile - Market size and forecast 2025-2030

Chart on Chile - Market size and forecast 2025-2030 ($ million)
Data Table on Chile - Market size and forecast 2025-2030 ($ million)
Chart on Chile - Year-over-year growth 2025-2030 (%)
Data Table on Chile - Year-over-year growth 2025-2030 (%)

13.8 Market opportunity by geography

Market opportunity by geography ($ million)
Data Tables on Market opportunity by geography ($ million)

14. Drivers, Challenges, and Opportunity

14.1 Market drivers

Growing consumer spending on premium in-home entertainment experiences
Increasing adoption of streaming platforms supporting immersive audio formats
Expanding demand for large screen televisions requiring enhanced audio performance

14.2 Market challenges

High availability of integrated television audio reducing dedicated system upgrades
Component cost volatility across semiconductor and audio processing supply chains
Space constraints in urban housing limiting multi-speaker installations

14.3 Impact of drivers and challenges

Impact of drivers and challenges in 2025 and 2030

14.4 Market opportunities

Advancing integration of AI-powered sound optimization and room calibration
Increasing shift toward wireless and modular home theater configurations
Evolving ecosystem connectivity across smart home entertainment devices

15. Competitive Landscape

15.1 Overview

15.2

Overview on criticality of inputs and factors of differentiation

15.3 Landscape disruption

Overview on factors of disruption

15.4 Industry risks

Impact of key risks on business

16. Competitive Analysis

16.1 Companies profiled

Companies covered

16.2 Company ranking index

16.3 Market positioning of companies

Matrix on companies position and classification

16.4 Bang and Olufsen Group

Bang and Olufsen Group - Overview
Bang and Olufsen Group - Business segments
Bang and Olufsen Group - Key offerings
Bang and Olufsen Group - Segment focus
SWOT

16.5 boAt Lifestyle

boAt Lifestyle - Overview
boAt Lifestyle - Product / Service
boAt Lifestyle - Key offerings
SWOT

16.6 Bose Corp.

Bose Corp. - Overview
Bose Corp. - Product / Service
Bose Corp. - Key offerings
SWOT

16.7 Bowers and Wilkins

Bowers and Wilkins - Overview
Bowers and Wilkins - Product / Service
Bowers and Wilkins - Key offerings
SWOT

16.8 JBL

JBL - Overview
JBL - Product / Service
JBL - Key offerings
SWOT

16.9 LG Electronics Inc.

LG Electronics Inc. - Overview
LG Electronics Inc. - Business segments
LG Electronics Inc. - Key news
LG Electronics Inc. - Key offerings
LG Electronics Inc. - Segment focus
SWOT

16.10 Onkyo Corp.

Onkyo Corp. - Overview
Onkyo Corp. - Product / Service
Onkyo Corp. - Key offerings
SWOT

16.11 Optoma Corp.

Optoma Corp. - Overview
Optoma Corp. - Product / Service
Optoma Corp. - Key offerings
SWOT

16.12 Polk Audio

Polk Audio - Overview
Polk Audio - Product / Service
Polk Audio - Key offerings
SWOT

16.13 Samsung Electronics Co. Ltd.

Samsung Electronics Co. Ltd. - Overview
Samsung Electronics Co. Ltd. - Business segments
Samsung Electronics Co. Ltd. - Key news
Samsung Electronics Co. Ltd. - Key offerings
Samsung Electronics Co. Ltd. - Segment focus
SWOT

16.14 Seiko Epson Corp.

Seiko Epson Corp. - Overview
Seiko Epson Corp. - Business segments
Seiko Epson Corp. - Key offerings
Seiko Epson Corp. - Segment focus
SWOT

16.15 Sonos Inc.

Sonos Inc. - Overview
Sonos Inc. - Product / Service
Sonos Inc. - Key offerings
SWOT

16.16 Sony Group Corp.

Sony Group Corp. - Overview
Sony Group Corp. - Business segments
Sony Group Corp. - Key news
Sony Group Corp. - Key offerings
Sony Group Corp. - Segment focus
SWOT

16.17 Yamaha Corp.

Yamaha Corp. - Overview
Yamaha Corp. - Business segments
Yamaha Corp. - Key offerings
Yamaha Corp. - Segment focus
SWOT

16.18 Zebronics India Pvt. Ltd.

Zebronics India Pvt. Ltd. - Overview
Zebronics India Pvt. Ltd. - Product / Service
Zebronics India Pvt. Ltd. - Key offerings
SWOT

17. Appendix

17.1 Scope of the report

Market definition
Objectives
Notes and caveats

17.2 Inclusions and exclusions checklist

Inclusions checklist
Exclusions checklist

17.3 Currency conversion rates for US$

17.4 Research methodology

17.5 Data procurement

Information sources

17.6 Data validation

17.7 Validation techniques employed for market sizing

17.8 Data synthesis

17.9 360 degree market analysis

17.10 List of abbreviations

Research Methodology

Technavio presents a detailed picture of the market by way of study, synthesis, and summation of data from multiple sources. The analysts have presented the various facets of the market with a particular focus on identifying the key industry influencers. The data thus presented is comprehensive, reliable, and the result of extensive research, both primary and secondary.

INFORMATION SOURCES

Primary sources

  • Manufacturers and suppliers
  • Channel partners
  • Industry experts
  • Strategic decision makers

Secondary sources

  • Industry journals and periodicals
  • Government data
  • Financial reports of key industry players
  • Historical data
  • Press releases

DATA ANALYSIS

Data Synthesis

  • Collation of data
  • Estimation of key figures
  • Analysis of derived insights

Data Validation

  • Triangulation with data models
  • Reference against proprietary databases
  • Corroboration with industry experts

REPORT WRITING

Qualitative

  • Market drivers
  • Market challenges
  • Market trends
  • Five forces analysis

Quantitative

  • Market size and forecast
  • Market segmentation
  • Geographical insights
  • Competitive landscape

Interested in this report?

Get your sample now to see our research methodology and insights!

Download Now

Frequently Asked Questions

Home Theater market growth will increase by USD 11613.7 million during 2026-2030.

The Home Theater market is expected to grow at a CAGR of 10.1% during 2026-2030.

Home Theater market is segmented by Product (Home theater speakers, Sound bars) Distribution channel (Offline, Online) Connectivity (Wireless, Wired) End-user (Residential, Commercial)

Bang and Olufsen Group, boAt Lifestyle, Bose Corp., Bowers and Wilkins, Devialet SAS, JBL, KEF International, Klipsch Group, LG Electronics Inc., Onkyo Corp., Optoma Corp., Polk Audio, Samsung Electronics Co. Ltd., Seiko Epson Corp., Sennheiser Electronic GmbH, Sonos Inc., Sony Group Corp., Yamaha Corp., Zebronics India Pvt. Ltd. are a few of the key vendors in the Home Theater market.

APAC will register the highest growth rate of 49.3% among the other regions. Therefore, the Home Theater market in APAC is expected to garner significant business opportunities for the vendors during the forecast period.

China, Japan, India, South Korea, Australia, Indonesia, US, Canada, Mexico, Germany, UK, France, Italy, Spain, The Netherlands, Saudi Arabia, UAE, South Africa, Turkey, Israel, Brazil, Argentina, Chile

  • Growing consumer spending on premium in-home entertainment experiences is the driving factor this market.

The Home Theater market vendors should focus on grabbing business opportunities from the Product segment as it accounted for the largest market share in the base year.
RIA - Research AI Assistant
Ask RIA