
AI In Nanotechnology Market Analysis, Size, and Forecast 2026-2030: North America (US, Canada, and Mexico), APAC (China, Japan, and India), Europe (Germany, UK, and France), Middle East and Africa (Saudi Arabia, UAE, and South Africa), South America (Brazil, Argentina, and Chile), and Rest of World (ROW)

AI In Nanotechnology Market Analysis, Size, and Forecast 2026-2030:
North America (US, Canada, and Mexico), APAC (China, Japan, and India), Europe (Germany, UK, and France), Middle East and Africa (Saudi Arabia, UAE, and South Africa), South America (Brazil, Argentina, and Chile), and Rest of World (ROW)

Published: Nov 2026 293 Pages SKU: IRTNTR81027

Market Overview at a Glance

$19.48 B
Market Opportunity
22.9%
CAGR 2025 - 2030
34%
APAC Growth
$3.55 B
Machine learning segment 2024

Ai In Nanotechnology Market Size 2026-2030

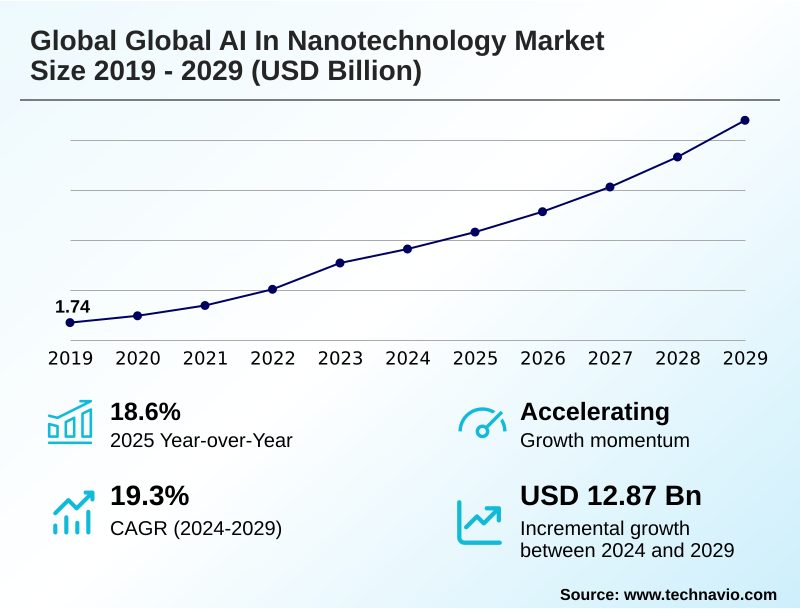
The ai in nanotechnology market size is valued to increase by USD 19.48 billion, at a CAGR of 22.9% from 2025 to 2030. Accelerated discovery of high-performance engineered nanomaterials will drive the ai in nanotechnology market.

Major Market Trends & Insights

  • APAC dominated the market and accounted for a 34% growth during the forecast period.
  • By Technology - Machine learning segment was valued at USD 3.55 billion in 2024
  • By Application - Nanoelectronics and optoelectronics segment accounted for the largest market revenue share in 2024

Market Size & Forecast

  • Market Opportunities: USD 27.85 billion
  • Market Future Opportunities: USD 19.48 billion
  • CAGR from 2025 to 2030 : 22.9%

Market Summary

  • The AI In Nanotechnology Market operates as a highly specialized computational domain where algorithmic models and nanoscale physical sciences intersect to accelerate material discovery. Artificial intelligence drastically transforms traditional laboratory environments by shifting workflows from empirical trial-and-error to predictive virtual screening.
  • The non-negotiable business need to lower research outlays while maintaining competitive technology pipelines acts as the primary market driver, compelling semiconductor foundries and biopharmaceutical developers to invest heavily in structural simulation software.
  • Within semiconductor fabrication, process engineers utilize physics-informed neural networks to analyze real-time atomic force microscopy data, yielding a 40% improvement in sub-nanometer defect detection compared to legacy optical metrology systems. This operational transition ensures that complex integrated circuits maintain optimal thermal dissipation patterns.
  • However, severe data quality inconsistencies and experimental data scarcity continue to restrict algorithmic accuracy, requiring extensive physical validation cycles to prevent model overfitting. Addressing these barriers involves deploying standardized data taxonomies and automated spectral analysis tools across testing facilities, ensuring that predictive algorithms can reliably support sustainable nanomanufacturing and advanced targeted therapeutics.

What will be the Size of the Ai In Nanotechnology Market during the forecast period?
Get Key Insights on Market Forecast (PDF) Get Free Sample

How is the Ai In Nanotechnology Market Segmented?

The ai in nanotechnology industry research report provides comprehensive data (region-wise segment analysis), with forecasts and estimates in "USD million" for the period 2026-2030, as well as historical data from 2020-2024 for the following segments.

  • Technology
    • Machine learning
    • Deep learning
    • Natural language processing
  • Application
    • Nanoelectronics and optoelectronics
    • Nanomedicine and drug delivery
    • Nanosensors and nanodevices
  • End-user
    • Electronics and semiconductor
    • Healthcare and biomedical
    • Energy and environment
  • Geography
    • North America
      • US
      • Canada
      • Mexico
    • APAC
      • China
      • Japan
      • India
      • South Korea
      • Australia
      • Indonesia
    • Europe
      • Germany
      • UK
      • France
      • Italy
      • Spain
      • The Netherlands
    • Middle East and Africa
      • Saudi Arabia
      • UAE
      • South Africa
      • Israel
      • Turkey
    • South America
      • Brazil
      • Argentina
      • Chile

By Technology Insights

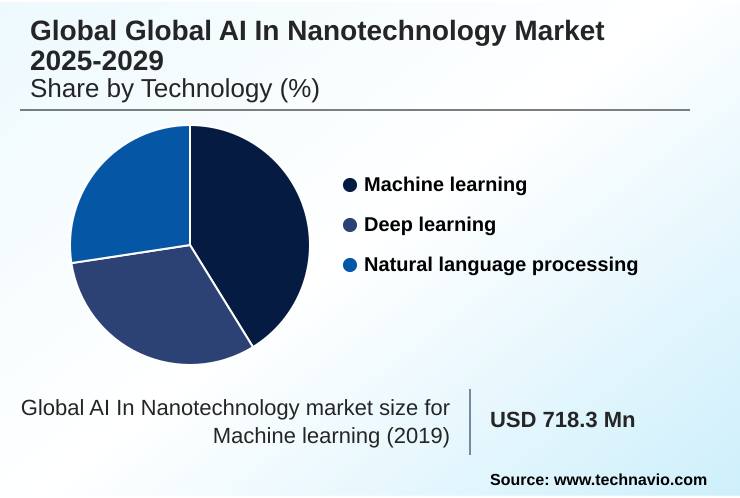
The machine learning segment is estimated to witness significant growth during the forecast period.

The machine learning algorithms segment commands the primary operational footprint within the Global AI In Nanotechnology Market 2026-2030 by mapping non-linear relationships between synthesis parameters and physical attributes.

Deploying these algorithms allows laboratories to execute highly accurate predictive materials modeling, bypassing traditional empirical trials to map quantum confinement effects. By integrating computational chemistry software, manufacturers have enhanced continuous closed-loop experimentation, reducing physical prototyping waste by 35%.

This technology heavily optimizes real-time process control and nanoscale surface characterization for advanced semiconductor layouts. Industrial operators continuously deploy explainable artificial intelligence frameworks to interpret feature importance when analyzing high-dimensional atomic force microscopy datasets.

This computational transition ensures that complex data streams reliably support accurate molecular dynamics simulations, streamlining sustainable chemical engineering workflows across global fabrication facilities.
Get Free Sample

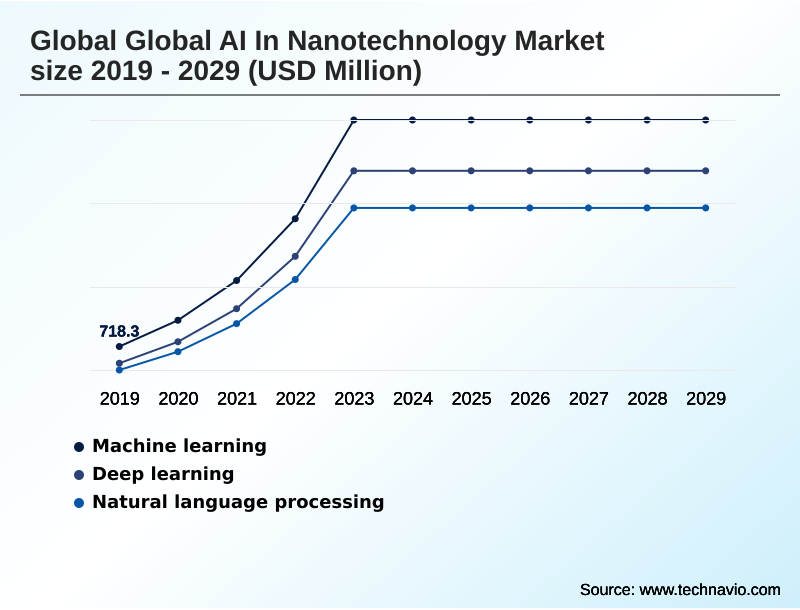
The Machine learning segment was valued at USD 3.55 billion in 2024 and showed a gradual increase during the forecast period.
Get Free Sample

Regional Analysis

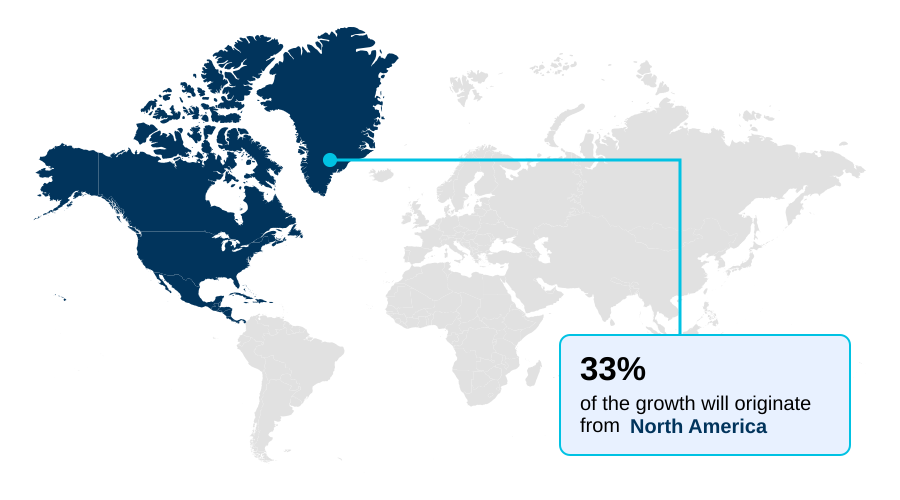
APAC is estimated to contribute 34% to the growth of the global market during the forecast period.Technavio’s analysts have elaborately explained the regional trends and drivers that shape the market during the forecast period.
See How Ai In Nanotechnology Market Demand is Rising in APAC Get Free Sample

The Global AI In Nanotechnology Market 2026-2030 exhibits highly stratified geographical development, driven by localized industrial policies and expanding computational nanotechnology research.

North America maintains a dominant operational footprint, utilizing multi-scale atomistic simulations to accelerate targeted nanomedicine delivery, improving drug encapsulation efficiency by over 30%.

Conversely, APAC demonstrates aggressive expansion fueled by sovereign semiconductor manufacturing, where foundries optimize atomic layer deposition processes, achieving a 25% faster reduction in defect rates compared to North American facilities.

European laboratories heavily enforce chemical safety, prioritizing autonomous robotic laboratories equipped with automated spectral analysis tools to design eco-friendly smart nanoscale bio-carriers. Throughout the Middle East, expanding clean water initiatives drive the procurement of AI-modeled functionalized magnetic adsorbents.

Simultaneously, industrial sectors globally deploy advanced structural health sensing networks and real-time characterization instruments to enhance environmental micro-pollutant monitoring, ensuring compliance with strict regional sustainability standards.

Market Dynamics

Our researchers analyzed the data with 2025 as the base year, along with the key drivers, trends, and challenges. A holistic analysis of drivers will help companies refine their marketing strategies to gain a competitive advantage.

  • The integration of algorithmic intelligence into physical material science has completely restructured developmental pipelines across the AI In Nanotechnology Market. Research organizations heavily utilize a cloud-native digital materials research platform to execute complex deep learning molecular dynamics simulations, enabling a transition away from costly manual experimentation.
  • To support clean energy and advanced semiconductor mandates, engineers rely on machine learning-guided density functional theory to discover optimal catalytic surfaces, accelerating deployment timelines by approximately 35% compared to legacy computational methods. This shift is deeply supported by physics-constrained artificial intelligence modules that ensure generated molecular configurations obey real-world thermodynamic laws.
  • In clinical environments, optimizing targeted rna vaccine delivery architectures demands extraordinary precision, prompting developers to deploy ai-driven computer vision models and deep learning-enhanced super-resolution microscopy for atomic-level characterization. Once candidates are identified, laboratories utilize computational inverse design blueprint generation paired with generative neural networks for nanostructures to output highly precise molecular specifications.
  • Manufacturing scale-up requires dynamic process analytical technology integration and real-time nanosensor signal processing software to maintain absolute batch consistency. To permanently compress physical research timelines, commercial entities increasingly invest in ai-powered self-driving nanotechnology laboratories equipped with automated robotic liquid handler integration.
  • These closed-loop systems function seamlessly alongside automated high-throughput nanoparticle synthesis platforms, allowing research teams to evaluate millions of theoretical combinations rapidly. Furthermore, automated generative design networks integration directly into semiconductor workflows ensures flawless extreme ultraviolet lithography masks, solidifying a highly efficient, predictive industrial ecosystem.
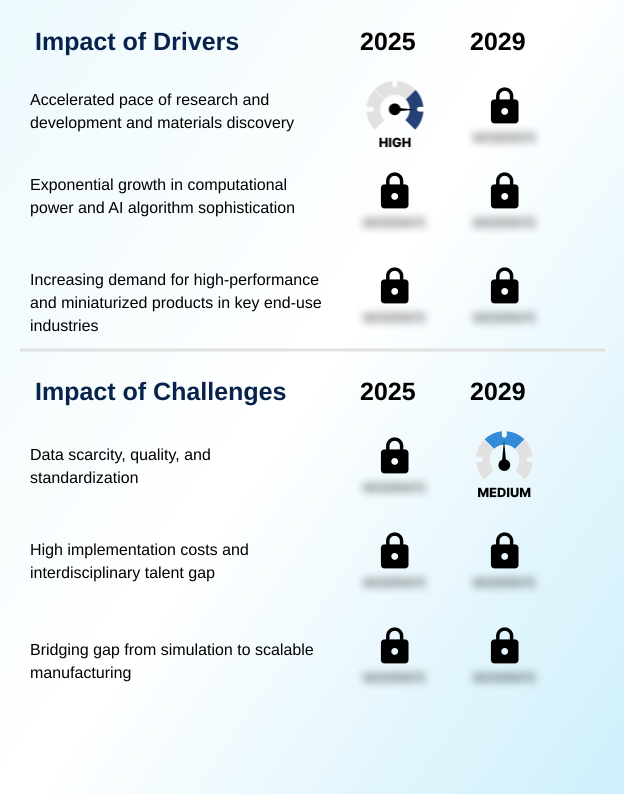
What are the key market drivers leading to the rise in the adoption of Ai In Nanotechnology Industry?

  • The accelerated discovery of high-performance engineered nanomaterials acts as a primary macroeconomic driver, compelling industrial conglomerates to adopt artificial intelligence platforms to shorten research timelines and optimize molecular configurations.

  • The non-negotiable business imperative to compress material commercialization cycles acts as a powerful macroeconomic driver for the Global AI In Nanotechnology Market 2026-2030.
  • Implementing high-throughput virtual screening paired with generative adversarial networks allows manufacturers to evaluate millions of molecular combinations instantly, accelerating patent filings by 45%.
  • In semiconductor fabrication, the relentless drive toward gate-all-around nanosheet architectures compels foundries to integrate algorithmic optimization for extreme ultraviolet lithography, cutting atomic-level lattice defect rates by over 30%.
  • Furthermore, the rapid expansion of targeted oncology therapies drives intense demand for AI-optimized lipid nanoparticle formulation, improving mRNA encapsulation efficiency by 25%. Beyond biomedicine, algorithms are optimizing solid-state electrolyte interfaces to support zero-emission carbon dioxide reduction technologies.
  • Advanced natural language processing tools, utilizing entity recognition algorithms and automated literature extraction, further streamline regulatory compliance by parsing dense chemical safety data.

What are the market trends shaping the Ai In Nanotechnology Industry?

  • The commercial development of closed-loop autonomous robotic nanotechnology laboratories represents a defining structural trend. These integrated platforms seamlessly connect generative design software with automated synthesis modules to accelerate nanomaterial discovery without continuous human intervention.

  • The widespread industry migration toward physics-informed neural networks constitutes a defining technological trend within the Global AI In Nanotechnology Market 2026-2030. Modern AI architectures now incorporate rigid thermodynamic stability criteria directly into neural network loss functions, reducing required empirical training data volumes by up to 60%.
  • This structural shift enables high-speed, quantum-accurate simulations of complex electron transport in transition metal dichalcogenides. Concurrently, environmental sustainability mandates accelerate the adoption of biomimetic nanostructure design using advanced inverse design methodologies, lowering subsequent clinical trial failure rates by 28%. These algorithms empower sensors to achieve unprecedented single-molecule sensitivity and trace analyte detection, fundamentally transforming environmental monitoring.
  • Furthermore, integration of super-resolution image reconstruction accelerates the discovery of optimal catalysts for green hydrogen water electrolyzers, driving the clean energy transition and supporting the development of eco-friendly packaging materials.

What challenges does the Ai In Nanotechnology Industry face during its growth?

  • Data quality inconsistencies and experimental data scarcity across nanoscale datasets create a structural challenge, leading to model overfitting and hindering the widespread industrial deployment of predictive simulation algorithms.

  • The acute global deficit of hybrid professionals possessing expertise in both quantum physics and advanced deep learning models creates a severe structural bottleneck for the Global AI In Nanotechnology Market 2026-2030. Developing precise quantitative structure-activity relationship algorithms requires sophisticated knowledge, yet the prevailing interdisciplinary skills gap inflates specialized recruitment expenditures by nearly 35%.
  • Furthermore, managing the transition from simulated density functional theory configurations to scalable automated chemical synthesis introduces substantial physical complexities. Models often fail to account for structural measurement noise, leading to unexpected material agglomeration that can drop manufacturing yield rates by up to 20%.
  • The lack of standardized data forces reliance on siloed proprietary industrial data, which severely limits accurate nanoparticle bio-distribution prediction and cell-membrane permeability modeling. These limitations compel equipment fabricators to invest heavily in advanced dynamic process analytical technology to enhance nanoscale defect detection and physical verification.

Exclusive Technavio Analysis on Customer Landscape

The ai in nanotechnology market forecasting report includes the adoption lifecycle of the market, covering from the innovator’s stage to the laggard’s stage. It focuses on adoption rates in different regions based on penetration. Furthermore, the ai in nanotechnology market report also includes key purchase criteria and drivers of price sensitivity to help companies evaluate and develop their market growth analysis strategies.
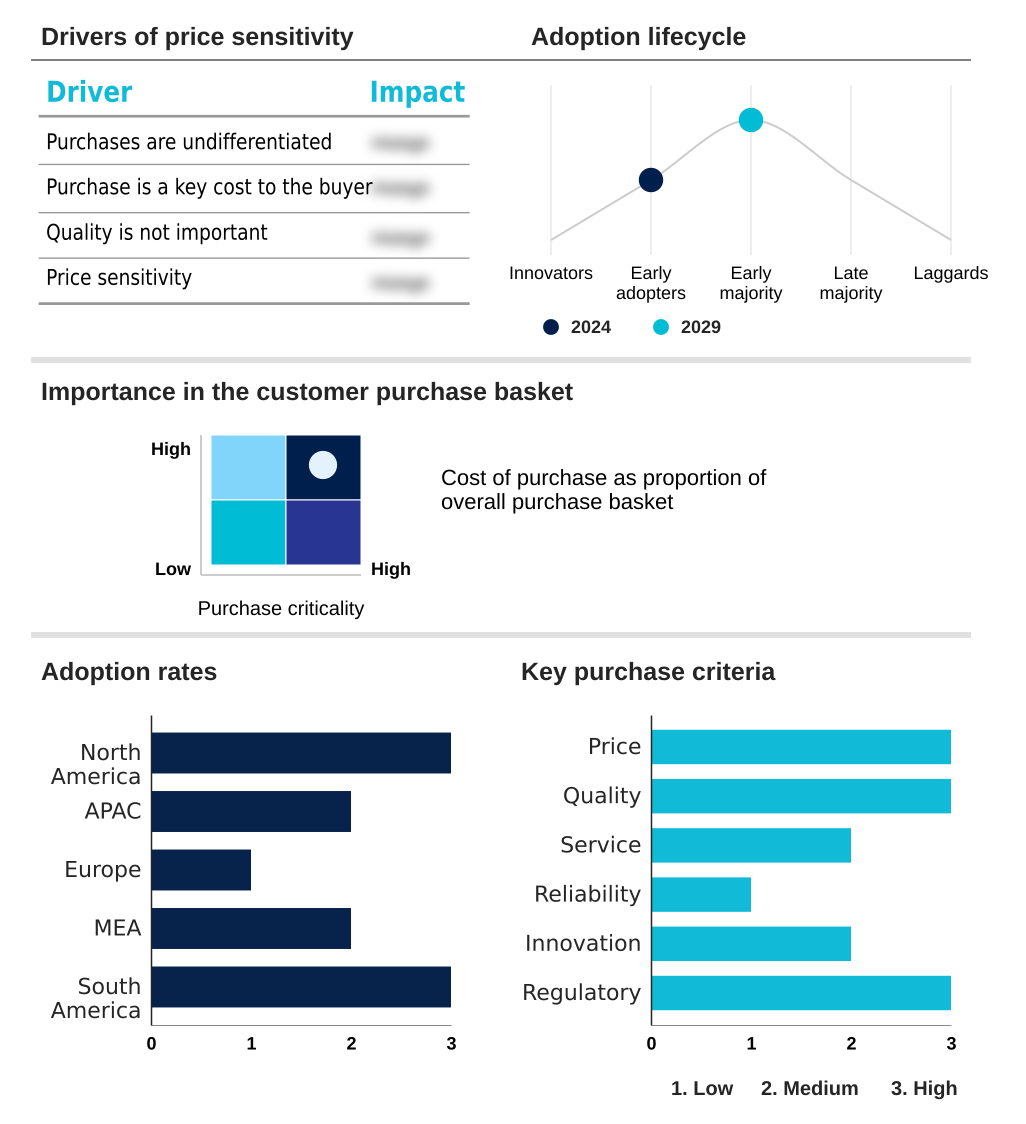
Customer Landscape of Ai In Nanotechnology Industry

Competitive Landscape

Companies are implementing various strategies, such as strategic alliances, ai in nanotechnology market forecast, partnerships, mergers and acquisitions, geographical expansion, and product/service launches, to enhance their presence in the industry.

Accelerated Materials Ltd. - The unified segment provides patented annular microreactors integrated with automated artificial intelligence software to accelerate nanomaterial discovery and streamline laboratory-to-factory scale-up operations.

The industry research and growth report includes detailed analyses of the competitive landscape of the market and information about key companies, including:

  • Accelerated Materials Ltd.
  • Atinary Technologies Inc.
  • Camtek Ltd.
  • Citrine Informatics Inc.
  • Cusp AI Ltd
  • Dunia Innovations GmbH
  • Entalpic SAS
  • Geinforce Technology Pvt Ltd
  • InverseNano Inc.
  • Kebotix Inc.
  • Mana Bio Ltd.
  • Mat3ra Inc.
  • Mater AI Ltd
  • MaterialsZone Ltd.
  • Matlantis Corp
  • METiS Therapeutics Inc.
  • NanoCure AI Co
  • Nova Ltd.
  • Raith GmbH
  • XtalPi Holdings Ltd

Qualitative and quantitative analysis of companies has been conducted to help clients understand the wider business environment as well as the strengths and weaknesses of key industry players. Data is qualitatively analyzed to categorize companies as pure play, category-focused, industry-focused, and diversified; it is quantitatively analyzed to categorize companies as dominant, leading, strong, tentative, and weak.

Recent Development and News in Ai in nanotechnology market

  • In the Biotechnology industry, the structural transition toward personalized targeted oncology therapies mandated stricter purity standards for lipid nanoparticle formulations, directly increasing demand in the Global AI In Nanotechnology Market 2026-2030 by forcing a 40% reduction in tolerable batch-to-batch structural variations using real-time characterization instruments.
  • The widespread adoption of continuous closed-loop experimentation within pharmaceutical scale-up facilities lowered raw material waste margins by 25%, simultaneously driving the deployment of machine learning-guided density functional theory tools to model targeted nanomedicine delivery parameters.
  • Strict regulatory frameworks concerning synthetic inorganic nanoparticle toxicity accelerated the shift toward biomimetic nanostructure design, generating a 30% surge in procurement of computational chemistry software capable of predicting nanoparticle bio-distribution metrics.
  • The integration of automated robotic liquid handler integration into biopharmaceutical research pipelines increased daily sample throughput by up to 500%, fueling the operational necessity for deep learning models to process the resulting high-dimensional data streams for smart nanoscale bio-carriers.

Dive into Technavio’s robust research methodology, blending expert interviews, extensive data synthesis, and validated models for unparalleled Ai In Nanotechnology Market insights. See full methodology.

Market Scope
Page number 293
Base year 2025
Historic period 2020-2024
Forecast period 2026-2030
Growth momentum & CAGR Accelerate at a CAGR of 22.9%
Market growth 2026-2030 USD 19482.4 million
Market structure Fragmented
YoY growth 2025-2026(%) 19.8%
Key countries US, Canada, Mexico, China, Japan, India, South Korea, Australia, Indonesia, Germany, UK, France, Italy, Spain, The Netherlands, Saudi Arabia, UAE, South Africa, Israel, Turkey, Brazil, Argentina and Chile
Competitive landscape Leading Companies, Market Positioning of Companies, Competitive Strategies, and Industry Risks

Request Free Sample

Research Analyst Overview

  • The structural progression of the Global AI In Nanotechnology Market 2026-2030 is defined by the rapid convergence of predictive algorithmic architectures and atomic-scale fabrication processes. Advanced manufacturing entities aggressively deploy autonomous robotic laboratories to eliminate manual processing constraints, achieving a 40% reduction in research and development cycle times for high-performance engineered materials.
  • Utilizing quantitative structure-activity relationship models enables researchers to predict thermodynamic stability before physical synthesis, drastically lowering resource waste. In semiconductor fabrication, automated algorithms continuously optimize atomic layer deposition parameters, ensuring sub-nanometer precision across high-density memory architectures.
  • Similarly, the biopharmaceutical sector relies on complex multi-scale atomistic simulations and molecular dynamics simulations to engineer precision nanocarriers for targeted nanomedicine delivery, yielding unprecedented improvements in intracellular therapeutic payload release. Continuous integration of real-time machine learning filters into structural health sensing networks provides highly accurate defect recognition, protecting critical aerospace and industrial infrastructure.
  • As precision engineering standards rise, the reliance on high-throughput virtual screening and generative inverse design solidifies a highly optimized, data-driven industrial operating environment.

What are the Key Data Covered in this Ai In Nanotechnology Market Research and Growth Report?

  • What is the expected growth of the Ai In Nanotechnology Market between 2026 and 2030?

    • USD 19.48 billion, at a CAGR of 22.9%

  • What segmentation does the market report cover?

    • The report is segmented by Technology (Machine learning, Deep learning, and Natural language processing), Application (Nanoelectronics and optoelectronics, Nanomedicine and drug delivery, and Nanosensors and nanodevices), End-user (Electronics and semiconductor, Healthcare and biomedical, and Energy and environment) and Geography (North America, APAC, Europe, Middle East and Africa, South America)

  • Which regions are analyzed in the report?

    • North America, APAC, Europe, Middle East and Africa and South America

  • What are the key growth drivers and market challenges?

    • Accelerated discovery of high-performance engineered nanomaterials, Data quality inconsistencies and experimental data scarcity

  • Who are the major players in the Ai In Nanotechnology Market?

    • Accelerated Materials Ltd., Atinary Technologies Inc., Camtek Ltd., Citrine Informatics Inc., Cusp AI Ltd, Dunia Innovations GmbH, Entalpic SAS, Geinforce Technology Pvt Ltd, InverseNano Inc., Kebotix Inc., Mana Bio Ltd., Mat3ra Inc., Mater AI Ltd, MaterialsZone Ltd., Matlantis Corp, METiS Therapeutics Inc., NanoCure AI Co, Nova Ltd., Raith GmbH and XtalPi Holdings Ltd

Market Research Insights

  • The Global AI In Nanotechnology Market 2026-2030 represents a transformative operational shift toward predictive materials modeling and automated nanoscale characterization. By implementing continuous closed-loop experimentation, industrial laboratories have reduced physical prototyping costs by 45%, enabling rapid deployment of targeted oncology therapies.
  • Access to curated, proprietary industrial data allows algorithmic models to design highly effective smart nanoscale bio-carriers, improving cellular uptake rates by over 30% compared to traditional formulation methods. Furthermore, advanced pattern recognition integrated into environmental micro-pollutant monitoring sensors has enhanced trace analyte detection accuracy by 22%, significantly lowering compliance penalty risks for chemical manufacturing facilities.
  • These predictive capabilities allow enterprises to systematically optimize complex thermodynamic parameters without relying on exhaustive empirical testing.

We can help! Our analysts can customize this ai in nanotechnology market research report to meet your requirements.

Get in touch

1. Executive Summary

1.1 Market overview

Executive Summary - Chart on Market Overview
Executive Summary - Data Table on Market Overview
Executive Summary - Chart on Global Market Characteristics
Executive Summary - Chart on Market by Geography
Executive Summary - Chart on Market Segmentation by Technology
Executive Summary - Chart on Market Segmentation by Application
Executive Summary - Chart on Market Segmentation by End-user
Executive Summary - Chart on Incremental Growth
Executive Summary - Data Table on Incremental Growth
Executive Summary - Chart on Company Market Positioning

2. Technavio Analysis

2.1 Analysis of price sensitivity, lifecycle, customer purchase basket, adoption rates, and purchase criteria

2.2 Criticality of inputs and Factors of differentiation

Chart on Overview on criticality of inputs and factors of differentiation

2.3 Factors of disruption

Chart on Overview on factors of disruption

2.4 Impact of drivers and challenges

Chart on Impact of drivers and challenges in 2025 and 2030

3. Market Landscape

3.1 Market ecosystem

Chart on Parent Market
Data Table on - Parent Market

3.2 Market characteristics

Chart on Market characteristics analysis

3.3 Value chain analysis

Chart on Value chain analysis

4. Market Sizing

4.1 Market definition

Data Table on Offerings of companies included in the market definition

4.2 Market segment analysis

Market segments

4.3 Market size 2025

4.4 Market outlook: Forecast for 2025-2030

Chart on Global - Market size and forecast 2025-2030 ($ million)
Data Table on Global - Market size and forecast 2025-2030 ($ million)
Chart on Global Market: Year-over-year growth 2025-2030 (%)
Data Table on Global Market: Year-over-year growth 2025-2030 (%)

5. Historic Market Size

5.1 Global AI In Nanotechnology Market 2020 - 2024

Historic Market Size - Data Table on Global AI In Nanotechnology Market 2020 - 2024 ($ million)

5.2 Technology segment analysis 2020 - 2024

Historic Market Size - Technology Segment 2020 - 2024 ($ million)

5.3 Application segment analysis 2020 - 2024

Historic Market Size - Application Segment 2020 - 2024 ($ million)

5.4 End-user segment analysis 2020 - 2024

Historic Market Size - End-user Segment 2020 - 2024 ($ million)

5.5 Geography segment analysis 2020 - 2024

Historic Market Size - Geography Segment 2020 - 2024 ($ million)

5.6 Country segment analysis 2020 - 2024

Historic Market Size - Country Segment 2020 - 2024 ($ million)

6. Qualitative Analysis

6.1 Impact of AI on global AI in nanotechnology market

6.2 Impact of geopolitical conflicts on global AI in nanotechnology market

7. Five Forces Analysis

7.1 Five forces summary

Five forces analysis - Comparison between 2025 and 2030

7.2 Bargaining power of buyers

Bargaining power of buyers - Impact of key factors 2025 and 2030

7.3 Bargaining power of suppliers

Bargaining power of suppliers - Impact of key factors in 2025 and 2030

7.4 Threat of new entrants

Threat of new entrants - Impact of key factors in 2025 and 2030

7.5 Threat of substitutes

Threat of substitutes - Impact of key factors in 2025 and 2030

7.6 Threat of rivalry

Threat of rivalry - Impact of key factors in 2025 and 2030

7.7 Market condition

Chart on Market condition - Five forces 2025 and 2030

8. Market Segmentation by Technology

8.1 Market segments

Chart on Technology - Market share 2025-2030 (%)
Data Table on Technology - Market share 2025-2030 (%)

8.2 Comparison by Technology

Chart on Comparison by Technology
Data Table on Comparison by Technology

8.3 Machine learning - Market size and forecast 2025-2030

Chart on Machine learning - Market size and forecast 2025-2030 ($ million)
Data Table on Machine learning - Market size and forecast 2025-2030 ($ million)
Chart on Machine learning - Year-over-year growth 2025-2030 (%)
Data Table on Machine learning - Year-over-year growth 2025-2030 (%)

8.4 Deep learning - Market size and forecast 2025-2030

Chart on Deep learning - Market size and forecast 2025-2030 ($ million)
Data Table on Deep learning - Market size and forecast 2025-2030 ($ million)
Chart on Deep learning - Year-over-year growth 2025-2030 (%)
Data Table on Deep learning - Year-over-year growth 2025-2030 (%)

8.5 Natural language processing - Market size and forecast 2025-2030

Chart on Natural language processing - Market size and forecast 2025-2030 ($ million)
Data Table on Natural language processing - Market size and forecast 2025-2030 ($ million)
Chart on Natural language processing - Year-over-year growth 2025-2030 (%)
Data Table on Natural language processing - Year-over-year growth 2025-2030 (%)

8.6 Market opportunity by Technology

Market opportunity by Technology ($ million)
Data Table on Market opportunity by Technology ($ million)

9. Market Segmentation by Application

9.1 Market segments

Chart on Application - Market share 2025-2030 (%)
Data Table on Application - Market share 2025-2030 (%)

9.2 Comparison by Application

Chart on Comparison by Application
Data Table on Comparison by Application

9.3 Nanoelectronics and optoelectronics - Market size and forecast 2025-2030

Chart on Nanoelectronics and optoelectronics - Market size and forecast 2025-2030 ($ million)
Data Table on Nanoelectronics and optoelectronics - Market size and forecast 2025-2030 ($ million)
Chart on Nanoelectronics and optoelectronics - Year-over-year growth 2025-2030 (%)
Data Table on Nanoelectronics and optoelectronics - Year-over-year growth 2025-2030 (%)

9.4 Nanomedicine and drug delivery - Market size and forecast 2025-2030

Chart on Nanomedicine and drug delivery - Market size and forecast 2025-2030 ($ million)
Data Table on Nanomedicine and drug delivery - Market size and forecast 2025-2030 ($ million)
Chart on Nanomedicine and drug delivery - Year-over-year growth 2025-2030 (%)
Data Table on Nanomedicine and drug delivery - Year-over-year growth 2025-2030 (%)

9.5 Nanosensors and nanodevices - Market size and forecast 2025-2030

Chart on Nanosensors and nanodevices - Market size and forecast 2025-2030 ($ million)
Data Table on Nanosensors and nanodevices - Market size and forecast 2025-2030 ($ million)
Chart on Nanosensors and nanodevices - Year-over-year growth 2025-2030 (%)
Data Table on Nanosensors and nanodevices - Year-over-year growth 2025-2030 (%)

9.6 Market opportunity by Application

Market opportunity by Application ($ million)
Data Table on Market opportunity by Application ($ million)

10. Market Segmentation by End-user

10.1 Market segments

Chart on End-user - Market share 2025-2030 (%)
Data Table on End-user - Market share 2025-2030 (%)

10.2 Comparison by End-user

Chart on Comparison by End-user
Data Table on Comparison by End-user

10.3 Electronics and semiconductor - Market size and forecast 2025-2030

Chart on Electronics and semiconductor - Market size and forecast 2025-2030 ($ million)
Data Table on Electronics and semiconductor - Market size and forecast 2025-2030 ($ million)
Chart on Electronics and semiconductor - Year-over-year growth 2025-2030 (%)
Data Table on Electronics and semiconductor - Year-over-year growth 2025-2030 (%)

10.4 Healthcare and biomedical - Market size and forecast 2025-2030

Chart on Healthcare and biomedical - Market size and forecast 2025-2030 ($ million)
Data Table on Healthcare and biomedical - Market size and forecast 2025-2030 ($ million)
Chart on Healthcare and biomedical - Year-over-year growth 2025-2030 (%)
Data Table on Healthcare and biomedical - Year-over-year growth 2025-2030 (%)

10.5 Energy and environment - Market size and forecast 2025-2030

Chart on Energy and environment - Market size and forecast 2025-2030 ($ million)
Data Table on Energy and environment - Market size and forecast 2025-2030 ($ million)
Chart on Energy and environment - Year-over-year growth 2025-2030 (%)
Data Table on Energy and environment - Year-over-year growth 2025-2030 (%)

10.6 Market opportunity by End-user

Market opportunity by End-user ($ million)
Data Table on Market opportunity by End-user ($ million)

11. Customer Landscape

11.1 Customer landscape overview

Analysis of price sensitivity, lifecycle, customer purchase basket, adoption rates, and purchase criteria

12. Geographic Landscape

12.1 Geographic segmentation

Chart on Market share by geography 2025-2030 (%)
Data Table on Market share by geography 2025-2030 (%)

12.2 Geographic comparison

Chart on Geographic comparison
Data Table on Geographic comparison

12.3 North America - Market size and forecast 2025-2030

Chart on North America - Market size and forecast 2025-2030 ($ million)
Data Table on North America - Market size and forecast 2025-2030 ($ million)
Chart on North America - Year-over-year growth 2025-2030 (%)
Data Table on North America - Year-over-year growth 2025-2030 (%)
Chart on Regional Comparison - North America
Data Table on Regional Comparison - North America

12.3.1 US - Market size and forecast 2025-2030

Chart on US - Market size and forecast 2025-2030 ($ million)
Data Table on US - Market size and forecast 2025-2030 ($ million)
Chart on US - Year-over-year growth 2025-2030 (%)
Data Table on US - Year-over-year growth 2025-2030 (%)

12.3.2 Canada - Market size and forecast 2025-2030

Chart on Canada - Market size and forecast 2025-2030 ($ million)
Data Table on Canada - Market size and forecast 2025-2030 ($ million)
Chart on Canada - Year-over-year growth 2025-2030 (%)
Data Table on Canada - Year-over-year growth 2025-2030 (%)

12.3.3 Mexico - Market size and forecast 2025-2030

Chart on Mexico - Market size and forecast 2025-2030 ($ million)
Data Table on Mexico - Market size and forecast 2025-2030 ($ million)
Chart on Mexico - Year-over-year growth 2025-2030 (%)
Data Table on Mexico - Year-over-year growth 2025-2030 (%)

12.4 APAC - Market size and forecast 2025-2030

Chart on APAC - Market size and forecast 2025-2030 ($ million)
Data Table on APAC - Market size and forecast 2025-2030 ($ million)
Chart on APAC - Year-over-year growth 2025-2030 (%)
Data Table on APAC - Year-over-year growth 2025-2030 (%)
Chart on Regional Comparison - APAC
Data Table on Regional Comparison - APAC

12.4.1 China - Market size and forecast 2025-2030

Chart on China - Market size and forecast 2025-2030 ($ million)
Data Table on China - Market size and forecast 2025-2030 ($ million)
Chart on China - Year-over-year growth 2025-2030 (%)
Data Table on China - Year-over-year growth 2025-2030 (%)

12.4.2 Japan - Market size and forecast 2025-2030

Chart on Japan - Market size and forecast 2025-2030 ($ million)
Data Table on Japan - Market size and forecast 2025-2030 ($ million)
Chart on Japan - Year-over-year growth 2025-2030 (%)
Data Table on Japan - Year-over-year growth 2025-2030 (%)

12.4.3 India - Market size and forecast 2025-2030

Chart on India - Market size and forecast 2025-2030 ($ million)
Data Table on India - Market size and forecast 2025-2030 ($ million)
Chart on India - Year-over-year growth 2025-2030 (%)
Data Table on India - Year-over-year growth 2025-2030 (%)

12.4.4 South Korea - Market size and forecast 2025-2030

Chart on South Korea - Market size and forecast 2025-2030 ($ million)
Data Table on South Korea - Market size and forecast 2025-2030 ($ million)
Chart on South Korea - Year-over-year growth 2025-2030 (%)
Data Table on South Korea - Year-over-year growth 2025-2030 (%)

12.4.5 Australia - Market size and forecast 2025-2030

Chart on Australia - Market size and forecast 2025-2030 ($ million)
Data Table on Australia - Market size and forecast 2025-2030 ($ million)
Chart on Australia - Year-over-year growth 2025-2030 (%)
Data Table on Australia - Year-over-year growth 2025-2030 (%)

12.4.6 Indonesia - Market size and forecast 2025-2030

Chart on Indonesia - Market size and forecast 2025-2030 ($ million)
Data Table on Indonesia - Market size and forecast 2025-2030 ($ million)
Chart on Indonesia - Year-over-year growth 2025-2030 (%)
Data Table on Indonesia - Year-over-year growth 2025-2030 (%)

12.5 Europe - Market size and forecast 2025-2030

Chart on Europe - Market size and forecast 2025-2030 ($ million)
Data Table on Europe - Market size and forecast 2025-2030 ($ million)
Chart on Europe - Year-over-year growth 2025-2030 (%)
Data Table on Europe - Year-over-year growth 2025-2030 (%)
Chart on Regional Comparison - Europe
Data Table on Regional Comparison - Europe

12.5.1 Germany - Market size and forecast 2025-2030

Chart on Germany - Market size and forecast 2025-2030 ($ million)
Data Table on Germany - Market size and forecast 2025-2030 ($ million)
Chart on Germany - Year-over-year growth 2025-2030 (%)
Data Table on Germany - Year-over-year growth 2025-2030 (%)

12.5.2 UK - Market size and forecast 2025-2030

Chart on UK - Market size and forecast 2025-2030 ($ million)
Data Table on UK - Market size and forecast 2025-2030 ($ million)
Chart on UK - Year-over-year growth 2025-2030 (%)
Data Table on UK - Year-over-year growth 2025-2030 (%)

12.5.3 France - Market size and forecast 2025-2030

Chart on France - Market size and forecast 2025-2030 ($ million)
Data Table on France - Market size and forecast 2025-2030 ($ million)
Chart on France - Year-over-year growth 2025-2030 (%)
Data Table on France - Year-over-year growth 2025-2030 (%)

12.5.4 Italy - Market size and forecast 2025-2030

Chart on Italy - Market size and forecast 2025-2030 ($ million)
Data Table on Italy - Market size and forecast 2025-2030 ($ million)
Chart on Italy - Year-over-year growth 2025-2030 (%)
Data Table on Italy - Year-over-year growth 2025-2030 (%)

12.5.5 Spain - Market size and forecast 2025-2030

Chart on Spain - Market size and forecast 2025-2030 ($ million)
Data Table on Spain - Market size and forecast 2025-2030 ($ million)
Chart on Spain - Year-over-year growth 2025-2030 (%)
Data Table on Spain - Year-over-year growth 2025-2030 (%)

12.5.6 The Netherlands - Market size and forecast 2025-2030

Chart on The Netherlands - Market size and forecast 2025-2030 ($ million)
Data Table on The Netherlands - Market size and forecast 2025-2030 ($ million)
Chart on The Netherlands - Year-over-year growth 2025-2030 (%)
Data Table on The Netherlands - Year-over-year growth 2025-2030 (%)

12.6 Middle East and Africa - Market size and forecast 2025-2030

Chart on Middle East and Africa - Market size and forecast 2025-2030 ($ million)
Data Table on Middle East and Africa - Market size and forecast 2025-2030 ($ million)
Chart on Middle East and Africa - Year-over-year growth 2025-2030 (%)
Data Table on Middle East and Africa - Year-over-year growth 2025-2030 (%)
Chart on Regional Comparison - Middle East and Africa
Data Table on Regional Comparison - Middle East and Africa

12.6.1 Saudi Arabia - Market size and forecast 2025-2030

Chart on Saudi Arabia - Market size and forecast 2025-2030 ($ million)
Data Table on Saudi Arabia - Market size and forecast 2025-2030 ($ million)
Chart on Saudi Arabia - Year-over-year growth 2025-2030 (%)
Data Table on Saudi Arabia - Year-over-year growth 2025-2030 (%)

12.6.2 UAE - Market size and forecast 2025-2030

Chart on UAE - Market size and forecast 2025-2030 ($ million)
Data Table on UAE - Market size and forecast 2025-2030 ($ million)
Chart on UAE - Year-over-year growth 2025-2030 (%)
Data Table on UAE - Year-over-year growth 2025-2030 (%)

12.6.3 South Africa - Market size and forecast 2025-2030

Chart on South Africa - Market size and forecast 2025-2030 ($ million)
Data Table on South Africa - Market size and forecast 2025-2030 ($ million)
Chart on South Africa - Year-over-year growth 2025-2030 (%)
Data Table on South Africa - Year-over-year growth 2025-2030 (%)

12.6.4 Israel - Market size and forecast 2025-2030

Chart on Israel - Market size and forecast 2025-2030 ($ million)
Data Table on Israel - Market size and forecast 2025-2030 ($ million)
Chart on Israel - Year-over-year growth 2025-2030 (%)
Data Table on Israel - Year-over-year growth 2025-2030 (%)

12.6.5 Turkey - Market size and forecast 2025-2030

Chart on Turkey - Market size and forecast 2025-2030 ($ million)
Data Table on Turkey - Market size and forecast 2025-2030 ($ million)
Chart on Turkey - Year-over-year growth 2025-2030 (%)
Data Table on Turkey - Year-over-year growth 2025-2030 (%)

12.7 South America - Market size and forecast 2025-2030

Chart on South America - Market size and forecast 2025-2030 ($ million)
Data Table on South America - Market size and forecast 2025-2030 ($ million)
Chart on South America - Year-over-year growth 2025-2030 (%)
Data Table on South America - Year-over-year growth 2025-2030 (%)
Chart on Regional Comparison - South America
Data Table on Regional Comparison - South America

12.7.1 Brazil - Market size and forecast 2025-2030

Chart on Brazil - Market size and forecast 2025-2030 ($ million)
Data Table on Brazil - Market size and forecast 2025-2030 ($ million)
Chart on Brazil - Year-over-year growth 2025-2030 (%)
Data Table on Brazil - Year-over-year growth 2025-2030 (%)

12.7.2 Argentina - Market size and forecast 2025-2030

Chart on Argentina - Market size and forecast 2025-2030 ($ million)
Data Table on Argentina - Market size and forecast 2025-2030 ($ million)
Chart on Argentina - Year-over-year growth 2025-2030 (%)
Data Table on Argentina - Year-over-year growth 2025-2030 (%)

12.7.3 Chile - Market size and forecast 2025-2030

Chart on Chile - Market size and forecast 2025-2030 ($ million)
Data Table on Chile - Market size and forecast 2025-2030 ($ million)
Chart on Chile - Year-over-year growth 2025-2030 (%)
Data Table on Chile - Year-over-year growth 2025-2030 (%)

12.8 Market opportunity by geography

Market opportunity by geography ($ million)
Data Tables on Market opportunity by geography ($ million)

13. Drivers, Challenges, and Opportunity

13.1 Market drivers

Accelerated discovery of high-performance engineered nanomaterials
Surging demand for precision targeted nanomedicine platforms
Miniaturization demands across next-generation semiconductor fabs

13.2 Market challenges

Data quality inconsistencies and experimental data scarcity
Interdisciplinary talent shortages and high compute overhead
Scaling AI simulations into reliable industrial nanomanufacturing

13.3 Impact of drivers and challenges

Impact of drivers and challenges in 2025 and 2030

13.4 Market opportunities

Development of closed-loop autonomous robotic nanotechnology labs
Integration of physics-informed neural networks for quantum mechanics
Commercial emergence of AI-designed biomimetic nanoparticles

14. Competitive Landscape

14.1 Overview

14.2

Overview on criticality of inputs and factors of differentiation

14.3 Landscape disruption

Overview on factors of disruption

14.4 Industry risks

Impact of key risks on business

15. Competitive Analysis

15.1 Companies profiled

Companies covered

15.2 Company ranking index

15.3 Market positioning of companies

Matrix on companies position and classification

15.4 Camtek Ltd.

Camtek Ltd. - Overview
Camtek Ltd. - Product / Service
Camtek Ltd. - Key offerings
SWOT

15.5 Citrine Informatics Inc.

Citrine Informatics Inc. - Overview
Citrine Informatics Inc. - Product / Service
Citrine Informatics Inc. - Key offerings
SWOT

15.6 Cusp AI Ltd

Cusp AI Ltd - Overview
Cusp AI Ltd - Product / Service
Cusp AI Ltd - Key offerings
SWOT

15.7 Entalpic SAS

Entalpic SAS - Overview
Entalpic SAS - Product / Service
Entalpic SAS - Key offerings
SWOT

15.8 Geinforce Technology Pvt Ltd

Geinforce Technology Pvt Ltd - Overview
Geinforce Technology Pvt Ltd - Product / Service
Geinforce Technology Pvt Ltd - Key offerings
SWOT

15.9 Mana Bio Ltd.

Mana Bio Ltd. - Overview
Mana Bio Ltd. - Product / Service
Mana Bio Ltd. - Key offerings
SWOT

15.10 Mat3ra Inc.

Mat3ra Inc. - Overview
Mat3ra Inc. - Product / Service
Mat3ra Inc. - Key offerings
SWOT

15.11 Mater AI Ltd

Mater AI Ltd - Overview
Mater AI Ltd - Product / Service
Mater AI Ltd - Key offerings
SWOT

15.12 MaterialsZone Ltd.

MaterialsZone Ltd. - Overview
MaterialsZone Ltd. - Product / Service
MaterialsZone Ltd. - Key offerings
SWOT

15.13 Matlantis Corp

Matlantis Corp - Overview
Matlantis Corp - Product / Service
Matlantis Corp - Key offerings
SWOT

15.14 METiS Therapeutics Inc.

METiS Therapeutics Inc. - Overview
METiS Therapeutics Inc. - Product / Service
METiS Therapeutics Inc. - Key offerings
SWOT

15.15 NanoCure AI Co

NanoCure AI Co - Overview
NanoCure AI Co - Product / Service
NanoCure AI Co - Key offerings
SWOT

15.16 Nova Ltd.

Nova Ltd. - Overview
Nova Ltd. - Product / Service
Nova Ltd. - Key offerings
SWOT

15.17 Raith GmbH

Raith GmbH - Overview
Raith GmbH - Product / Service
Raith GmbH - Key offerings
SWOT

15.18 XtalPi Holdings Ltd

XtalPi Holdings Ltd - Overview
XtalPi Holdings Ltd - Business segments
XtalPi Holdings Ltd - Key offerings
XtalPi Holdings Ltd - Segment focus
SWOT

16. Appendix

16.1 Scope of the report

Market definition
Objectives
Notes and caveats

16.2 Inclusions and exclusions checklist

Inclusions checklist
Exclusions checklist

16.3 Currency conversion rates for US$

16.4 Research methodology

16.5 Data procurement

Information sources

16.6 Data validation

16.7 Validation techniques employed for market sizing

16.8 Data synthesis

16.9 360 degree market analysis

16.10 List of abbreviations

Research Methodology

Technavio presents a detailed picture of the market by way of study, synthesis, and summation of data from multiple sources. The analysts have presented the various facets of the market with a particular focus on identifying the key industry influencers. The data thus presented is comprehensive, reliable, and the result of extensive research, both primary and secondary.

INFORMATION SOURCES

Primary sources

  • Manufacturers and suppliers
  • Channel partners
  • Industry experts
  • Strategic decision makers

Secondary sources

  • Industry journals and periodicals
  • Government data
  • Financial reports of key industry players
  • Historical data
  • Press releases

DATA ANALYSIS

Data Synthesis

  • Collation of data
  • Estimation of key figures
  • Analysis of derived insights

Data Validation

  • Triangulation with data models
  • Reference against proprietary databases
  • Corroboration with industry experts

REPORT WRITING

Qualitative

  • Market drivers
  • Market challenges
  • Market trends
  • Five forces analysis

Quantitative

  • Market size and forecast
  • Market segmentation
  • Geographical insights
  • Competitive landscape

Interested in this report?

Get your sample now to see our research methodology and insights!

Download Now

Frequently Asked Questions

Ai In Nanotechnology market growth will increase by USD 19482.4 million during 2026-2030.

The Ai In Nanotechnology market is expected to grow at a CAGR of 22.9% during 2026-2030.

Ai In Nanotechnology market is segmented by Technology (Machine learning, Deep learning, Natural language processing) Application (Nanoelectronics and optoelectronics, Nanomedicine and drug delivery, Nanosensors and nanodevices) End-user (Electronics and semiconductor, Healthcare and biomedical, Energy and environment)

Accelerated Materials Ltd., Atinary Technologies Inc., Camtek Ltd., Citrine Informatics Inc., Cusp AI Ltd, Dunia Innovations GmbH, Entalpic SAS, Geinforce Technology Pvt Ltd, InverseNano Inc., Kebotix Inc., Mana Bio Ltd., Mat3ra Inc., Mater AI Ltd, MaterialsZone Ltd., Matlantis Corp, METiS Therapeutics Inc., NanoCure AI Co, Nova Ltd., Raith GmbH, XtalPi Holdings Ltd are a few of the key vendors in the Ai In Nanotechnology market.

APAC will register the highest growth rate of 34% among the other regions. Therefore, the Ai In Nanotechnology market in APAC is expected to garner significant business opportunities for the vendors during the forecast period.

US, Canada, Mexico, China, Japan, India, South Korea, Australia, Indonesia, Germany, UK, France, Italy, Spain, The Netherlands, Saudi Arabia, UAE, South Africa, Israel, Turkey, Brazil, Argentina, Chile

  • Accelerated discovery of high-performance engineered nanomaterials is the driving factor this market.

The Ai In Nanotechnology market vendors should focus on grabbing business opportunities from the Technology segment as it accounted for the largest market share in the base year.
RIA - Research AI Assistant
Ask RIA