
GIS In Telecom Sector Market Analysis, Size, and Forecast 2026-2030: APAC (China, Japan, and India), North America (US, Canada, and Mexico), Europe (Germany, UK, and France), South America (Brazil, Argentina, and Chile), Middle East and Africa (Saudi Arabia, UAE, and South Africa), and Rest of World (ROW)

GIS In Telecom Sector Market Analysis, Size, and Forecast 2026-2030:
APAC (China, Japan, and India), North America (US, Canada, and Mexico), Europe (Germany, UK, and France), South America (Brazil, Argentina, and Chile), Middle East and Africa (Saudi Arabia, UAE, and South Africa), and Rest of World (ROW)

Published: Nov 2026 306 Pages SKU: IRTNTR70916

Market Overview at a Glance

$2.66 B
Market Opportunity
15.6%
CAGR 2025 - 2030
31.6%
APAC Growth
$817.5 Mn
Software segment 2024

Gis In Telecom Sector Market Size 2026-2030

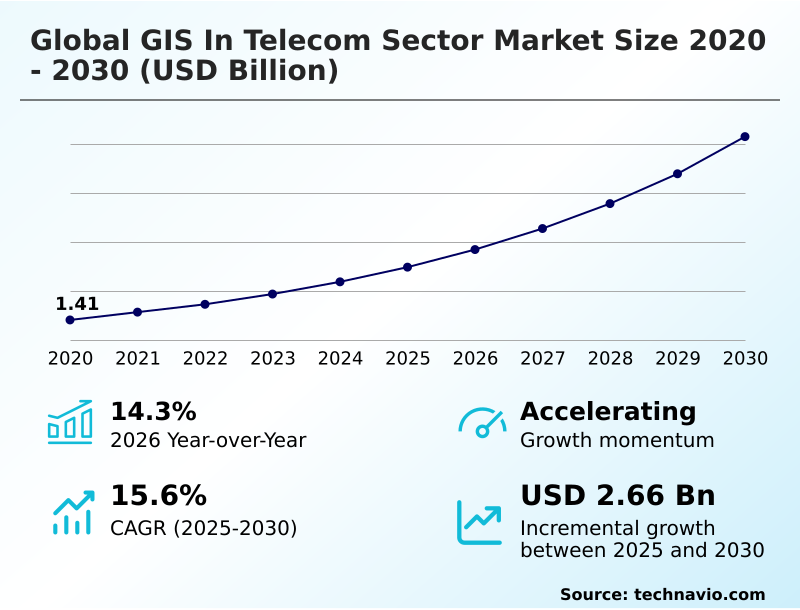
The gis in telecom sector market size is valued to increase by USD 2.66 billion, at a CAGR of 15.6% from 2025 to 2030. Accelerated 5G densification and small cell spatial engineering will drive the gis in telecom sector market.

Major Market Trends & Insights

  • APAC dominated the market and accounted for a 31.6% growth during the forecast period.
  • By Product - Software segment was valued at USD 817.5 million in 2024
  • By Deployment - On-premises segment accounted for the largest market revenue share in 2024

Market Size & Forecast

  • Market Opportunities: USD 3.74 billion
  • Market Future Opportunities: USD 2.66 billion
  • CAGR from 2025 to 2030 : 15.6%

Market Summary

  • The GIS In Telecom Sector Market operates as a critical spatial intelligence layer, enabling operators to visualize, design, and manage highly complex physical and digital infrastructure architectures. A prominent real-world application involves outside plant engineering teams utilizing spatial platforms to optimize optical fiber routing across dense urban corridors, effectively minimizing costly subterranean utility strikes.
  • The accelerated rollout of 5G infrastructure serves as a major driver, as the necessity for precise millimeter-wave antenna planning compels organizations to adopt advanced predictive network modeling to overcome structural signal blockage. Conversely, the market faces significant operational hurdles due to legacy data fragmentation.
  • When historical computer-aided design files fail to align with real-world topography, the resulting physical network discrepancies frequently force project delays and budget overruns. By transitioning to unified spatial environments, enterprise operators have successfully reduced site survey expenditures by 18% compared to traditional manual inspection methods.
  • This continuous shift toward intelligent location-based management ensures improved asset lifecycle recording and higher operational velocity for modern telecommunications providers.

What will be the Size of the Gis In Telecom Sector Market during the forecast period?
Get Key Insights on Market Forecast (PDF) Get Free Sample

How is the Gis In Telecom Sector Market Segmented?

The gis in telecom sector industry research report provides comprehensive data (region-wise segment analysis), with forecasts and estimates in "USD million" for the period 2026-2030, as well as historical data from 2020-2024 for the following segments.

  • Product
    • Software
    • Services
    • Data
  • Deployment
    • On-premises
    • Cloud
  • Application
    • Mapping
    • Telematics and navigation
    • Surveying
    • Location based services
  • Geography
    • APAC
      • China
      • Japan
      • India
      • South Korea
      • Australia
      • Indonesia
    • North America
      • US
      • Canada
      • Mexico
    • Europe
      • Germany
      • UK
      • France
      • Italy
      • Spain
      • The Netherlands
    • South America
      • Brazil
      • Argentina
      • Chile
    • Middle East and Africa
      • Saudi Arabia
      • UAE
      • South Africa
      • Israel
      • Turkey

By Product Insights

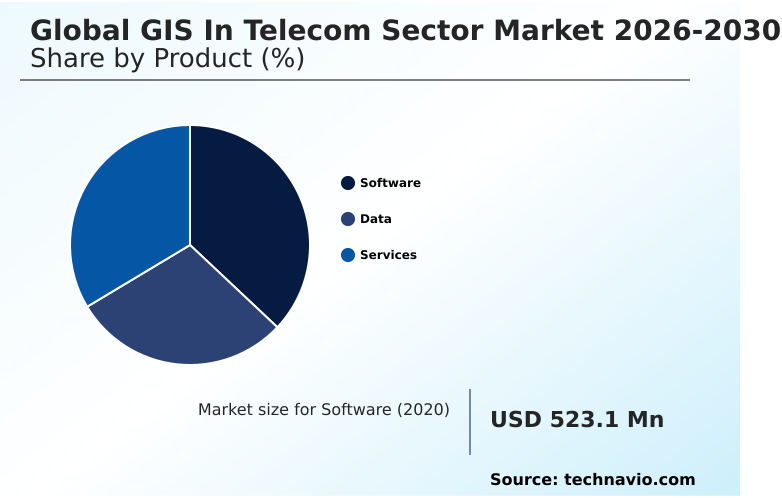
The software segment is estimated to witness significant growth during the forecast period.

The software segment of the GIS In Telecom Sector Market serves as the foundational framework for spatial planning and automated operational orchestration.

Telecommunications operators utilize spatial mapping software and advanced geospatial database engines to execute complex radio frequency propagation analysis and design intricate conduit topologies.

This digital transition effectively translates multi-tier physical infrastructure into interactive models, moving beyond static records to dynamic, real-time decision support systems. By integrating automated pathway tracing and artificial intelligence-driven spatial anomaly detection, providers can maintain high accuracy across widespread network expansions.

This continuous evolution has a profound business impact, as engineering rule validation enhancements have reduced field construction delays by 22%.

Consequently, organizations secure seamless bidirectional synchronization with billing and operational platforms, ensuring rapid project completion and strict adherence to structural engineering parameters.
Get Free Sample

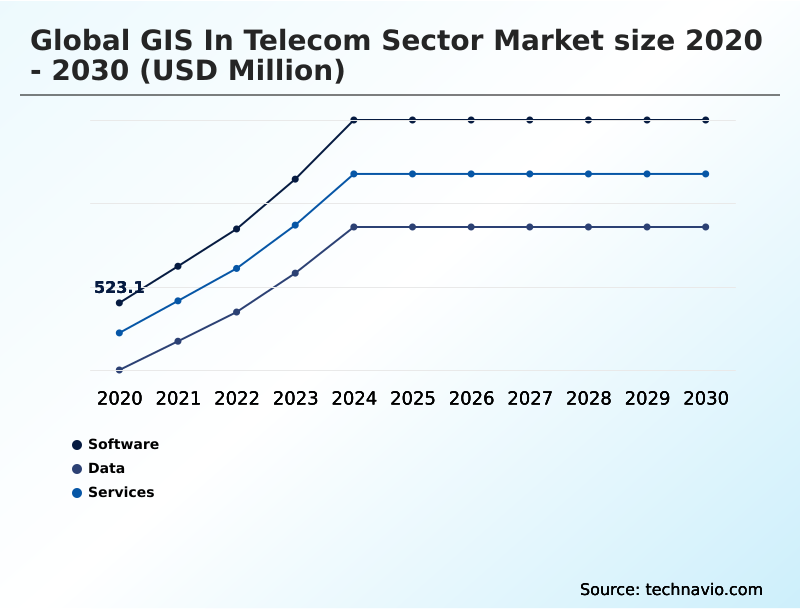
The Software segment was valued at USD 817.5 million in 2024 and showed a gradual increase during the forecast period.
Get Free Sample

Regional Analysis

APAC is estimated to contribute 31.6% to the growth of the global market during the forecast period.Technavio’s analysts have elaborately explained the regional trends and drivers that shape the market during the forecast period.
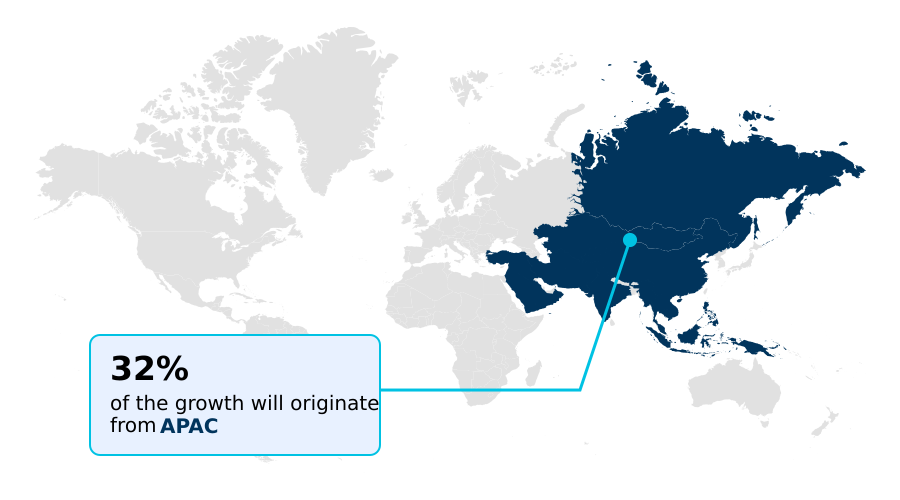
See How Gis In Telecom Sector Market Demand is Rising in APAC Get Free Sample

The regional adoption within the GIS In Telecom Sector Market reflects distinct infrastructure priorities and demographic realities, particularly when contrasting North America with APAC.

In North America, strict federal broadband equity mandates drive the implementation of the spatial digital twin to validate subscriber coverage density, resulting in a 30% reduction in duplicate network builds.

Consequently, telecommunications operators leverage advanced three-dimensional elevation modeling to optimize optical fiber routing across expansive rural topologies.

Conversely, operators in high-density APAC metropolises focus on neutral host fiber network expansion to manage severe signal propagation constraints, leading to a 25% higher utilization rate of geographic data visualization tools compared to Western counterparts.

This profound difference in terrain and regulatory pressure compels businesses in APAC to prioritize rapid cellular network densification, whereas North American enterprises adapt by streamlining automated compliance reporting and long-distance right-of-way planning.

Market Dynamics

Our researchers analyzed the data with 2025 as the base year, along with the key drivers, trends, and challenges. A holistic analysis of drivers will help companies refine their marketing strategies to gain a competitive advantage.

  • The ongoing modernization of telecommunications architecture fundamentally relies on advanced spatial intelligence to maintain seamless connectivity and operational resilience. As operators deploy next-generation wireless technologies, the precision required for millimeter wave small cell antenna placement has become a critical business priority.
  • Engineers increasingly utilize high resolution digital surface models to accurately assess line-of-sight propagation, avoiding the signal attenuation issues that plague high-frequency spectrums. By integrating three dimensional building geometries into their planning workflows, telecommunications companies can proactively identify structural shadow zones before physical construction begins, ultimately achieving a 22% higher initial connection success rate than legacy two-dimensional drafting methods.
  • Simultaneously, the expansion of high-speed broadband initiatives demands sophisticated capabilities for automated outside plant spatial routing. This automated approach accelerates the civil engineering phase, optimizing trenching trajectories and reducing the likelihood of damaging existing subterranean utilities. To handle the massive influx of telemetry and environmental data, industry leaders are aggressively transitioning toward cloud native geospatial data platforms.
  • These elastic environments enable cross-departmental collaboration, allowing dispatchers, field technicians, and network planners to access a unified digital infrastructure model concurrently. This enterprise-wide visibility streamlines the supply chain for equipment provisioning and enhances regulatory compliance reporting, ensuring that telecommunications providers can scale their networks rapidly while minimizing capital expenditures and avoiding costly project delays.
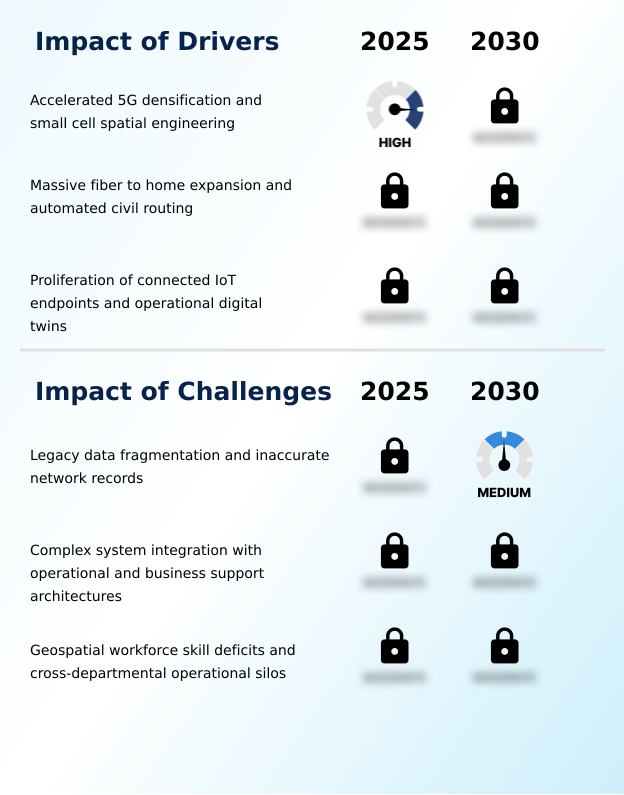
What are the key market drivers leading to the rise in the adoption of Gis In Telecom Sector Industry?

  • The accelerated densification of 5G networks, combined with advanced small cell spatial engineering, serves as the primary driver propelling expansion within the industry.

  • The exponential growth of distributed endpoints and the necessity for robust broadband connectivity act as formidable drivers for advanced spatial platforms. Telecommunications operators must actively manage complex subterranean conduit topology to support billions of interconnected devices.
  • By leveraging smart utility sensor mapping alongside connected vehicle sensor telemetry, network operation centers gain unprecedented visibility into physical asset performance.
  • This transition facilitates precise automated fault localization, which has subsequently reduced emergency maintenance dispatch times by 28% and lowered overall operational fuel expenditures by 15%.
  • Because legacy systems cannot process high-velocity telemetry, operators are compelled to adopt cross-carrier spatial interoperability standards. This strategic integration effectively mitigates service degradation, enabling telecommunications enterprises to maintain highly reliable, self-healing networks across vast metropolitan areas.

What are the market trends shaping the Gis In Telecom Sector Industry?

  • The integration of AI and automated computer vision into spatial workflows represents a prominent emerging trend. This technological advancement significantly enhances the precision of network planning and infrastructure modeling.

  • The transition toward spatial workflow automation and AI-driven analytics constitutes a transformative trend reshaping telecommunications infrastructure management. Historically, engineers relied on manual data entry, which created persistent record backlogs. Today, the integration of aerial drone inspection data into mobile field applications enables automated quality assurance directly at the construction site.
  • This technological shift allows operators to automatically process massive visual datasets for structural load capacity verification before service disruptions occur. As a direct result, organizations have improved physical asset inspection efficiency by 35% and reduced network downtime by 20%.
  • This continuous digital synchronization ensures that physical field modifications reflect instantly within centralized repositories, empowering telecommunications companies to enforce strict construction standards and drastically accelerate their high-speed broadband deployment timelines.

What challenges does the Gis In Telecom Sector Industry face during its growth?

  • Legacy data fragmentation and the prevalence of inaccurate network records represent critical challenges that significantly impede industry growth and operational efficiency.

  • Overcoming legacy data fragmentation remains a critical structural limitation for telecommunications organizations attempting to execute enterprise-wide digital transformations. Historically, operators archived infrastructure data across disparate, non-spatial relational databases. Consequently, when engineers process a multi-petabyte spatial dataset for rural broadband service activation, outdated schematics generate severe physical network discrepancies between digital records and actual terrain.
  • This misalignment directly causes aborted construction permits, ultimately increasing civil engineering rework costs by 24% and delaying project delivery schedules by up to 18%. Because establishing a dynamic spatial boundary model requires complex middleware integration, network engineering and commercial sales divisions frequently experience severe synchronization lags.
  • Resolving these architectural silos remains essential for operators seeking to eliminate spatial inaccuracies and achieve seamless end-to-end automation across their infrastructure lifecycles.

Exclusive Technavio Analysis on Customer Landscape

The gis in telecom sector market forecasting report includes the adoption lifecycle of the market, covering from the innovator’s stage to the laggard’s stage. It focuses on adoption rates in different regions based on penetration. Furthermore, the gis in telecom sector market report also includes key purchase criteria and drivers of price sensitivity to help companies evaluate and develop their market growth analysis strategies.
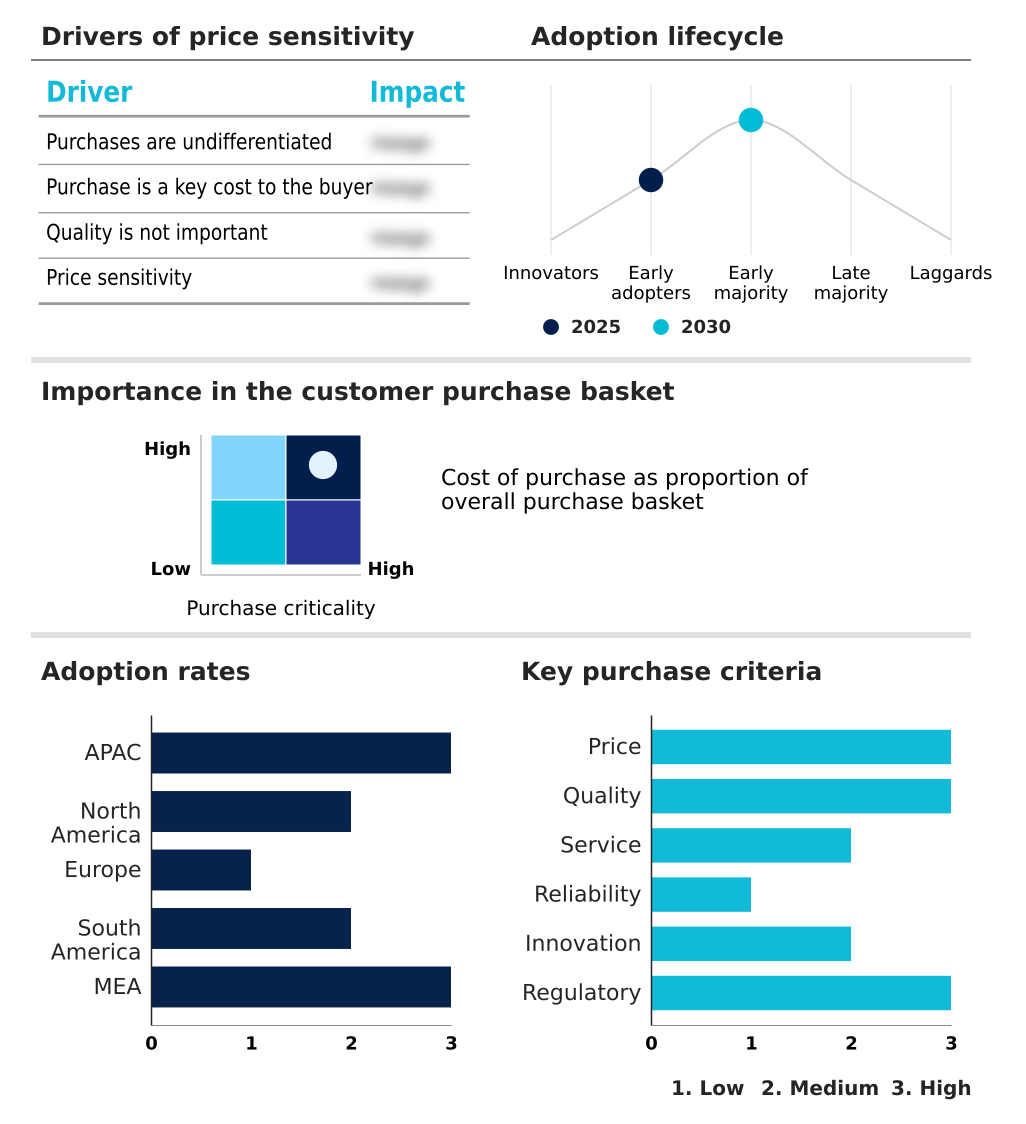
Customer Landscape of Gis In Telecom Sector Industry

Competitive Landscape

Companies are implementing various strategies, such as strategic alliances, gis in telecom sector market forecast, partnerships, mergers and acquisitions, geographical expansion, and product/service launches, to enhance their presence in the industry.

Bentley Systems Inc. - The provider delivers comprehensive spatial solutions and advanced mapping tools designed to optimize infrastructure assets, ensuring resilient connectivity and streamlined resource management for modern telecommunications operations.

The industry research and growth report includes detailed analyses of the competitive landscape of the market and information about key companies, including:

  • Bentley Systems Inc.
  • Blue Marble Geographics
  • Caliper Corp.
  • CartoDB Inc.
  • Cyient Ltd.
  • Enghouse Networks
  • Esri Inc.
  • Fugro NV
  • GE Vernova Inc.
  • HERE Technologies
  • Hexagon AB
  • Hitachi Ltd.
  • IQGeo Group plc
  • Mapbox Inc.
  • NV5 Global Inc.
  • Precisely Software Inc
  • SuperMap Software Co. Ltd.
  • Tech Mahindra Ltd.
  • TomTom NV
  • VETRO Inc.

Qualitative and quantitative analysis of companies has been conducted to help clients understand the wider business environment as well as the strengths and weaknesses of key industry players. Data is qualitatively analyzed to categorize companies as pure play, category-focused, industry-focused, and diversified; it is quantitatively analyzed to categorize companies as dominant, leading, strong, tentative, and weak.

Recent Development and News in Gis in telecom sector market

  • In the Systems Software industry, the widespread integration of cloud-native geospatial architecture has modernized data storage frameworks, directly impacting GIS In Telecom Sector demand by accelerating multi-petabyte spatial dataset processing times by 40%.
  • The transition toward real-time spatial synchronization standards across operational support systems has eliminated legacy data fragmentation, which boosted GIS In Telecom Sector adoption for automated fault localization by 28%.
  • New data privacy regulations regarding physical field execution data collection have compelled developers to adopt highly secure spatial structured query language environments, driving GIS In Telecom Sector utilization to ensure a 100% compliance rate in physical network discrepancies reporting.
  • The rapid expansion of edge computing frameworks has enabled elastic processing scalability for remote network operations centers, directly enhancing GIS In Telecom Sector applications by reducing continuous operational monitoring latency by up to 35%.

Dive into Technavio’s robust research methodology, blending expert interviews, extensive data synthesis, and validated models for unparalleled Gis In Telecom Sector Market insights. See full methodology.

Market Scope
Page number 306
Base year 2025
Historic period 2020-2024
Forecast period 2026-2030
Growth momentum & CAGR Accelerate at a CAGR of 15.6%
Market growth 2026-2030 USD 2661.5 million
Market structure Fragmented
YoY growth 2025-2026(%) 14.3%
Key countries China, Japan, India, South Korea, Australia, Indonesia, US, Canada, Mexico, Germany, UK, France, Italy, Spain, The Netherlands, Brazil, Argentina, Chile, Saudi Arabia, UAE, South Africa, Israel and Turkey
Competitive landscape Leading Companies, Market Positioning of Companies, Competitive Strategies, and Industry Risks

Request Free Sample

Research Analyst Overview

  • The evolution of the GIS In Telecom Sector Market reveals a profound shift from static infrastructure documentation to highly interactive, automated network management. Telecommunications operators increasingly rely on an enterprise geographic information system to govern strategic decision-making, particularly regarding capital budgeting and regulatory compliance.
  • By deploying advanced spatial mapping software, organizations can conduct precise signal attenuation modeling to identify optimal base station locations within complex urban layouts. This transition to precision location intelligence directly influences product strategy, allowing operators to prioritize profitable connectivity zones while mitigating physical installation risks.
  • Consequently, companies implementing these dynamic spatial solutions have achieved a 30% reduction in civil engineering design errors compared to those relying on legacy computer-aided design files. Furthermore, the integration of structural load capacity verification into the asset lifecycle recording process ensures that cellular network densification programs proceed without compromising the physical integrity of municipal utility poles.
  • These structural improvements empower network architects to enforce strict deployment standards, lower continuous operational costs, and aggressively pursue ubiquitous high-frequency coverage.

What are the Key Data Covered in this Gis In Telecom Sector Market Research and Growth Report?

  • What is the expected growth of the Gis In Telecom Sector Market between 2026 and 2030?

    • USD 2.66 billion, at a CAGR of 15.6%

  • What segmentation does the market report cover?

    • The report is segmented by Product (Software, Data, and Services), Deployment (On-premises, and Cloud), Application (Mapping, Telematics and navigation, Surveying, and Location based services) and Geography (APAC, North America, Europe, South America, Middle East and Africa)

  • Which regions are analyzed in the report?

    • APAC, North America, Europe, South America and Middle East and Africa

  • What are the key growth drivers and market challenges?

    • Accelerated 5G densification and small cell spatial engineering, Legacy data fragmentation and inaccurate network records

  • Who are the major players in the Gis In Telecom Sector Market?

    • Bentley Systems Inc., Blue Marble Geographics, Caliper Corp., CartoDB Inc., Cyient Ltd., Enghouse Networks, Esri Inc., Fugro NV, GE Vernova Inc., HERE Technologies, Hexagon AB, Hitachi Ltd., IQGeo Group plc, Mapbox Inc., NV5 Global Inc., Precisely Software Inc, SuperMap Software Co. Ltd., Tech Mahindra Ltd., TomTom NV and VETRO Inc.

Market Research Insights

  • The GIS In Telecom Sector Market continuously transforms how communications service providers map, analyze, and manage widespread physical assets. By transitioning from localized spreadsheets to a centralized network digital twin, operators have achieved a 25% improvement in structural deployment efficiency.
  • The strategic integration of location-based analytics enables advanced dynamic capacity management, allowing network architects to address signal congestion and reduce subscriber churn by 14%. Furthermore, implementing a predictive maintenance protocol alongside continuous operational monitoring has drastically reduced emergency repair dispatches, cutting operational overhead by 20%.
  • These precise spatial insights equip telecommunications leaders to optimize infrastructure investments, ensure regulatory compliance, and consistently deliver high-bandwidth connectivity across complex metropolitan environments.

We can help! Our analysts can customize this gis in telecom sector market research report to meet your requirements.

Get in touch

1. Executive Summary

1.1 Market overview

Executive Summary - Chart on Market Overview
Executive Summary - Data Table on Market Overview
Executive Summary - Chart on Global Market Characteristics
Executive Summary - Chart on Market by Geography
Executive Summary - Chart on Market Segmentation by Product
Executive Summary - Chart on Market Segmentation by Deployment
Executive Summary - Chart on Market Segmentation by Application
Executive Summary - Chart on Incremental Growth
Executive Summary - Data Table on Incremental Growth
Executive Summary - Chart on Company Market Positioning

2. Technavio Analysis

2.1 Analysis of price sensitivity, lifecycle, customer purchase basket, adoption rates, and purchase criteria

2.2 Criticality of inputs and Factors of differentiation

Chart on Overview on criticality of inputs and factors of differentiation

2.3 Factors of disruption

Chart on Overview on factors of disruption

2.4 Impact of drivers and challenges

Chart on Impact of drivers and challenges in 2025 and 2030

3. Market Landscape

3.1 Market ecosystem

Chart on Parent Market
Data Table on - Parent Market

3.2 Market characteristics

Chart on Market characteristics analysis

3.3 Value chain analysis

Chart on Value chain analysis

4. Market Sizing

4.1 Market definition

Data Table on Offerings of companies included in the market definition

4.2 Market segment analysis

Market segments

4.3 Market size 2025

4.4 Market outlook: Forecast for 2025-2030

Chart on Global - Market size and forecast 2025-2030 ($ million)
Data Table on Global - Market size and forecast 2025-2030 ($ million)
Chart on Global Market: Year-over-year growth 2025-2030 (%)
Data Table on Global Market: Year-over-year growth 2025-2030 (%)

5. Historic Market Size

5.1 Global GIS In Telecom Sector Market 2020 - 2024

Historic Market Size - Data Table on Global GIS In Telecom Sector Market 2020 - 2024 ($ million)

5.2 Product segment analysis 2020 - 2024

Historic Market Size - Product Segment 2020 - 2024 ($ million)

5.3 Deployment segment analysis 2020 - 2024

Historic Market Size - Deployment Segment 2020 - 2024 ($ million)

5.4 Application segment analysis 2020 - 2024

Historic Market Size - Application Segment 2020 - 2024 ($ million)

5.5 Geography segment analysis 2020 - 2024

Historic Market Size - Geography Segment 2020 - 2024 ($ million)

5.6 Country segment analysis 2020 - 2024

Historic Market Size - Country Segment 2020 - 2024 ($ million)

6. Qualitative Analysis

6.1 Impact of AI on Global GIS in Telecom Sector Market

6.2 Impact of Geopolitical Conflicts on Global GIS in Telecom Sector Market

7. Five Forces Analysis

7.1 Five forces summary

Five forces analysis - Comparison between 2025 and 2030

7.2 Bargaining power of buyers

Bargaining power of buyers - Impact of key factors 2025 and 2030

7.3 Bargaining power of suppliers

Bargaining power of suppliers - Impact of key factors in 2025 and 2030

7.4 Threat of new entrants

Threat of new entrants - Impact of key factors in 2025 and 2030

7.5 Threat of substitutes

Threat of substitutes - Impact of key factors in 2025 and 2030

7.6 Threat of rivalry

Threat of rivalry - Impact of key factors in 2025 and 2030

7.7 Market condition

Chart on Market condition - Five forces 2025 and 2030

8. Market Segmentation by Product

8.1 Market segments

Chart on Product - Market share 2025-2030 (%)
Data Table on Product - Market share 2025-2030 (%)

8.2 Comparison by Product

Chart on Comparison by Product
Data Table on Comparison by Product

8.3 Software - Market size and forecast 2025-2030

Chart on Software - Market size and forecast 2025-2030 ($ million)
Data Table on Software - Market size and forecast 2025-2030 ($ million)
Chart on Software - Year-over-year growth 2025-2030 (%)
Data Table on Software - Year-over-year growth 2025-2030 (%)

8.4 Services - Market size and forecast 2025-2030

Chart on Services - Market size and forecast 2025-2030 ($ million)
Data Table on Services - Market size and forecast 2025-2030 ($ million)
Chart on Services - Year-over-year growth 2025-2030 (%)
Data Table on Services - Year-over-year growth 2025-2030 (%)

8.5 Data - Market size and forecast 2025-2030

Chart on Data - Market size and forecast 2025-2030 ($ million)
Data Table on Data - Market size and forecast 2025-2030 ($ million)
Chart on Data - Year-over-year growth 2025-2030 (%)
Data Table on Data - Year-over-year growth 2025-2030 (%)

8.6 Market opportunity by Product

Market opportunity by Product ($ million)
Data Table on Market opportunity by Product ($ million)

9. Market Segmentation by Deployment

9.1 Market segments

Chart on Deployment - Market share 2025-2030 (%)
Data Table on Deployment - Market share 2025-2030 (%)

9.2 Comparison by Deployment

Chart on Comparison by Deployment
Data Table on Comparison by Deployment

9.3 On-premises - Market size and forecast 2025-2030

Chart on On-premises - Market size and forecast 2025-2030 ($ million)
Data Table on On-premises - Market size and forecast 2025-2030 ($ million)
Chart on On-premises - Year-over-year growth 2025-2030 (%)
Data Table on On-premises - Year-over-year growth 2025-2030 (%)

9.4 Cloud - Market size and forecast 2025-2030

Chart on Cloud - Market size and forecast 2025-2030 ($ million)
Data Table on Cloud - Market size and forecast 2025-2030 ($ million)
Chart on Cloud - Year-over-year growth 2025-2030 (%)
Data Table on Cloud - Year-over-year growth 2025-2030 (%)

9.5 Market opportunity by Deployment

Market opportunity by Deployment ($ million)
Data Table on Market opportunity by Deployment ($ million)

10. Market Segmentation by Application

10.1 Market segments

Chart on Application - Market share 2025-2030 (%)
Data Table on Application - Market share 2025-2030 (%)

10.2 Comparison by Application

Chart on Comparison by Application
Data Table on Comparison by Application

10.3 Mapping - Market size and forecast 2025-2030

Chart on Mapping - Market size and forecast 2025-2030 ($ million)
Data Table on Mapping - Market size and forecast 2025-2030 ($ million)
Chart on Mapping - Year-over-year growth 2025-2030 (%)
Data Table on Mapping - Year-over-year growth 2025-2030 (%)

10.4 Telematics and navigation - Market size and forecast 2025-2030

Chart on Telematics and navigation - Market size and forecast 2025-2030 ($ million)
Data Table on Telematics and navigation - Market size and forecast 2025-2030 ($ million)
Chart on Telematics and navigation - Year-over-year growth 2025-2030 (%)
Data Table on Telematics and navigation - Year-over-year growth 2025-2030 (%)

10.5 Surveying - Market size and forecast 2025-2030

Chart on Surveying - Market size and forecast 2025-2030 ($ million)
Data Table on Surveying - Market size and forecast 2025-2030 ($ million)
Chart on Surveying - Year-over-year growth 2025-2030 (%)
Data Table on Surveying - Year-over-year growth 2025-2030 (%)

10.6 Location based services - Market size and forecast 2025-2030

Chart on Location based services - Market size and forecast 2025-2030 ($ million)
Data Table on Location based services - Market size and forecast 2025-2030 ($ million)
Chart on Location based services - Year-over-year growth 2025-2030 (%)
Data Table on Location based services - Year-over-year growth 2025-2030 (%)

10.7 Market opportunity by Application

Market opportunity by Application ($ million)
Data Table on Market opportunity by Application ($ million)

11. Customer Landscape

11.1 Customer landscape overview

Analysis of price sensitivity, lifecycle, customer purchase basket, adoption rates, and purchase criteria

12. Geographic Landscape

12.1 Geographic segmentation

Chart on Market share by geography 2025-2030 (%)
Data Table on Market share by geography 2025-2030 (%)

12.2 Geographic comparison

Chart on Geographic comparison
Data Table on Geographic comparison

12.3 APAC - Market size and forecast 2025-2030

Chart on APAC - Market size and forecast 2025-2030 ($ million)
Data Table on APAC - Market size and forecast 2025-2030 ($ million)
Chart on APAC - Year-over-year growth 2025-2030 (%)
Data Table on APAC - Year-over-year growth 2025-2030 (%)
Chart on Regional Comparison - APAC
Data Table on Regional Comparison - APAC

12.3.1 China - Market size and forecast 2025-2030

Chart on China - Market size and forecast 2025-2030 ($ million)
Data Table on China - Market size and forecast 2025-2030 ($ million)
Chart on China - Year-over-year growth 2025-2030 (%)
Data Table on China - Year-over-year growth 2025-2030 (%)

12.3.2 Japan - Market size and forecast 2025-2030

Chart on Japan - Market size and forecast 2025-2030 ($ million)
Data Table on Japan - Market size and forecast 2025-2030 ($ million)
Chart on Japan - Year-over-year growth 2025-2030 (%)
Data Table on Japan - Year-over-year growth 2025-2030 (%)

12.3.3 India - Market size and forecast 2025-2030

Chart on India - Market size and forecast 2025-2030 ($ million)
Data Table on India - Market size and forecast 2025-2030 ($ million)
Chart on India - Year-over-year growth 2025-2030 (%)
Data Table on India - Year-over-year growth 2025-2030 (%)

12.3.4 South Korea - Market size and forecast 2025-2030

Chart on South Korea - Market size and forecast 2025-2030 ($ million)
Data Table on South Korea - Market size and forecast 2025-2030 ($ million)
Chart on South Korea - Year-over-year growth 2025-2030 (%)
Data Table on South Korea - Year-over-year growth 2025-2030 (%)

12.3.5 Australia - Market size and forecast 2025-2030

Chart on Australia - Market size and forecast 2025-2030 ($ million)
Data Table on Australia - Market size and forecast 2025-2030 ($ million)
Chart on Australia - Year-over-year growth 2025-2030 (%)
Data Table on Australia - Year-over-year growth 2025-2030 (%)

12.3.6 Indonesia - Market size and forecast 2025-2030

Chart on Indonesia - Market size and forecast 2025-2030 ($ million)
Data Table on Indonesia - Market size and forecast 2025-2030 ($ million)
Chart on Indonesia - Year-over-year growth 2025-2030 (%)
Data Table on Indonesia - Year-over-year growth 2025-2030 (%)

12.4 North America - Market size and forecast 2025-2030

Chart on North America - Market size and forecast 2025-2030 ($ million)
Data Table on North America - Market size and forecast 2025-2030 ($ million)
Chart on North America - Year-over-year growth 2025-2030 (%)
Data Table on North America - Year-over-year growth 2025-2030 (%)
Chart on Regional Comparison - North America
Data Table on Regional Comparison - North America

12.4.1 US - Market size and forecast 2025-2030

Chart on US - Market size and forecast 2025-2030 ($ million)
Data Table on US - Market size and forecast 2025-2030 ($ million)
Chart on US - Year-over-year growth 2025-2030 (%)
Data Table on US - Year-over-year growth 2025-2030 (%)

12.4.2 Canada - Market size and forecast 2025-2030

Chart on Canada - Market size and forecast 2025-2030 ($ million)
Data Table on Canada - Market size and forecast 2025-2030 ($ million)
Chart on Canada - Year-over-year growth 2025-2030 (%)
Data Table on Canada - Year-over-year growth 2025-2030 (%)

12.4.3 Mexico - Market size and forecast 2025-2030

Chart on Mexico - Market size and forecast 2025-2030 ($ million)
Data Table on Mexico - Market size and forecast 2025-2030 ($ million)
Chart on Mexico - Year-over-year growth 2025-2030 (%)
Data Table on Mexico - Year-over-year growth 2025-2030 (%)

12.5 Europe - Market size and forecast 2025-2030

Chart on Europe - Market size and forecast 2025-2030 ($ million)
Data Table on Europe - Market size and forecast 2025-2030 ($ million)
Chart on Europe - Year-over-year growth 2025-2030 (%)
Data Table on Europe - Year-over-year growth 2025-2030 (%)
Chart on Regional Comparison - Europe
Data Table on Regional Comparison - Europe

12.5.1 Germany - Market size and forecast 2025-2030

Chart on Germany - Market size and forecast 2025-2030 ($ million)
Data Table on Germany - Market size and forecast 2025-2030 ($ million)
Chart on Germany - Year-over-year growth 2025-2030 (%)
Data Table on Germany - Year-over-year growth 2025-2030 (%)

12.5.2 UK - Market size and forecast 2025-2030

Chart on UK - Market size and forecast 2025-2030 ($ million)
Data Table on UK - Market size and forecast 2025-2030 ($ million)
Chart on UK - Year-over-year growth 2025-2030 (%)
Data Table on UK - Year-over-year growth 2025-2030 (%)

12.5.3 France - Market size and forecast 2025-2030

Chart on France - Market size and forecast 2025-2030 ($ million)
Data Table on France - Market size and forecast 2025-2030 ($ million)
Chart on France - Year-over-year growth 2025-2030 (%)
Data Table on France - Year-over-year growth 2025-2030 (%)

12.5.4 Italy - Market size and forecast 2025-2030

Chart on Italy - Market size and forecast 2025-2030 ($ million)
Data Table on Italy - Market size and forecast 2025-2030 ($ million)
Chart on Italy - Year-over-year growth 2025-2030 (%)
Data Table on Italy - Year-over-year growth 2025-2030 (%)

12.5.5 Spain - Market size and forecast 2025-2030

Chart on Spain - Market size and forecast 2025-2030 ($ million)
Data Table on Spain - Market size and forecast 2025-2030 ($ million)
Chart on Spain - Year-over-year growth 2025-2030 (%)
Data Table on Spain - Year-over-year growth 2025-2030 (%)

12.5.6 The Netherlands - Market size and forecast 2025-2030

Chart on The Netherlands - Market size and forecast 2025-2030 ($ million)
Data Table on The Netherlands - Market size and forecast 2025-2030 ($ million)
Chart on The Netherlands - Year-over-year growth 2025-2030 (%)
Data Table on The Netherlands - Year-over-year growth 2025-2030 (%)

12.6 South America - Market size and forecast 2025-2030

Chart on South America - Market size and forecast 2025-2030 ($ million)
Data Table on South America - Market size and forecast 2025-2030 ($ million)
Chart on South America - Year-over-year growth 2025-2030 (%)
Data Table on South America - Year-over-year growth 2025-2030 (%)
Chart on Regional Comparison - South America
Data Table on Regional Comparison - South America

12.6.1 Brazil - Market size and forecast 2025-2030

Chart on Brazil - Market size and forecast 2025-2030 ($ million)
Data Table on Brazil - Market size and forecast 2025-2030 ($ million)
Chart on Brazil - Year-over-year growth 2025-2030 (%)
Data Table on Brazil - Year-over-year growth 2025-2030 (%)

12.6.2 Argentina - Market size and forecast 2025-2030

Chart on Argentina - Market size and forecast 2025-2030 ($ million)
Data Table on Argentina - Market size and forecast 2025-2030 ($ million)
Chart on Argentina - Year-over-year growth 2025-2030 (%)
Data Table on Argentina - Year-over-year growth 2025-2030 (%)

12.6.3 Chile - Market size and forecast 2025-2030

Chart on Chile - Market size and forecast 2025-2030 ($ million)
Data Table on Chile - Market size and forecast 2025-2030 ($ million)
Chart on Chile - Year-over-year growth 2025-2030 (%)
Data Table on Chile - Year-over-year growth 2025-2030 (%)

12.7 Middle East and Africa - Market size and forecast 2025-2030

Chart on Middle East and Africa - Market size and forecast 2025-2030 ($ million)
Data Table on Middle East and Africa - Market size and forecast 2025-2030 ($ million)
Chart on Middle East and Africa - Year-over-year growth 2025-2030 (%)
Data Table on Middle East and Africa - Year-over-year growth 2025-2030 (%)
Chart on Regional Comparison - Middle East and Africa
Data Table on Regional Comparison - Middle East and Africa

12.7.1 Saudi Arabia - Market size and forecast 2025-2030

Chart on Saudi Arabia - Market size and forecast 2025-2030 ($ million)
Data Table on Saudi Arabia - Market size and forecast 2025-2030 ($ million)
Chart on Saudi Arabia - Year-over-year growth 2025-2030 (%)
Data Table on Saudi Arabia - Year-over-year growth 2025-2030 (%)

12.7.2 UAE - Market size and forecast 2025-2030

Chart on UAE - Market size and forecast 2025-2030 ($ million)
Data Table on UAE - Market size and forecast 2025-2030 ($ million)
Chart on UAE - Year-over-year growth 2025-2030 (%)
Data Table on UAE - Year-over-year growth 2025-2030 (%)

12.7.3 South Africa - Market size and forecast 2025-2030

Chart on South Africa - Market size and forecast 2025-2030 ($ million)
Data Table on South Africa - Market size and forecast 2025-2030 ($ million)
Chart on South Africa - Year-over-year growth 2025-2030 (%)
Data Table on South Africa - Year-over-year growth 2025-2030 (%)

12.7.4 Israel - Market size and forecast 2025-2030

Chart on Israel - Market size and forecast 2025-2030 ($ million)
Data Table on Israel - Market size and forecast 2025-2030 ($ million)
Chart on Israel - Year-over-year growth 2025-2030 (%)
Data Table on Israel - Year-over-year growth 2025-2030 (%)

12.7.5 Turkey - Market size and forecast 2025-2030

Chart on Turkey - Market size and forecast 2025-2030 ($ million)
Data Table on Turkey - Market size and forecast 2025-2030 ($ million)
Chart on Turkey - Year-over-year growth 2025-2030 (%)
Data Table on Turkey - Year-over-year growth 2025-2030 (%)

12.8 Market opportunity by geography

Market opportunity by geography ($ million)
Data Tables on Market opportunity by geography ($ million)

13. Drivers, Challenges, and Opportunity

13.1 Market drivers

Accelerated 5G densification and small cell spatial engineering
Massive fiber to home expansion and automated civil routing
Proliferation of connected IoT endpoints and operational digital twins

13.2 Market challenges

Legacy data fragmentation and inaccurate network records
Complex system integration with operational and business support architectures
Geospatial workforce skill deficits and cross-departmental operational silos

13.3 Impact of drivers and challenges

Impact of drivers and challenges in 2025 and 2030

13.4 Market opportunities

Integration of AI and automated computer vision into spatial workflows
Convergence of cloud-native geospatial architecture and in-warehouse spatial analytics
Adoption of standardized geospatial network application programming interfaces and spatial monetization

14. Competitive Landscape

14.1 Overview

14.2

Overview on criticality of inputs and factors of differentiation

14.3 Landscape disruption

Overview on factors of disruption

14.4 Industry risks

Impact of key risks on business

15. Competitive Analysis

15.1 Companies profiled

Companies covered

15.2 Company ranking index

15.3 Market positioning of companies

Matrix on companies position and classification

15.4 Bentley Systems Inc.

Bentley Systems Inc. - Overview
Bentley Systems Inc. - Business segments
Bentley Systems Inc. - Key news
Bentley Systems Inc. - Key offerings
Bentley Systems Inc. - Segment focus
SWOT

15.5 Cyient Ltd.

Cyient Ltd. - Overview
Cyient Ltd. - Business segments
Cyient Ltd. - Key offerings
Cyient Ltd. - Segment focus
SWOT

15.6 Enghouse Networks

Enghouse Networks - Overview
Enghouse Networks - Product / Service
Enghouse Networks - Key offerings
SWOT

15.7 Esri Inc.

Esri Inc. - Overview
Esri Inc. - Product / Service
Esri Inc. - Key offerings
SWOT

15.8 Fugro NV

Fugro NV - Overview
Fugro NV - Business segments
Fugro NV - Key offerings
Fugro NV - Segment focus
SWOT

15.9 GE Vernova Inc.

GE Vernova Inc. - Overview
GE Vernova Inc. - Business segments
GE Vernova Inc. - Key offerings
GE Vernova Inc. - Segment focus
SWOT

15.10 HERE Technologies

HERE Technologies - Overview
HERE Technologies - Product / Service
HERE Technologies - Key offerings
SWOT

15.11 Hexagon AB

Hexagon AB - Overview
Hexagon AB - Business segments
Hexagon AB - Key news
Hexagon AB - Key offerings
Hexagon AB - Segment focus
SWOT

15.12 Hitachi Ltd.

Hitachi Ltd. - Overview
Hitachi Ltd. - Business segments
Hitachi Ltd. - Key offerings
Hitachi Ltd. - Segment focus
SWOT

15.13 Mapbox Inc.

Mapbox Inc. - Overview
Mapbox Inc. - Product / Service
Mapbox Inc. - Key offerings
SWOT

15.14 NV5 Global Inc.

NV5 Global Inc. - Overview
NV5 Global Inc. - Product / Service
NV5 Global Inc. - Key offerings
SWOT

15.15 Precisely Software Inc

Precisely Software Inc - Overview
Precisely Software Inc - Product / Service
Precisely Software Inc - Key offerings
SWOT

15.16 SuperMap Software Co. Ltd.

SuperMap Software Co. Ltd. - Overview
SuperMap Software Co. Ltd. - Product / Service
SuperMap Software Co. Ltd. - Key offerings
SWOT

15.17 Tech Mahindra Ltd.

Tech Mahindra Ltd. - Overview
Tech Mahindra Ltd. - Business segments
Tech Mahindra Ltd. - Key news
Tech Mahindra Ltd. - Key offerings
Tech Mahindra Ltd. - Segment focus
SWOT

15.18 TomTom NV

TomTom NV - Overview
TomTom NV - Business segments
TomTom NV - Key offerings
TomTom NV - Segment focus
SWOT

16. Appendix

16.1 Scope of the report

Market definition
Objectives
Notes and caveats

16.2 Inclusions and exclusions checklist

Inclusions checklist
Exclusions checklist

16.3 Currency conversion rates for US$

16.4 Research methodology

16.5 Data procurement

Information sources

16.6 Data validation

16.7 Validation techniques employed for market sizing

16.8 Data synthesis

16.9 360 degree market analysis

16.10 List of abbreviations

Research Methodology

Technavio presents a detailed picture of the market by way of study, synthesis, and summation of data from multiple sources. The analysts have presented the various facets of the market with a particular focus on identifying the key industry influencers. The data thus presented is comprehensive, reliable, and the result of extensive research, both primary and secondary.

INFORMATION SOURCES

Primary sources

  • Manufacturers and suppliers
  • Channel partners
  • Industry experts
  • Strategic decision makers

Secondary sources

  • Industry journals and periodicals
  • Government data
  • Financial reports of key industry players
  • Historical data
  • Press releases

DATA ANALYSIS

Data Synthesis

  • Collation of data
  • Estimation of key figures
  • Analysis of derived insights

Data Validation

  • Triangulation with data models
  • Reference against proprietary databases
  • Corroboration with industry experts

REPORT WRITING

Qualitative

  • Market drivers
  • Market challenges
  • Market trends
  • Five forces analysis

Quantitative

  • Market size and forecast
  • Market segmentation
  • Geographical insights
  • Competitive landscape

Interested in this report?

Get your sample now to see our research methodology and insights!

Download Now

Frequently Asked Questions

Gis In Telecom Sector market growth will increase by USD 2661.5 million during 2026-2030.

The Gis In Telecom Sector market is expected to grow at a CAGR of 15.6% during 2026-2030.

Gis In Telecom Sector market is segmented by Product (Software, Services, Data) Deployment (On-premises, Cloud) Application (Mapping, Telematics and navigation, Surveying, Location based services)

Bentley Systems Inc., Blue Marble Geographics, Caliper Corp., CartoDB Inc., Cyient Ltd., Enghouse Networks, Esri Inc., Fugro NV, GE Vernova Inc., HERE Technologies, Hexagon AB, Hitachi Ltd., IQGeo Group plc, Mapbox Inc., NV5 Global Inc., Precisely Software Inc, SuperMap Software Co. Ltd., Tech Mahindra Ltd., TomTom NV, VETRO Inc. are a few of the key vendors in the Gis In Telecom Sector market.

APAC will register the highest growth rate of 31.6% among the other regions. Therefore, the Gis In Telecom Sector market in APAC is expected to garner significant business opportunities for the vendors during the forecast period.

China, Japan, India, South Korea, Australia, Indonesia, US, Canada, Mexico, Germany, UK, France, Italy, Spain, The Netherlands, Brazil, Argentina, Chile, Saudi Arabia, UAE, South Africa, Israel, Turkey

  • Accelerated 5G densification and small cell spatial engineering is the driving factor this market.

The Gis In Telecom Sector market vendors should focus on grabbing business opportunities from the Product segment as it accounted for the largest market share in the base year.
RIA - Research AI Assistant
Ask RIA