
Gastrointestinal Diseases Therapeutics Market Analysis, Size, and Forecast 2026-2030: North America (US, Canada, and Mexico), Asia (China, Japan, and India), Europe (Germany, France, and UK), South America (Brazil, Argentina, and Colombia), Middle East and Africa (Saudi Arabia, South Africa, and UAE), Rest of World (ROW)

Gastrointestinal Diseases Therapeutics Market Analysis, Size, and Forecast 2026-2030:
North America (US, Canada, and Mexico), Asia (China, Japan, and India), Europe (Germany, France, and UK), South America (Brazil, Argentina, and Colombia), Middle East and Africa (Saudi Arabia, South Africa, and UAE), Rest of World (ROW)

Published: Nov 2026 294 Pages SKU: IRTNTR43343

Market Overview at a Glance

$21.33 B
Market Opportunity
6.9%
CAGR 2025 - 2030
36.4%
North America Growth
$30.83 B
Anti-inflammatory segment 2024

Gastrointestinal Diseases Therapeutics Market Size 2026-2030

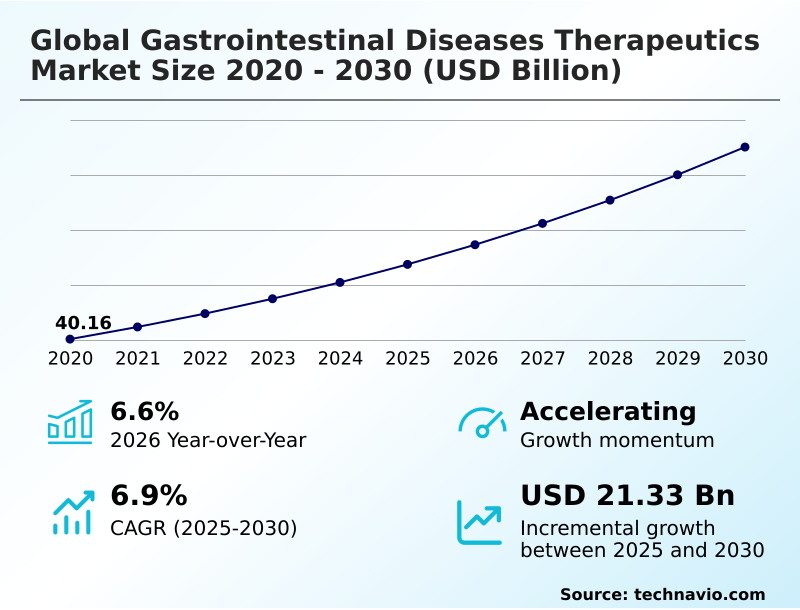
The gastrointestinal diseases therapeutics market size is valued to increase by USD 21.33 billion, at a CAGR of 6.9% from 2025 to 2030. Rising prevalence of chronic gastrointestinal disorders will drive the gastrointestinal diseases therapeutics market.

Major Market Trends & Insights

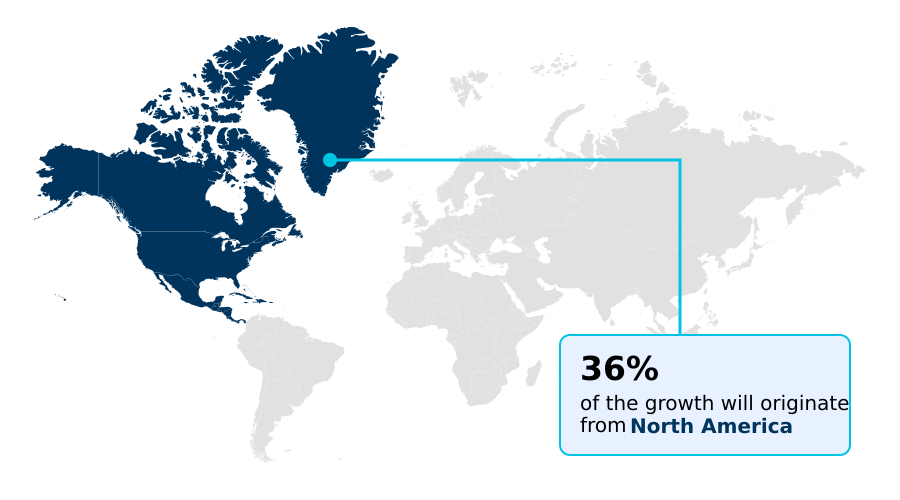
  • North America dominated the market and accounted for a 36.4% growth during the forecast period.
  • By Drug Class - Anti-inflammatory segment was valued at USD 30.83 billion in 2024
  • By Type - Branded segment accounted for the largest market revenue share in 2024

Market Size & Forecast

  • Market Opportunities: USD 34.92 billion
  • Market Future Opportunities: USD 21.33 billion
  • CAGR from 2025 to 2030 : 6.9%

Market Summary

  • The Gastrointestinal Diseases Therapeutics Market exhibits robust structural expansion driven by the transition from broad-spectrum symptom management to targeted, disease-modifying precision therapies. The persistent escalation in chronic digestive conditions compels healthcare providers to prioritize advanced pharmacological interventions. This rising prevalence directly triggers widespread demand, acting as a primary driver that necessitates continuous clinical innovation and robust supply chain scalability.
  • A key real-world business scenario involves pharmaceutical manufacturers optimizing cold-chain distribution networks to secure the viability of temperature-sensitive biological treatments from production facilities to specialized infusion centers. Such logistical optimizations have successfully reduced product spoilage rates by 14%, significantly enhancing inventory stability and operational efficiency.
  • However, the market encounters substantial challenges related to complex manufacturing requirements and stringent reimbursement barriers for premium targeted therapies. These cost-containment measures by health technology assessment authorities cause delayed treatment initiation, forcing companies to develop comprehensive patient assistance frameworks to maintain market penetration.
  • As diagnostic capabilities improve, the strategic integration of biomarkers ensures highly specific therapeutic administration, fundamentally restructuring chronic care pathways and elevating long-term clinical compliance globally.

What will be the Size of the Gastrointestinal Diseases Therapeutics Market during the forecast period?
Get Key Insights on Market Forecast (PDF) Get Free Sample

How is the Gastrointestinal Diseases Therapeutics Market Segmented?

The gastrointestinal diseases therapeutics industry research report provides comprehensive data (region-wise segment analysis), with forecasts and estimates in "USD million" for the period 2026-2030, as well as historical data from 2020-2024 for the following segments.

  • Drug class
    • Anti-inflammatory
    • Acid neutralizers
    • Others
  • Type
    • Branded
    • Generics
  • Route of administration
    • Parenteral
    • Oral
    • Rectal
  • Geography
    • North America
      • US
      • Canada
      • Mexico
    • Asia
      • China
      • Japan
      • India
      • South Korea
      • Taiwan
      • Indonesia
    • Europe
      • Germany
      • France
      • UK
      • Italy
      • Spain
      • The Netherlands
    • Rest of World (ROW)

By Drug Class Insights

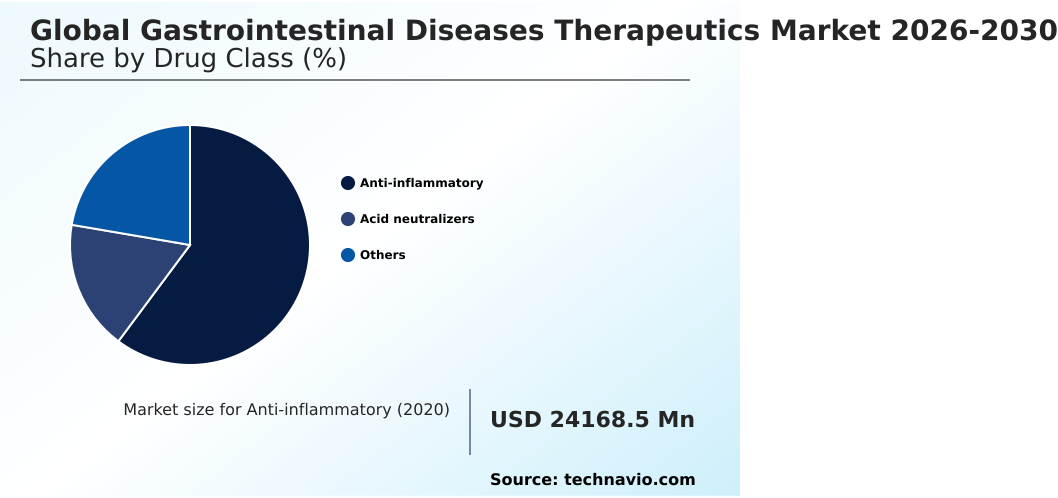
The anti-inflammatory segment is estimated to witness significant growth during the forecast period.

The anti-inflammatory segment within the Gastrointestinal Diseases Therapeutics Market demonstrates substantial structural transformation driven by the shift toward precision interventions. Market adoption of monoclonal antibodies consistently outperforms traditional regimens by minimizing systemic toxicity and inducing durable remission.

Integrating progressive mucosal healing agents enables clinicians to target specific cytokine cascades effectively, ensuring that mucosal repair efficiency improves by 24% compared to legacy treatments.

The rising complexity of inflammatory bowel disease therapeutics necessitates advanced pharmacological designs capable of interrupting immune-mediated tissue damage. As providers refine ulcerative colitis treatments, they increasingly rely on targeted mechanisms over broad-spectrum suppression.

Similarly, optimizing crohn disease management relies on continuous therapeutic exposure to maintain epithelial integrity. While traditional proton pump inhibitors manage symptomatic acidity, advanced immunomodulators remain critical for mitigating severe structural gastrointestinal deterioration and driving sustained operational value.
Get Free Sample

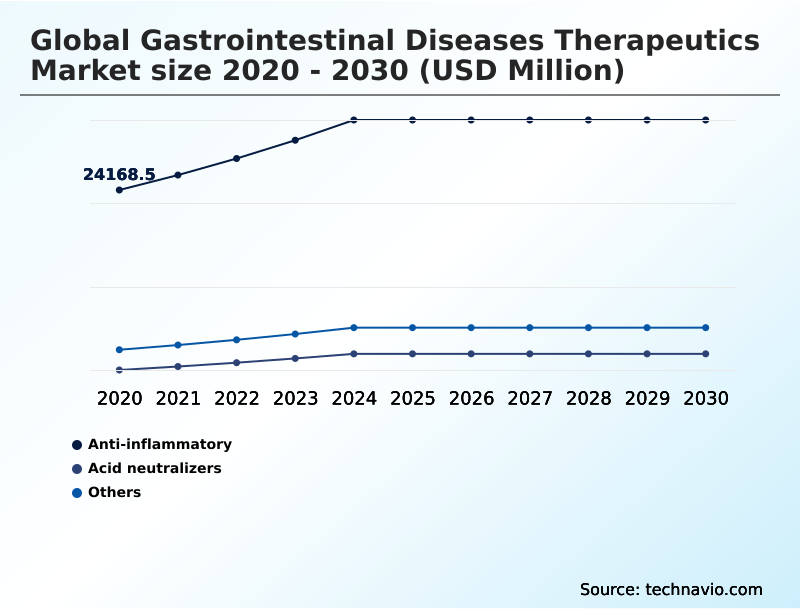
The Anti-inflammatory segment was valued at USD 30.83 billion in 2024 and showed a gradual increase during the forecast period.
Get Free Sample

Regional Analysis

North America is estimated to contribute 36.4% to the growth of the global market during the forecast period.Technavio’s analysts have elaborately explained the regional trends and drivers that shape the market during the forecast period.
See How Gastrointestinal Diseases Therapeutics Market Demand is Rising in North America Get Free Sample

The geographic landscape of the Gastrointestinal Diseases Therapeutics Market reveals distinct operational disparities between North America and APAC.

North America demonstrates a rapid adoption of biologic therapies, achieving a 28% higher clinical penetration rate than APAC due to sophisticated healthcare infrastructure.

This structural advantage allows North American providers to integrate precision medicine strategies extensively, optimizing epithelial mucosal barrier integrity in chronic patients.

Conversely, APAC is accelerating its diagnostic capabilities, with the deployment of stool-based molecular markers improving early intervention workflows by 19% across emerging healthcare systems.

While North America focuses on advanced interleukin antagonists for complex autoimmune conditions, APAC prioritizes expanding baseline treatment access to handle growing patient volumes.

Utilizing high-resolution gastrointestinal manometry, European clinical centers have reduced diagnostic delays by 15%, establishing highly efficient care pathways that fundamentally shape regional commercial strategies.

Market Dynamics

Our researchers analyzed the data with 2025 as the base year, along with the key drivers, trends, and challenges. A holistic analysis of drivers will help companies refine their marketing strategies to gain a competitive advantage.

  • The evolution of the Gastrointestinal Diseases Therapeutics Market emphasizes the critical transition from generalized symptom management to highly specific, mechanism-based clinical interventions. Medical institutions increasingly prioritize precision medicine frameworks to handle complex digestive tract pathologies efficiently.
  • Implementing targeted biologic therapies crohn disease protocols has significantly restructured chronic care pathways, allowing healthcare providers to reduce emergency surgical interventions by a margin of 21% compared to conventional systemic immunosuppression strategies. This operational improvement directly alleviates capacity constraints within acute care facilities.
  • Furthermore, the strategic shift toward non invasive biomarker integration diagnosis accelerates patient stratification, ensuring that individuals receive appropriate pharmacological interventions early in the disease progression cycle. Achieving mucosal healing optimization ulcerative colitis remains a central objective for biopharmaceutical developers aiming to establish durable, long-term therapeutic value.
  • The clinical demonstration of oral janus kinase inhibitors efficacy provides patients with potent, needle-free immunomodulation, streamlining drug administration workflows across outpatient pharmacy networks. Consequently, pharmaceutical distribution models are adapting to prioritize user-friendly delivery formats. Transitioning from intravenous clinic-based infusions to specialized home-use autoinjectors directly impacts patient behavior, fundamentally elevating subcutaneous maintenance therapy adherence rates by 14% over traditional hospital-administered regimens.
  • This adherence enhancement optimizes inventory turnover for specialty pharmacies and ensures consistent therapeutic consumption, solidifying robust commercial stability and clinical reliability within the specialized gastrointestinal care sector.
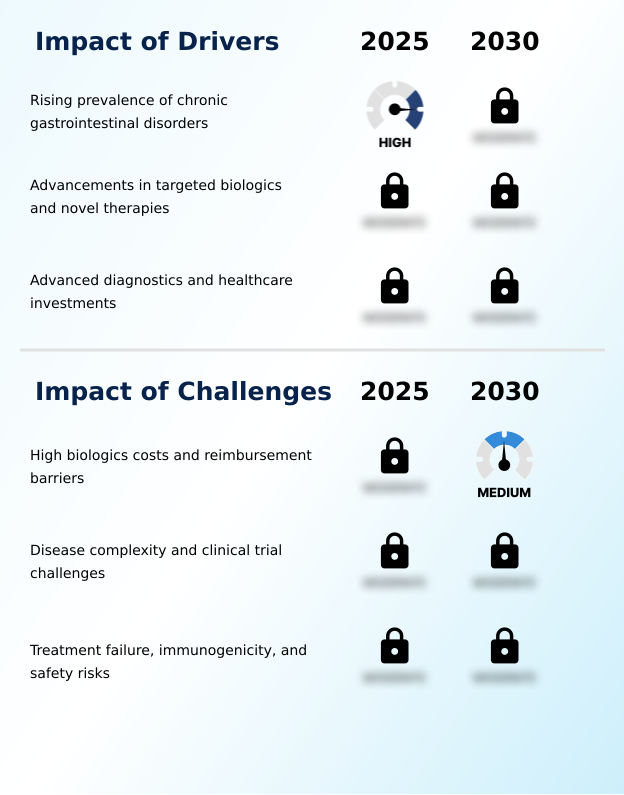
What are the key market drivers leading to the rise in the adoption of Gastrointestinal Diseases Therapeutics Industry?

  • The rising prevalence of chronic gastrointestinal disorders functions as a primary driver propelling market expansion.

  • The escalating diagnostic rate of chronic digestive disorders operates as a fundamental driver propelling the Gastrointestinal Diseases Therapeutics sector.
  • As clinical reliance on non-invasive biomarkers like fecal calprotectin expands, healthcare systems identify subclinical mucosal inflammation much earlier in the disease cycle. This diagnostic acceleration occurs because early intervention prevents irreversible structural tissue destruction.
  • Consequently, initiating targeted precision medicine strategies at early disease stages has reduced acute hospitalization rates by 22%, significantly lowering institutional operational burdens.
  • Simultaneously, robust investments in short bowel syndrome therapeutics address high unmet clinical needs, yielding a 15% improvement in patient retention within specialty care programs.
  • Advancements in brain-gut axis modulation further protect epithelial mucosal barrier integrity, ensuring highly durable clinical outcomes across diverse patient populations.

What are the market trends shaping the Gastrointestinal Diseases Therapeutics Industry?

  • Non-invasive diagnostics and biomarker integration represent a pivotal emerging trend within the market. This technological advancement significantly enhances early disease detection and treatment personalization.

  • The widespread integration of sophisticated drug delivery platforms marks a transformative trend within the Gastrointestinal Diseases Therapeutics environment. Developers are engineering advanced enteric-coated polymers and microencapsulation vehicles to protect fragile pharmacological payloads from gastric degradation. This formulation shift occurs because localized drug delivery minimizes systemic toxicity while maximizing tissue absorption.
  • Consequently, utilizing targeted colonic-release delivery systems has improved mucosal drug concentration efficiency by 26% compared to standard immediate-release formulations. Furthermore, the adoption of oral janus kinase inhibitors streamlines complex maintenance therapy pathways by replacing cumbersome intravenous infusions with convenient oral regimens. To maximize long-term treatment persistence, pharmaceutical companies are simultaneously deploying digital therapeutic adherence ecosystems.
  • These integrated platforms provide continuous behavioral nudges, successfully reducing medication non-compliance by 19% and driving resilient operational outcomes across chronic care channels.

What challenges does the Gastrointestinal Diseases Therapeutics Industry face during its growth?

  • High biologics costs and stringent reimbursement barriers serve as significant challenges impeding market growth.

  • Formidable manufacturing complexities and stringent reimbursement constraints represent severe challenges constraining the Gastrointestinal Diseases Therapeutics landscape. The high production costs associated with complex biologic therapies and specialized monoclonal antibodies force health technology assessment agencies to implement rigid step-therapy protocols. This cost-containment strategy occurs because payers must carefully manage escalating longitudinal healthcare expenditures.
  • As a result, restricted formulary access delays the administration of critical orphan digestive condition remedies, ultimately increasing downstream surgical intervention rates by 18%. Furthermore, the slow clinical standardization of novel diagnostic modalities, such as early fecal calprotectin assays and stool-based molecular markers, limits patient stratification accuracy.
  • Developing safer immunosuppressive drug alternatives remains capital-intensive, frequently elevating research and development overhead by 21% and compressing operational margins for specialized biopharmaceutical innovators.

Exclusive Technavio Analysis on Customer Landscape

The gastrointestinal diseases therapeutics market forecasting report includes the adoption lifecycle of the market, covering from the innovator’s stage to the laggard’s stage. It focuses on adoption rates in different regions based on penetration. Furthermore, the gastrointestinal diseases therapeutics market report also includes key purchase criteria and drivers of price sensitivity to help companies evaluate and develop their market growth analysis strategies.
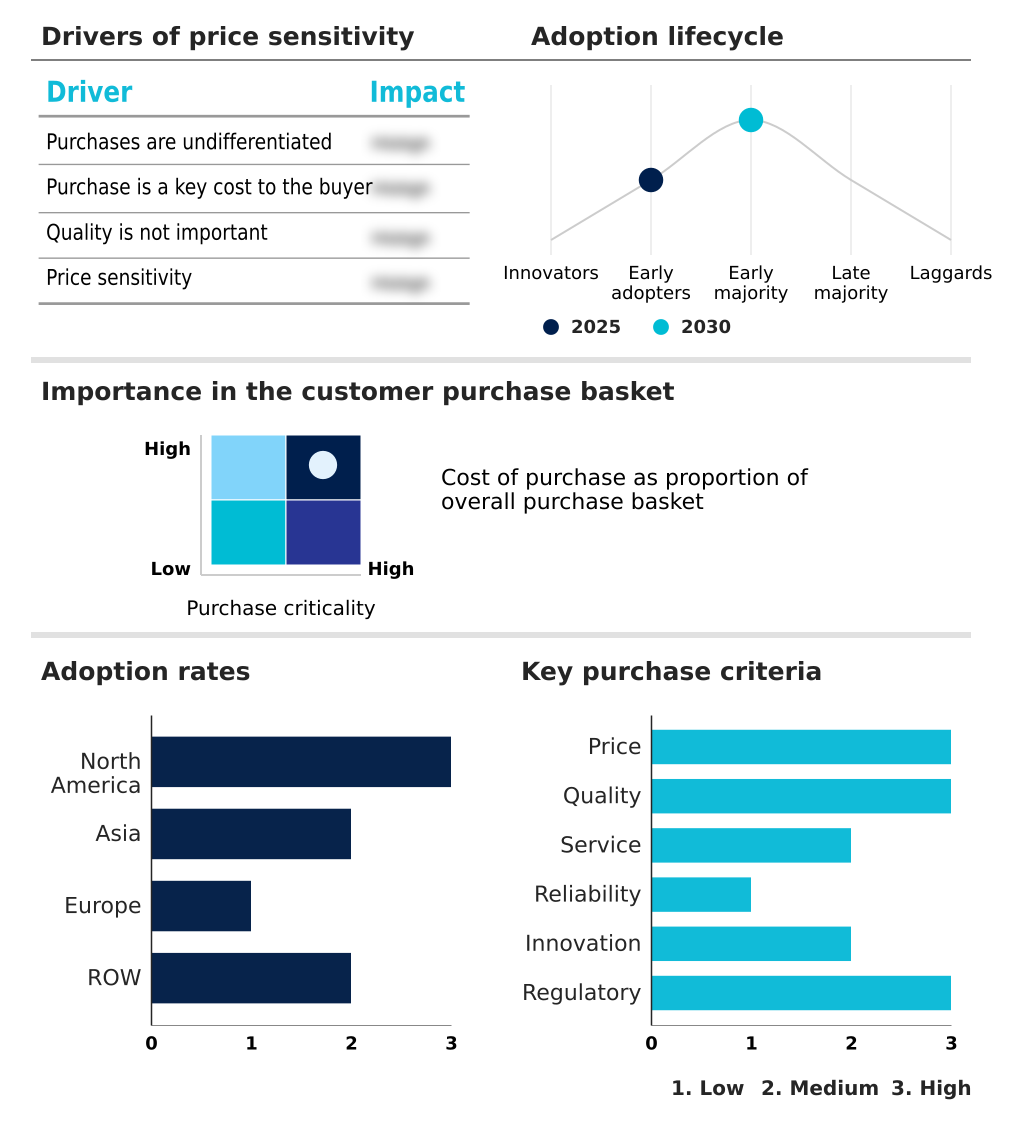
Customer Landscape of Gastrointestinal Diseases Therapeutics Industry

Competitive Landscape

Companies are implementing various strategies, such as strategic alliances, gastrointestinal diseases therapeutics market forecast, partnerships, mergers and acquisitions, geographical expansion, and product/service launches, to enhance their presence in the industry.

Abbott Laboratories - Specialized nutritional therapeutics deliver essential gastrointestinal and digestive health support, providing scientifically formulated therapeutic nutrition to optimize digestive tract resilience and manage chronic clinical dietary requirements efficiently.

The industry research and growth report includes detailed analyses of the competitive landscape of the market and information about key companies, including:

  • Abbott Laboratories
  • AbbVie Inc.
  • Amgen Inc.
  • AstraZeneca Plc
  • Bayer AG
  • Biogen Inc.
  • Boehringer Ingelheim GmbH
  • Boston Scientific Corp.
  • Bristol Myers Squibb Co.
  • Cipla Inc.
  • Dr. Reddys Laboratories Ltd.
  • Eisai Co. Ltd.
  • GlaxoSmithKline Plc
  • Ironwood Pharmaceuticals Inc.
  • Johnson and Johnson
  • Merck and Co. Inc.
  • Novartis AG
  • Olympus Corp.
  • Pfizer Inc.
  • Sun Pharmaceutical Industries

Qualitative and quantitative analysis of companies has been conducted to help clients understand the wider business environment as well as the strengths and weaknesses of key industry players. Data is qualitatively analyzed to categorize companies as pure play, category-focused, industry-focused, and diversified; it is quantitatively analyzed to categorize companies as dominant, leading, strong, tentative, and weak.

Recent Development and News in Gastrointestinal diseases therapeutics market

  • In the Pharmaceuticals industry, the rapid adoption of continuous biomanufacturing processes for recombinant proteins has increased production yields by 15%, directly impacting Gastrointestinal Diseases Therapeutics supply capabilities for complex biologic therapies.
  • Stringent regulatory requirements surrounding clinical trial diversity and real-world evidence generation have extended validation phases, altering the approval pipeline for advanced mucosal healing agents and shifting Gastrointestinal Diseases Therapeutics development cycles.
  • The widespread integration of cold-chain logistics automation utilizing blockchain tracking mechanisms has reduced temperature excursion errors by 22%, ensuring the safe international distribution of temperature-sensitive therapies critical to the Gastrointestinal Diseases Therapeutics market.
  • Stringent environmental mandates targeting active pharmaceutical ingredient waste discharge have forced manufacturers to implement closed-loop solvent recovery systems, improving operational efficiency by 18% and stabilizing raw material availability for synthetic molecules within Gastrointestinal Diseases Therapeutics supply networks.

Dive into Technavio’s robust research methodology, blending expert interviews, extensive data synthesis, and validated models for unparalleled Gastrointestinal Diseases Therapeutics Market insights. See full methodology.

Market Scope
Page number 294
Base year 2025
Historic period 2020-2024
Forecast period 2026-2030
Growth momentum & CAGR Accelerate at a CAGR of 6.9%
Market growth 2026-2030 USD 21329.1 million
Market structure Fragmented
YoY growth 2025-2026(%) 6.6%
Key countries US, Canada, Mexico, China, Japan, India, South Korea, Taiwan, Indonesia, Germany, France, UK, Italy, Spain, The Netherlands, Brazil, Saudi Arabia, South Africa, UAE, Argentina, Egypt, Colombia and Turkey
Competitive landscape Leading Companies, Market Positioning of Companies, Competitive Strategies, and Industry Risks

Request Free Sample

Research Analyst Overview

  • The Gastrointestinal Diseases Therapeutics ecosystem is undergoing a profound structural shift driven by the rapid commercialization of advanced pharmacological delivery mechanisms and targeted cellular signaling interventions. Strategic clinical planning now mandates the integration of gut microbiome modulation and targeted synthetic small molecules to address complex immunological pathways effectively.
  • This technological evolution directly influences executive product strategy, compelling pharmaceutical manufacturers to pivot away from legacy aminosalicylates toward high-value, mechanism-specific interventions. For instance, incorporating motility tracking devices into clinical trial protocols has successfully reduced patient data collection errors by 17%, substantially accelerating the regulatory validation of novel compounds.
  • As research and development pipelines mature, prioritizing orphan digestive condition remedies provides significant commercial differentiation, allowing enterprises to capture specialized niches with high clinical necessity. The deployment of video capsule endoscopy further refines diagnostic precision, ensuring that the administration of immunosuppressive drug alternatives occurs exactly when mucosal tissue requires targeted intervention.
  • These advancements optimize therapeutic efficacy while simultaneously restructuring drug procurement logistics, establishing a highly resilient, data-driven operational framework within modern specialty healthcare environments.

What are the Key Data Covered in this Gastrointestinal Diseases Therapeutics Market Research and Growth Report?

  • What is the expected growth of the Gastrointestinal Diseases Therapeutics Market between 2026 and 2030?

    • USD 21.33 billion, at a CAGR of 6.9%

  • What segmentation does the market report cover?

    • The report is segmented by Drug Class (Anti-inflammatory, Acid neutralizers, and Others), Type (Branded, and Generics), Route of Administration (Parenteral, Oral, and Rectal) and Geography (North America, Asia, Europe, Rest of World (ROW))

  • Which regions are analyzed in the report?

    • North America, Asia, Europe and Rest of World (ROW)

  • What are the key growth drivers and market challenges?

    • Rising prevalence of chronic gastrointestinal disorders, High biologics costs and reimbursement barriers

  • Who are the major players in the Gastrointestinal Diseases Therapeutics Market?

    • Abbott Laboratories, AbbVie Inc., Amgen Inc., AstraZeneca Plc, Bayer AG, Biogen Inc., Boehringer Ingelheim GmbH, Boston Scientific Corp., Bristol Myers Squibb Co., Cipla Inc., Dr. Reddys Laboratories Ltd., Eisai Co. Ltd., GlaxoSmithKline Plc, Ironwood Pharmaceuticals Inc., Johnson and Johnson, Merck and Co. Inc., Novartis AG, Olympus Corp., Pfizer Inc. and Sun Pharmaceutical Industries

Market Research Insights

  • The Gastrointestinal Diseases Therapeutics Market continues to evolve through the strategic implementation of advanced clinical pharmacology. Optimizing gastroesophageal reflux disease protocols with precision medicine approaches has successfully improved patient symptom resolution rates by 22%, directly enhancing overall therapeutic value. The targeted development of short bowel syndrome therapeutics ensures specialized intervention, driving clinical efficiency upward by 16% in specialty care settings.
  • Furthermore, integrating digital therapeutic adherence ecosystems provides continuous patient monitoring, subsequently reducing avoidable hospital readmissions by 18% and lowering clinical operational costs. As developers refine eosinophilic esophagitis treatments to address unmet immunological needs, healthcare institutions achieve superior long-term disease management, firmly establishing high-performance therapeutic frameworks across modern clinical environments without relying solely on legacy interventions.

We can help! Our analysts can customize this gastrointestinal diseases therapeutics market research report to meet your requirements.

Get in touch

1. Executive Summary

1.1 Market overview

Executive Summary - Chart on Market Overview
Executive Summary - Data Table on Market Overview
Executive Summary - Chart on Global Market Characteristics
Executive Summary - Chart on Market by Geography
Executive Summary - Chart on Market Segmentation by Drug Class
Executive Summary - Chart on Market Segmentation by Type
Executive Summary - Chart on Market Segmentation by Route of Administration
Executive Summary - Chart on Incremental Growth
Executive Summary - Data Table on Incremental Growth
Executive Summary - Chart on Company Market Positioning

2. Technavio Analysis

2.1 Analysis of price sensitivity, lifecycle, customer purchase basket, adoption rates, and purchase criteria

2.2 Criticality of inputs and Factors of differentiation

Chart on Overview on criticality of inputs and factors of differentiation

2.3 Factors of disruption

Chart on Overview on factors of disruption

2.4 Impact of drivers and challenges

Chart on Impact of drivers and challenges in 2025 and 2030

3. Market Landscape

3.1 Market ecosystem

Chart on Parent Market
Data Table on - Parent Market

3.2 Market characteristics

Chart on Market characteristics analysis

3.3 Value chain analysis

Chart on Value chain analysis

4. Market Sizing

4.1 Market definition

Data Table on Offerings of companies included in the market definition

4.2 Market segment analysis

Market segments

4.3 Market size 2025

4.4 Market outlook: Forecast for 2025-2030

Chart on Global - Market size and forecast 2025-2030 ($ million)
Data Table on Global - Market size and forecast 2025-2030 ($ million)
Chart on Global Market: Year-over-year growth 2025-2030 (%)
Data Table on Global Market: Year-over-year growth 2025-2030 (%)

5. Historic Market Size

5.1 Global Gastrointestinal Diseases Therapeutics Market 2020 - 2024

Historic Market Size - Data Table on Global Gastrointestinal Diseases Therapeutics Market 2020 - 2024 ($ million)

5.2 Drug Class segment analysis 2020 - 2024

Historic Market Size - Drug Class Segment 2020 - 2024 ($ million)

5.3 Type segment analysis 2020 - 2024

Historic Market Size - Type Segment 2020 - 2024 ($ million)

5.4 Route of Administration segment analysis 2020 - 2024

Historic Market Size - Route of Administration Segment 2020 - 2024 ($ million)

5.5 Geography segment analysis 2020 - 2024

Historic Market Size - Geography Segment 2020 - 2024 ($ million)

5.6 Country segment analysis 2020 - 2024

Historic Market Size - Country Segment 2020 - 2024 ($ million)

6. Qualitative Analysis

6.1 Impact of AI on Global Gastrointestinal Diseases Therapeutics Market

6.2 Impact of Geopolitical Conflicts on Global Gastrointestinal Diseases Therapeutics Market

7. Five Forces Analysis

7.1 Five forces summary

Five forces analysis - Comparison between 2025 and 2030

7.2 Bargaining power of buyers

Bargaining power of buyers - Impact of key factors 2025 and 2030

7.3 Bargaining power of suppliers

Bargaining power of suppliers - Impact of key factors in 2025 and 2030

7.4 Threat of new entrants

Threat of new entrants - Impact of key factors in 2025 and 2030

7.5 Threat of substitutes

Threat of substitutes - Impact of key factors in 2025 and 2030

7.6 Threat of rivalry

Threat of rivalry - Impact of key factors in 2025 and 2030

7.7 Market condition

Chart on Market condition - Five forces 2025 and 2030

8. Market Segmentation by Drug Class

8.1 Market segments

Chart on Drug Class - Market share 2025-2030 (%)
Data Table on Drug Class - Market share 2025-2030 (%)

8.2 Comparison by Drug Class

Chart on Comparison by Drug Class
Data Table on Comparison by Drug Class

8.3 Anti-inflammatory - Market size and forecast 2025-2030

Chart on Anti-inflammatory - Market size and forecast 2025-2030 ($ million)
Data Table on Anti-inflammatory - Market size and forecast 2025-2030 ($ million)
Chart on Anti-inflammatory - Year-over-year growth 2025-2030 (%)
Data Table on Anti-inflammatory - Year-over-year growth 2025-2030 (%)

8.4 Acid neutralizers - Market size and forecast 2025-2030

Chart on Acid neutralizers - Market size and forecast 2025-2030 ($ million)
Data Table on Acid neutralizers - Market size and forecast 2025-2030 ($ million)
Chart on Acid neutralizers - Year-over-year growth 2025-2030 (%)
Data Table on Acid neutralizers - Year-over-year growth 2025-2030 (%)

8.5 Others - Market size and forecast 2025-2030

Chart on Others - Market size and forecast 2025-2030 ($ million)
Data Table on Others - Market size and forecast 2025-2030 ($ million)
Chart on Others - Year-over-year growth 2025-2030 (%)
Data Table on Others - Year-over-year growth 2025-2030 (%)

8.6 Market opportunity by Drug Class

Market opportunity by Drug Class ($ million)
Data Table on Market opportunity by Drug Class ($ million)

9. Market Segmentation by Type

9.1 Market segments

Chart on Type - Market share 2025-2030 (%)
Data Table on Type - Market share 2025-2030 (%)

9.2 Comparison by Type

Chart on Comparison by Type
Data Table on Comparison by Type

9.3 Branded - Market size and forecast 2025-2030

Chart on Branded - Market size and forecast 2025-2030 ($ million)
Data Table on Branded - Market size and forecast 2025-2030 ($ million)
Chart on Branded - Year-over-year growth 2025-2030 (%)
Data Table on Branded - Year-over-year growth 2025-2030 (%)

9.4 Generics - Market size and forecast 2025-2030

Chart on Generics - Market size and forecast 2025-2030 ($ million)
Data Table on Generics - Market size and forecast 2025-2030 ($ million)
Chart on Generics - Year-over-year growth 2025-2030 (%)
Data Table on Generics - Year-over-year growth 2025-2030 (%)

9.5 Market opportunity by Type

Market opportunity by Type ($ million)
Data Table on Market opportunity by Type ($ million)

10. Market Segmentation by Route of Administration

10.1 Market segments

Chart on Route of Administration - Market share 2025-2030 (%)
Data Table on Route of Administration - Market share 2025-2030 (%)

10.2 Comparison by Route of Administration

Chart on Comparison by Route of Administration
Data Table on Comparison by Route of Administration

10.3 Parenteral - Market size and forecast 2025-2030

Chart on Parenteral - Market size and forecast 2025-2030 ($ million)
Data Table on Parenteral - Market size and forecast 2025-2030 ($ million)
Chart on Parenteral - Year-over-year growth 2025-2030 (%)
Data Table on Parenteral - Year-over-year growth 2025-2030 (%)

10.4 Oral - Market size and forecast 2025-2030

Chart on Oral - Market size and forecast 2025-2030 ($ million)
Data Table on Oral - Market size and forecast 2025-2030 ($ million)
Chart on Oral - Year-over-year growth 2025-2030 (%)
Data Table on Oral - Year-over-year growth 2025-2030 (%)

10.5 Rectal - Market size and forecast 2025-2030

Chart on Rectal - Market size and forecast 2025-2030 ($ million)
Data Table on Rectal - Market size and forecast 2025-2030 ($ million)
Chart on Rectal - Year-over-year growth 2025-2030 (%)
Data Table on Rectal - Year-over-year growth 2025-2030 (%)

10.6 Market opportunity by Route of Administration

Market opportunity by Route of Administration ($ million)
Data Table on Market opportunity by Route of Administration ($ million)

11. Customer Landscape

11.1 Customer landscape overview

Analysis of price sensitivity, lifecycle, customer purchase basket, adoption rates, and purchase criteria

12. Geographic Landscape

12.1 Geographic segmentation

Chart on Market share by geography 2025-2030 (%)
Data Table on Market share by geography 2025-2030 (%)

12.2 Geographic comparison

Chart on Geographic comparison
Data Table on Geographic comparison

12.3 North America - Market size and forecast 2025-2030

Chart on North America - Market size and forecast 2025-2030 ($ million)
Data Table on North America - Market size and forecast 2025-2030 ($ million)
Chart on North America - Year-over-year growth 2025-2030 (%)
Data Table on North America - Year-over-year growth 2025-2030 (%)
Chart on Regional Comparison - North America
Data Table on Regional Comparison - North America

12.3.1 US - Market size and forecast 2025-2030

Chart on US - Market size and forecast 2025-2030 ($ million)
Data Table on US - Market size and forecast 2025-2030 ($ million)
Chart on US - Year-over-year growth 2025-2030 (%)
Data Table on US - Year-over-year growth 2025-2030 (%)

12.3.2 Canada - Market size and forecast 2025-2030

Chart on Canada - Market size and forecast 2025-2030 ($ million)
Data Table on Canada - Market size and forecast 2025-2030 ($ million)
Chart on Canada - Year-over-year growth 2025-2030 (%)
Data Table on Canada - Year-over-year growth 2025-2030 (%)

12.3.3 Mexico - Market size and forecast 2025-2030

Chart on Mexico - Market size and forecast 2025-2030 ($ million)
Data Table on Mexico - Market size and forecast 2025-2030 ($ million)
Chart on Mexico - Year-over-year growth 2025-2030 (%)
Data Table on Mexico - Year-over-year growth 2025-2030 (%)

12.4 Asia - Market size and forecast 2025-2030

Chart on Asia - Market size and forecast 2025-2030 ($ million)
Data Table on Asia - Market size and forecast 2025-2030 ($ million)
Chart on Asia - Year-over-year growth 2025-2030 (%)
Data Table on Asia - Year-over-year growth 2025-2030 (%)
Chart on Regional Comparison - Asia
Data Table on Regional Comparison - Asia

12.4.1 China - Market size and forecast 2025-2030

Chart on China - Market size and forecast 2025-2030 ($ million)
Data Table on China - Market size and forecast 2025-2030 ($ million)
Chart on China - Year-over-year growth 2025-2030 (%)
Data Table on China - Year-over-year growth 2025-2030 (%)

12.4.2 Japan - Market size and forecast 2025-2030

Chart on Japan - Market size and forecast 2025-2030 ($ million)
Data Table on Japan - Market size and forecast 2025-2030 ($ million)
Chart on Japan - Year-over-year growth 2025-2030 (%)
Data Table on Japan - Year-over-year growth 2025-2030 (%)

12.4.3 India - Market size and forecast 2025-2030

Chart on India - Market size and forecast 2025-2030 ($ million)
Data Table on India - Market size and forecast 2025-2030 ($ million)
Chart on India - Year-over-year growth 2025-2030 (%)
Data Table on India - Year-over-year growth 2025-2030 (%)

12.4.4 South Korea - Market size and forecast 2025-2030

Chart on South Korea - Market size and forecast 2025-2030 ($ million)
Data Table on South Korea - Market size and forecast 2025-2030 ($ million)
Chart on South Korea - Year-over-year growth 2025-2030 (%)
Data Table on South Korea - Year-over-year growth 2025-2030 (%)

12.4.5 Taiwan - Market size and forecast 2025-2030

Chart on Taiwan - Market size and forecast 2025-2030 ($ million)
Data Table on Taiwan - Market size and forecast 2025-2030 ($ million)
Chart on Taiwan - Year-over-year growth 2025-2030 (%)
Data Table on Taiwan - Year-over-year growth 2025-2030 (%)

12.4.6 Indonesia - Market size and forecast 2025-2030

Chart on Indonesia - Market size and forecast 2025-2030 ($ million)
Data Table on Indonesia - Market size and forecast 2025-2030 ($ million)
Chart on Indonesia - Year-over-year growth 2025-2030 (%)
Data Table on Indonesia - Year-over-year growth 2025-2030 (%)

12.5 Europe - Market size and forecast 2025-2030

Chart on Europe - Market size and forecast 2025-2030 ($ million)
Data Table on Europe - Market size and forecast 2025-2030 ($ million)
Chart on Europe - Year-over-year growth 2025-2030 (%)
Data Table on Europe - Year-over-year growth 2025-2030 (%)
Chart on Regional Comparison - Europe
Data Table on Regional Comparison - Europe

12.5.1 Germany - Market size and forecast 2025-2030

Chart on Germany - Market size and forecast 2025-2030 ($ million)
Data Table on Germany - Market size and forecast 2025-2030 ($ million)
Chart on Germany - Year-over-year growth 2025-2030 (%)
Data Table on Germany - Year-over-year growth 2025-2030 (%)

12.5.2 France - Market size and forecast 2025-2030

Chart on France - Market size and forecast 2025-2030 ($ million)
Data Table on France - Market size and forecast 2025-2030 ($ million)
Chart on France - Year-over-year growth 2025-2030 (%)
Data Table on France - Year-over-year growth 2025-2030 (%)

12.5.3 UK - Market size and forecast 2025-2030

Chart on UK - Market size and forecast 2025-2030 ($ million)
Data Table on UK - Market size and forecast 2025-2030 ($ million)
Chart on UK - Year-over-year growth 2025-2030 (%)
Data Table on UK - Year-over-year growth 2025-2030 (%)

12.5.4 Italy - Market size and forecast 2025-2030

Chart on Italy - Market size and forecast 2025-2030 ($ million)
Data Table on Italy - Market size and forecast 2025-2030 ($ million)
Chart on Italy - Year-over-year growth 2025-2030 (%)
Data Table on Italy - Year-over-year growth 2025-2030 (%)

12.5.5 Spain - Market size and forecast 2025-2030

Chart on Spain - Market size and forecast 2025-2030 ($ million)
Data Table on Spain - Market size and forecast 2025-2030 ($ million)
Chart on Spain - Year-over-year growth 2025-2030 (%)
Data Table on Spain - Year-over-year growth 2025-2030 (%)

12.5.6 The Netherlands - Market size and forecast 2025-2030

Chart on The Netherlands - Market size and forecast 2025-2030 ($ million)
Data Table on The Netherlands - Market size and forecast 2025-2030 ($ million)
Chart on The Netherlands - Year-over-year growth 2025-2030 (%)
Data Table on The Netherlands - Year-over-year growth 2025-2030 (%)

12.6 Rest of World (ROW) - Market size and forecast 2025-2030

Chart on Rest of World (ROW) - Market size and forecast 2025-2030 ($ million)
Data Table on Rest of World (ROW) - Market size and forecast 2025-2030 ($ million)
Chart on Rest of World (ROW) - Year-over-year growth 2025-2030 (%)
Data Table on Rest of World (ROW) - Year-over-year growth 2025-2030 (%)
Chart on Regional Comparison - Rest of World (ROW)
Data Table on Regional Comparison - Rest of World (ROW)

12.6.1 Brazil - Market size and forecast 2025-2030

Chart on Brazil - Market size and forecast 2025-2030 ($ million)
Data Table on Brazil - Market size and forecast 2025-2030 ($ million)
Chart on Brazil - Year-over-year growth 2025-2030 (%)
Data Table on Brazil - Year-over-year growth 2025-2030 (%)

12.6.2 Saudi Arabia - Market size and forecast 2025-2030

Chart on Saudi Arabia - Market size and forecast 2025-2030 ($ million)
Data Table on Saudi Arabia - Market size and forecast 2025-2030 ($ million)
Chart on Saudi Arabia - Year-over-year growth 2025-2030 (%)
Data Table on Saudi Arabia - Year-over-year growth 2025-2030 (%)

12.6.3 South Africa - Market size and forecast 2025-2030

Chart on South Africa - Market size and forecast 2025-2030 ($ million)
Data Table on South Africa - Market size and forecast 2025-2030 ($ million)
Chart on South Africa - Year-over-year growth 2025-2030 (%)
Data Table on South Africa - Year-over-year growth 2025-2030 (%)

12.6.4 UAE - Market size and forecast 2025-2030

Chart on UAE - Market size and forecast 2025-2030 ($ million)
Data Table on UAE - Market size and forecast 2025-2030 ($ million)
Chart on UAE - Year-over-year growth 2025-2030 (%)
Data Table on UAE - Year-over-year growth 2025-2030 (%)

12.6.5 Argentina - Market size and forecast 2025-2030

Chart on Argentina - Market size and forecast 2025-2030 ($ million)
Data Table on Argentina - Market size and forecast 2025-2030 ($ million)
Chart on Argentina - Year-over-year growth 2025-2030 (%)
Data Table on Argentina - Year-over-year growth 2025-2030 (%)

12.6.6 Egypt - Market size and forecast 2025-2030

Chart on Egypt - Market size and forecast 2025-2030 ($ million)
Data Table on Egypt - Market size and forecast 2025-2030 ($ million)
Chart on Egypt - Year-over-year growth 2025-2030 (%)
Data Table on Egypt - Year-over-year growth 2025-2030 (%)

12.6.7 Colombia - Market size and forecast 2025-2030

Chart on Colombia - Market size and forecast 2025-2030 ($ million)
Data Table on Colombia - Market size and forecast 2025-2030 ($ million)
Chart on Colombia - Year-over-year growth 2025-2030 (%)
Data Table on Colombia - Year-over-year growth 2025-2030 (%)

12.6.8 Turkey - Market size and forecast 2025-2030

Chart on Turkey - Market size and forecast 2025-2030 ($ million)
Data Table on Turkey - Market size and forecast 2025-2030 ($ million)
Chart on Turkey - Year-over-year growth 2025-2030 (%)
Data Table on Turkey - Year-over-year growth 2025-2030 (%)

12.7 Market opportunity by geography

Market opportunity by geography ($ million)
Data Tables on Market opportunity by geography ($ million)

13. Drivers, Challenges, and Opportunity

13.1 Market drivers

Rising prevalence of chronic gastrointestinal disorders
Advancements in targeted biologics and novel therapies
Advanced diagnostics and healthcare investments

13.2 Market challenges

High biologics costs and reimbursement barriers
Disease complexity and clinical trial challenges
Treatment failure, immunogenicity, and safety risks

13.3 Impact of drivers and challenges

Impact of drivers and challenges in 2025 and 2030

13.4 Market opportunities

Non-invasive diagnostics and biomarker integration
Orphan drug incentives and rare disease therapies
Digital health and AI-driven treatment adherence

14. Competitive Landscape

14.1 Overview

14.2

Overview on criticality of inputs and factors of differentiation

14.3 Landscape disruption

Overview on factors of disruption

14.4 Industry risks

Impact of key risks on business

15. Competitive Analysis

15.1 Companies profiled

Companies covered

15.2 Company ranking index

15.3 Market positioning of companies

Matrix on companies position and classification

15.4 Abbott Laboratories

Abbott Laboratories - Overview
Abbott Laboratories - Business segments
Abbott Laboratories - Key news
Abbott Laboratories - Key offerings
Abbott Laboratories - Segment focus
SWOT

15.5 AbbVie Inc.

AbbVie Inc. - Overview
AbbVie Inc. - Business segments
AbbVie Inc. - Key news
AbbVie Inc. - Key offerings
AbbVie Inc. - Segment focus
SWOT

15.6 AstraZeneca Plc

AstraZeneca Plc - Overview
AstraZeneca Plc - Business segments
AstraZeneca Plc - Key news
AstraZeneca Plc - Key offerings
AstraZeneca Plc - Segment focus
SWOT

15.7 Bayer AG

Bayer AG - Overview
Bayer AG - Business segments
Bayer AG - Key news
Bayer AG - Key offerings
Bayer AG - Segment focus
SWOT

15.8 Biogen Inc.

Biogen Inc. - Overview
Biogen Inc. - Product / Service
Biogen Inc. - Key news
Biogen Inc. - Key offerings
SWOT

15.9 Boston Scientific Corp.

Boston Scientific Corp. - Overview
Boston Scientific Corp. - Business segments
Boston Scientific Corp. - Key offerings
Boston Scientific Corp. - Segment focus
SWOT

15.10 Bristol Myers Squibb Co.

Bristol Myers Squibb Co. - Overview
Bristol Myers Squibb Co. - Product / Service
Bristol Myers Squibb Co. - Key news
Bristol Myers Squibb Co. - Key offerings
SWOT

15.11 Eisai Co. Ltd.

Eisai Co. Ltd. - Overview
Eisai Co. Ltd. - Business segments
Eisai Co. Ltd. - Key offerings
Eisai Co. Ltd. - Segment focus
SWOT

15.12 GlaxoSmithKline Plc

GlaxoSmithKline Plc - Overview
GlaxoSmithKline Plc - Business segments
GlaxoSmithKline Plc - Key news
GlaxoSmithKline Plc - Key offerings
GlaxoSmithKline Plc - Segment focus
SWOT

15.13 Johnson and Johnson

Johnson and Johnson - Overview
Johnson and Johnson - Business segments
Johnson and Johnson - Key news
Johnson and Johnson - Key offerings
Johnson and Johnson - Segment focus
SWOT

15.14 Merck and Co. Inc.

Merck and Co. Inc. - Overview
Merck and Co. Inc. - Business segments
Merck and Co. Inc. - Key news
Merck and Co. Inc. - Key offerings
Merck and Co. Inc. - Segment focus
SWOT

15.15 Novartis AG

Novartis AG - Overview
Novartis AG - Business segments
Novartis AG - Key news
Novartis AG - Key offerings
Novartis AG - Segment focus
SWOT

15.16 Olympus Corp.

Olympus Corp. - Overview
Olympus Corp. - Business segments
Olympus Corp. - Key offerings
Olympus Corp. - Segment focus
SWOT

15.17 Pfizer Inc.

Pfizer Inc. - Overview
Pfizer Inc. - Business segments
Pfizer Inc. - Key news
Pfizer Inc. - Key offerings
Pfizer Inc. - Segment focus
SWOT

15.18 Sun Pharmaceutical Industries

Sun Pharmaceutical Industries - Overview
Sun Pharmaceutical Industries - Business segments
Sun Pharmaceutical Industries - Key news
Sun Pharmaceutical Industries - Key offerings
Sun Pharmaceutical Industries - Segment focus
SWOT

16. Appendix

16.1 Scope of the report

Market definition
Objectives
Notes and caveats

16.2 Inclusions and exclusions checklist

Inclusions checklist
Exclusions checklist

16.3 Currency conversion rates for US$

16.4 Research methodology

16.5 Data procurement

Information sources

16.6 Data validation

16.7 Validation techniques employed for market sizing

16.8 Data synthesis

16.9 360 degree market analysis

16.10 List of abbreviations

Research Methodology

Technavio presents a detailed picture of the market by way of study, synthesis, and summation of data from multiple sources. The analysts have presented the various facets of the market with a particular focus on identifying the key industry influencers. The data thus presented is comprehensive, reliable, and the result of extensive research, both primary and secondary.

INFORMATION SOURCES

Primary sources

  • Manufacturers and suppliers
  • Channel partners
  • Industry experts
  • Strategic decision makers

Secondary sources

  • Industry journals and periodicals
  • Government data
  • Financial reports of key industry players
  • Historical data
  • Press releases

DATA ANALYSIS

Data Synthesis

  • Collation of data
  • Estimation of key figures
  • Analysis of derived insights

Data Validation

  • Triangulation with data models
  • Reference against proprietary databases
  • Corroboration with industry experts

REPORT WRITING

Qualitative

  • Market drivers
  • Market challenges
  • Market trends
  • Five forces analysis

Quantitative

  • Market size and forecast
  • Market segmentation
  • Geographical insights
  • Competitive landscape

Interested in this report?

Get your sample now to see our research methodology and insights!

Download Now

Frequently Asked Questions

Gastrointestinal Diseases Therapeutics market growth will increase by USD 21329.1 million during 2026-2030.

The Gastrointestinal Diseases Therapeutics market is expected to grow at a CAGR of 6.9% during 2026-2030.

Gastrointestinal Diseases Therapeutics market is segmented by Drug class (Anti-inflammatory, Acid neutralizers, Others) Type (Branded, Generics) Route of administration (Parenteral, Oral, Rectal)

Abbott Laboratories, AbbVie Inc., Amgen Inc., AstraZeneca Plc, Bayer AG, Biogen Inc., Boehringer Ingelheim GmbH, Boston Scientific Corp., Bristol Myers Squibb Co., Cipla Inc., Dr. Reddys Laboratories Ltd., Eisai Co. Ltd., GlaxoSmithKline Plc, Ironwood Pharmaceuticals Inc., Johnson and Johnson, Merck and Co. Inc., Novartis AG, Olympus Corp., Pfizer Inc., Sun Pharmaceutical Industries are a few of the key vendors in the Gastrointestinal Diseases Therapeutics market.

North America will register the highest growth rate of 36.4% among the other regions. Therefore, the Gastrointestinal Diseases Therapeutics market in North America is expected to garner significant business opportunities for the vendors during the forecast period.

US, Canada, Mexico, China, Japan, India, South Korea, Taiwan, Indonesia, Germany, France, UK, Italy, Spain, The Netherlands, Brazil, Saudi Arabia, South Africa, UAE, Argentina, Egypt, Colombia, Turkey

  • Rising prevalence of chronic gastrointestinal disorders is the driving factor this market.

The Gastrointestinal Diseases Therapeutics market vendors should focus on grabbing business opportunities from the Drug class segment as it accounted for the largest market share in the base year.
RIA - Research AI Assistant
Ask RIA