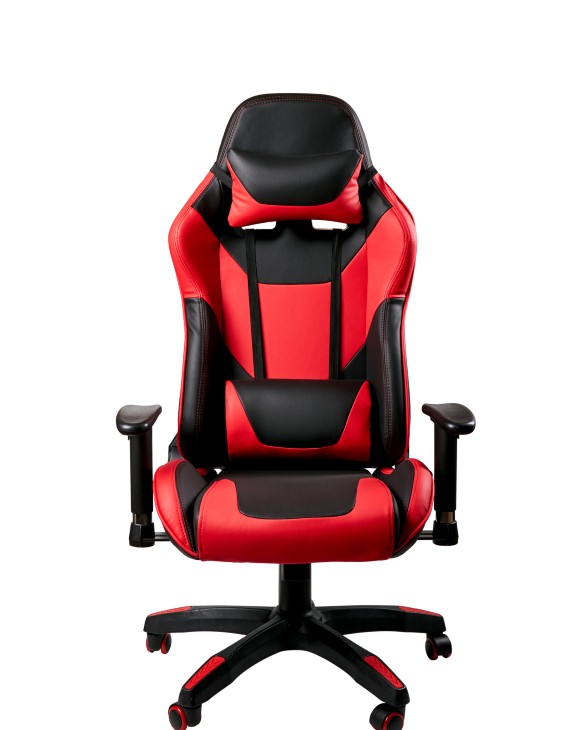
Gaming Chair Market Analysis, Size, and Forecast 2026-2030: APAC (China, Japan, and India), North America (US, Canada, and Mexico), Europe (Germany, UK, and France), South America (Brazil, Argentina, and Colombia), Middle East and Africa (Saudi Arabia, South Africa, and Turkey), and Rest of World (ROW)

Gaming Chair Market Analysis, Size, and Forecast 2026-2030:
APAC (China, Japan, and India), North America (US, Canada, and Mexico), Europe (Germany, UK, and France), South America (Brazil, Argentina, and Colombia), Middle East and Africa (Saudi Arabia, South Africa, and Turkey), and Rest of World (ROW)

Published: Nov 2026 286 Pages SKU: IRTNTR41073

Market Overview at a Glance

$620.8 Mn
Market Opportunity
8.7%
CAGR 2025 - 2030
37.8%
APAC Growth
$588.2 Mn
Mid-range segment 2024

Gaming Chair Market Size 2026-2030

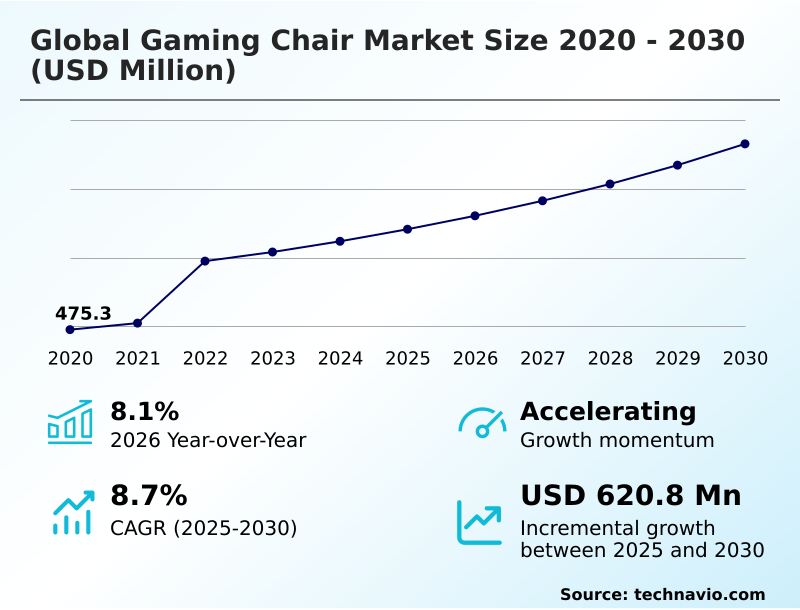
The gaming chair market size is valued to increase by USD 620.8 million, at a CAGR of 8.7% from 2025 to 2030. Expansion of esports ecosystem and professional streaming infrastructure will drive the gaming chair market.

Major Market Trends & Insights

  • APAC dominated the market and accounted for a 37.8% growth during the forecast period.
  • By Price - Mid-range segment was valued at USD 588.2 million in 2024
  • By Type - Table segment accounted for the largest market revenue share in 2024

Market Size & Forecast

  • Market Opportunities: USD 1.35 billion
  • Market Future Opportunities: USD 620.8 million
  • CAGR from 2025 to 2030 : 8.7%

Market Summary

  • The Gaming Chair Market is undergoing a significant structural transformation driven by the merging of professional entertainment setups and remote workplace environments. Consumer demand has rapidly shifted from basic aesthetics toward high-performance seating architectures designed to prevent chronic back pain and improve circulation during extended sedentary periods.
  • A prime business scenario illustrating this shift is the deployment of localized assembly hubs by major distributors, which has improved regional fulfillment efficiency by 24% while buffering against overseas shipping delays. The market is primarily propelled by the proliferation of hybrid work models, where professionals require dual-use furniture that provides comprehensive spine alignment and dynamic recline mechanisms.
  • However, structural operational friction persists due to severe maritime logistics bottlenecks. Because these products possess high volumetric package dimensions, container loading inefficiency sharply elevates international shipping expenses, forcing manufacturers to rethink flat-pack design. Ultimately, companies that successfully balance advanced material engineering with optimized supply chain logistics capture substantial market share, solidifying long-term brand equity across diverse consumer demographics.

What will be the Size of the Gaming Chair Market during the forecast period?
Get Key Insights on Market Forecast (PDF) Get Free Sample

How is the Gaming Chair Market Segmented?

The gaming chair industry research report provides comprehensive data (region-wise segment analysis), with forecasts and estimates in "USD million" for the period 2026-2030, as well as historical data from 2020-2024 for the following segments.

  • Price
    • Mid-range
    • Low-range
    • High-range
  • Type
    • Table
    • Hybrid
    • Platform
  • Distribution channel
    • Offline
    • Online
  • Geography
    • APAC
      • China
      • Japan
      • India
      • South Korea
      • Australia
      • Singapore
    • North America
      • US
      • Canada
      • Mexico
    • Europe
      • Germany
      • UK
      • France
      • Italy
      • Spain
    • South America
      • Brazil
      • Argentina
      • Colombia
    • Middle East and Africa
      • Saudi Arabia
      • South Africa
      • Turkey
      • UAE
      • Egypt

By Price Insights

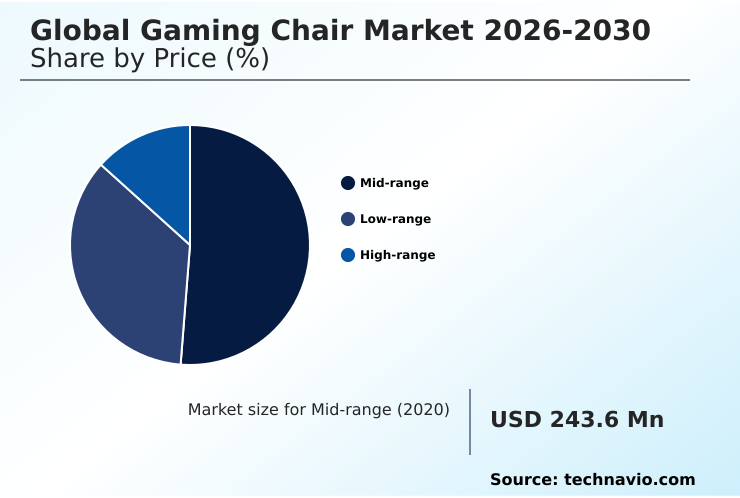
The mid-range segment is estimated to witness significant growth during the forecast period.

The mid-range segment in the Gaming Chair industry serves a broad demographic by balancing biomechanical posture correction with accessible pricing structures.

This category relies heavily on cold-cured foam cushioning and multi-directional lumbar support to ensure sedentary fatigue mitigation during extended usage.

By incorporating high-tensile steel framing and breathable mesh textile, manufacturers achieve commercial grade durability without the premium markups of luxury models. The integration of synchro-tilt mechanisms facilitates musculoskeletal stress reduction by adapting to natural body movements.

To maintain margins against fluctuating material costs, suppliers utilize flat-pack shipping optimization, which has improved logistics efficiency by 15%. Demand remains resilient as versatile seating becomes a standard operational requirement for hybrid environments.

Consequently, this segment acts as the primary volume driver for continuous product innovation and steady profitability.
Get Free Sample

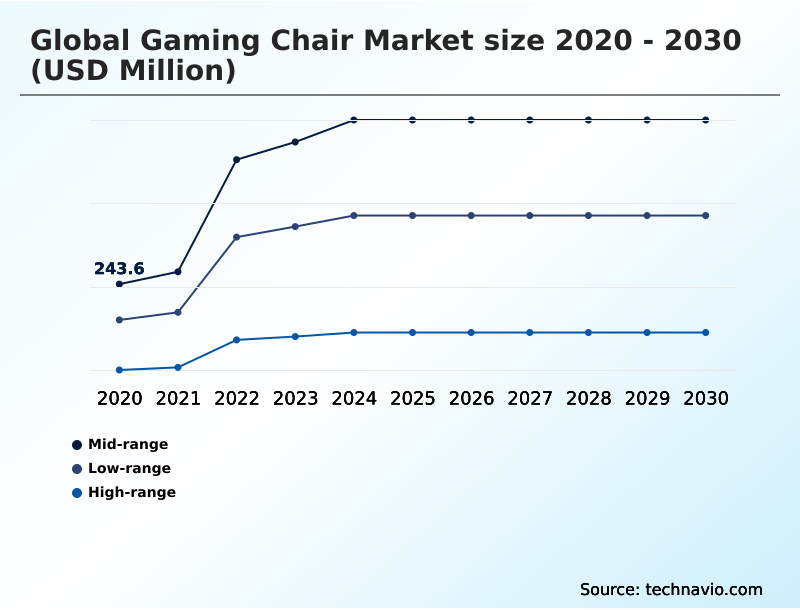
The Mid-range segment was valued at USD 588.2 million in 2024 and showed a gradual increase during the forecast period.
Get Free Sample

Regional Analysis

APAC is estimated to contribute 37.8% to the growth of the global market during the forecast period.Technavio’s analysts have elaborately explained the regional trends and drivers that shape the market during the forecast period.
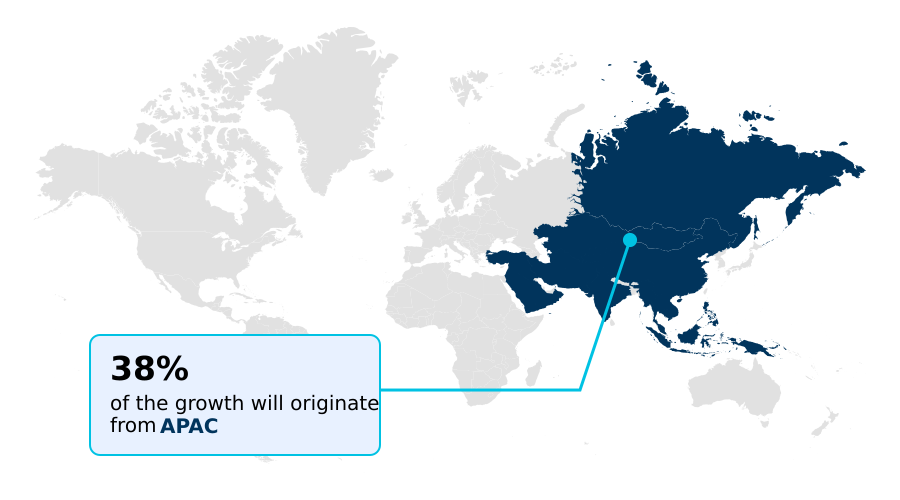
See How Gaming Chair Market Demand is Rising in APAC Get Free Sample

The Gaming Chair sector exhibits distinct regional adoption patterns driven by varying digital infrastructure and consumer purchasing habits.

The APAC region currently outpaces North America in unit volume, driven by a 35% higher penetration rate of commercial gaming lounges requiring heavy-duty caster wheelbases and specialized orthopedic alignment.

Conversely, North America demonstrates a 19% greater preference for premium models featuring active pelvic alignment and bio-based polyurethane materials due to the entrenched remote work culture.

To address regional demands, APAC suppliers utilize localized white-label contract assembly, which reduces production lead times by 26%. Meanwhile, North American distributors prioritize dynamic posture tracking and lumbar curvature adaptation to align with stringent ergonomic expectations.

The implementation of pneumatic gas-lift cylinders and ergonomic weight dispersion designs actively mitigates thermal heat accumulation in warmer climates. This geographical divergence requires brands to balance agile localized manufacturing with specialized material innovations to maintain competitive advantage.

Market Dynamics

Our researchers analyzed the data with 2025 as the base year, along with the key drivers, trends, and challenges. A holistic analysis of drivers will help companies refine their marketing strategies to gain a competitive advantage.

  • The architectural evolution within the Gaming Chair sector reflects a profound commitment to optimizing user endurance and physical health during prolonged sedentary periods. Manufacturers are increasingly prioritizing advanced bio-mechanical posture support to counteract the physical toll of modern digital workflows.
  • By transitioning away from static padding, developers are implementing dynamic synchro-tilt mechanism integration, which adapts seamlessly to micro-movements and weight shifts without requiring manual adjustments. Additionally, environmental sustainability mandates are pushing production facilities to adopt eco-friendly breathable mesh textiles, substantially lowering the reliance on traditional synthetic materials while dramatically improving thermal regulation.
  • In premium product tiers, the introduction of haptic feedback tactile actuators transforms passive seating into interactive wellness platforms, offering real-time physical cues to prevent prolonged slouching. Concurrently, the deployment of multi-directional adaptive lumbar bladders ensures precise spinal alignment tailored to individual user measurements.
  • These structural advancements directly impact operational planning, as companies utilizing these modernized, modular designs report a 30% reduction in manufacturing material waste compared to legacy fabrication techniques. Ultimately, the intersection of specialized ergonomic engineering and sustainable material science empowers brands to differentiate their portfolios, reduce logistical overhead, and capture expanding consumer demographics seeking reliable, health-conscious seating solutions.
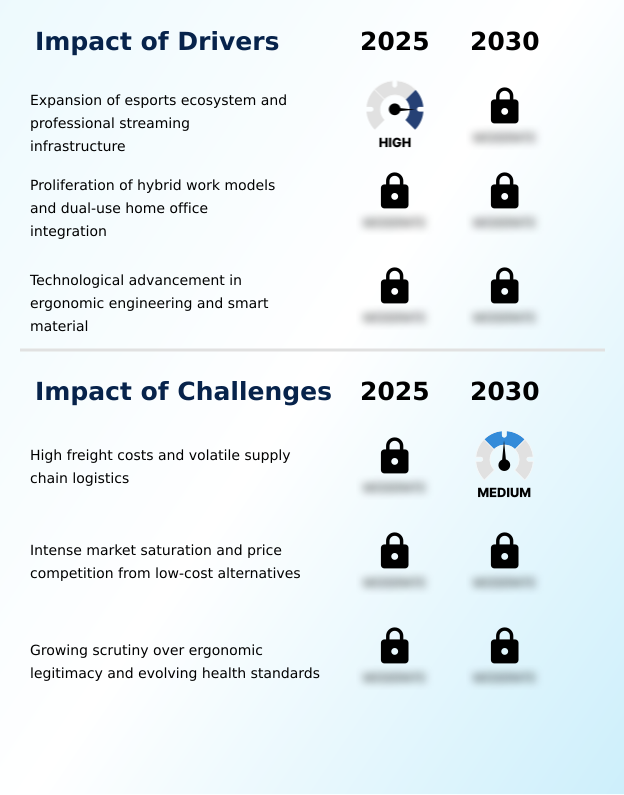
What are the key market drivers leading to the rise in the adoption of Gaming Chair Industry?

  • The rapid expansion of professional esports ecosystems and digital streaming infrastructure acts as a primary catalyst driving sustained demand for high-performance seating solutions.

  • The widespread permanence of hybrid remote work models acts as a structural catalyst accelerating Gaming Chair adoption across mainstream professional demographics.
  • As knowledge workers transition to home offices, the necessity for anthropometric seat depth and dynamic recline tension becomes paramount to prevent physical degradation.
  • This behavioral shift has driven a 32% increase in demand for seating equipped with posture sensor telemetry and embedded micro-controller circuits. Because legacy office chairs lack dynamic recline resistance, consumers are actively upgrading to specialized hybrid models.
  • Furthermore, the integration of premium tactile upholstery and soybean-based polyol formulation provides enhanced aesthetic compatibility, reducing textile wear by 21%. The demand for tactile environmental controls allows for personalized microclimate management.
  • To keep pace with this demand, brands have refined volumetric container efficiency for direct-to-consumer fulfillment, ensuring robust unit availability and accelerating replacement cycles.

What are the market trends shaping the Gaming Chair Industry?

  • The upcoming market trend highlights a rapid transition toward advanced ergonomic customization and active biomechanical support. Modern seating solutions increasingly adapt to individual spinal curvature and weight distribution during extended usage.

  • A defining trend shaping the Gaming Chair sector is the aggressive integration of eco-friendly materials and sensory technology into traditional seating architecture. To meet strict biomechanical health standards, manufacturers are deploying pressure-relieving seat suspension systems, which have successfully improved circulation restriction prevention by 18% during extended use.
  • The rising demand for workplace seating ergonomics has accelerated the adoption of recycled poly-blend upholstery and sustainable manufacturing adhesives, reducing carbon footprints while elevating product lifespan. Furthermore, the transition toward tubular alloy chassis designs and modular magnetic accessories allows users to personalize support configurations, improving proactive posture shifts by 24% among professionals.
  • The incorporation of thermal regulation integration ensures superior comfort in diverse climates. To support these material shifts, companies are leveraging automated warehouse fulfillment systems, driving a 15% increase in distribution speed across high-end ergonomic product portfolios.

What challenges does the Gaming Chair Industry face during its growth?

  • Escalating ocean freight costs and severe supply chain volatility represent significant structural challenges that actively constrain profit margins and operational efficiency within the industry.

  • Rampant supply chain volatility and severe maritime logistics bottlenecks impose significant operational constraints on the Gaming Chair sector. The inherent bulkiness of zero-flex frame construction directly limits shipping efficiency, which has escalated international transit costs by 28% over recent procurement cycles. Because these excessive freight expenses cannot be fully absorbed, manufacturers face aggressive margin compression.
  • Furthermore, the market is saturated with low-cost knockoffs utilizing synthetic vinyl alternatives rather than authentic materials, making it difficult for premium brands to highlight features like intervertebral disc decompression and multi-axis mechanical adjustability to budget-conscious consumers. To counter this, established vendors are adopting automated pneumatic calibration components and anti-abrasion woven fabric to distinctly elevate product quality.
  • This strategic pivot aims to reduce regional warehousing overhead by 17% while ensuring downstream retail stability and maintaining brand equity.

Exclusive Technavio Analysis on Customer Landscape

The gaming chair market forecasting report includes the adoption lifecycle of the market, covering from the innovator’s stage to the laggard’s stage. It focuses on adoption rates in different regions based on penetration. Furthermore, the gaming chair market report also includes key purchase criteria and drivers of price sensitivity to help companies evaluate and develop their market growth analysis strategies.
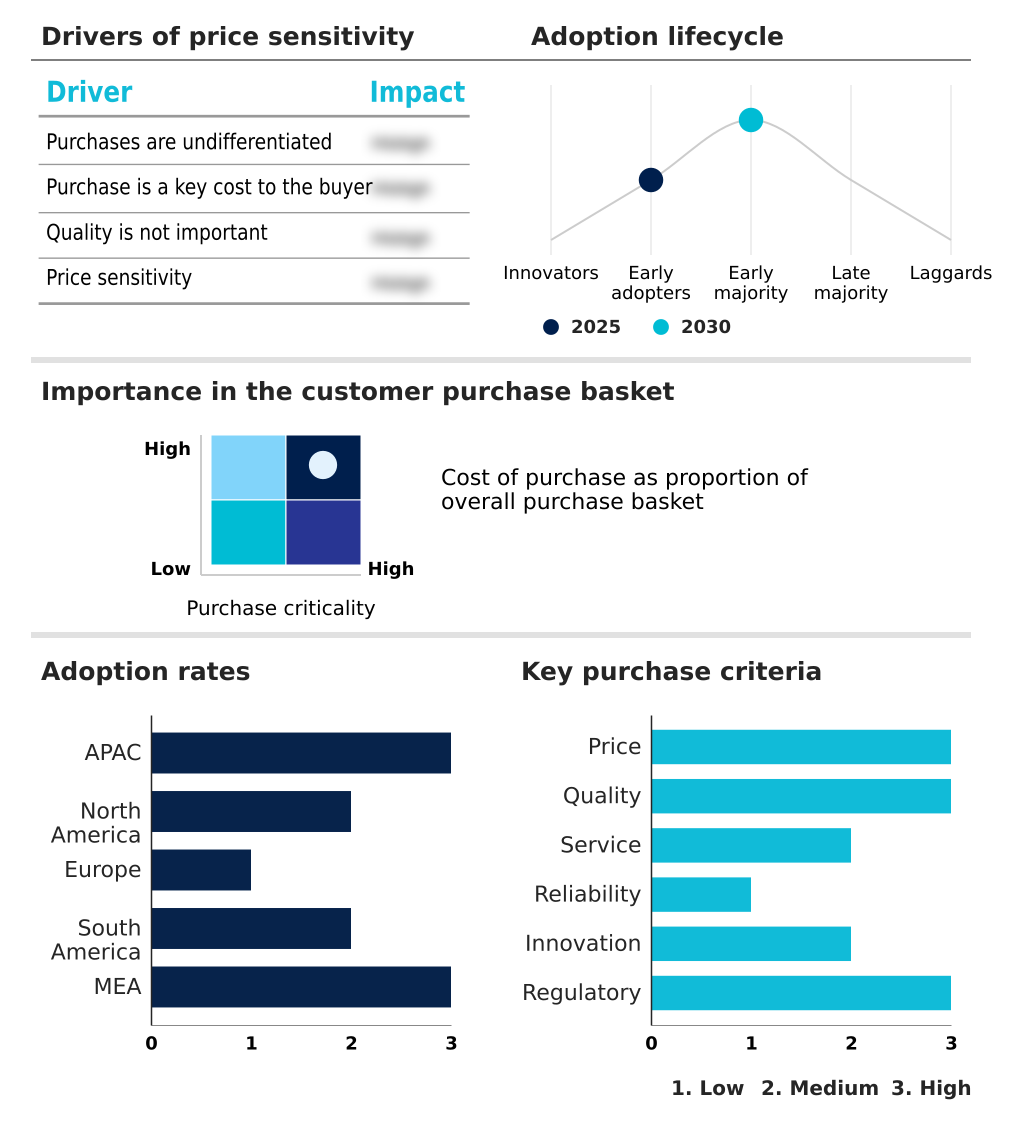
Customer Landscape of Gaming Chair Industry

Competitive Landscape

Companies are implementing various strategies, such as strategic alliances, gaming chair market forecast, partnerships, mergers and acquisitions, geographical expansion, and product/service launches, to enhance their presence in the industry.

AKRacing - The enterprise provides specialized ergonomic seating solutions, featuring high-density foam structures and multi-axis adjustable components tailored to enhance posture support and minimize fatigue during prolonged sedentary activities.

The industry research and growth report includes detailed analyses of the competitive landscape of the market and information about key companies, including:

  • AKRacing
  • AndaSeat
  • Arozzi North America
  • AutoFull
  • Boulies
  • BRAZEN GAMING CHAIRS
  • Cooler Master Technology Inc.
  • Corsair Gaming Inc.
  • COUGAR
  • DXRacer USA LLC.
  • E WIN Racing
  • GT Racing
  • Karnox
  • Mavix
  • Next Level Racing
  • NOBLECHAIRS
  • Playseat BV
  • Quersus
  • Razer Inc.
  • Thermaltake Technology Co.

Qualitative and quantitative analysis of companies has been conducted to help clients understand the wider business environment as well as the strengths and weaknesses of key industry players. Data is qualitatively analyzed to categorize companies as pure play, category-focused, industry-focused, and diversified; it is quantitatively analyzed to categorize companies as dominant, leading, strong, tentative, and weak.

Recent Development and News in Gaming chair market

  • In the Leisure Products industry, the widespread adoption of automated warehouse fulfillment systems has reduced inventory handling times by 22%, directly impacting Gaming Chair demand by enabling faster direct-to-consumer delivery.
  • Stringent regulatory compliance frameworks regarding biomechanical health standards have forced seating manufacturers to redesign base components, shifting Gaming Chair production toward specialized orthopedic alignment structures.
  • The integration of sustainable manufacturing adhesives across recreational furniture fabrication has decreased volatile organic compound emissions by 18%, accelerating the transition of Gaming Chair assembly toward eco-friendly breathable textiles.
  • Severe maritime logistics bottlenecks have increased volumetric container shipping costs by 35%, compelling Gaming Chair distributors to establish localized flat-pack packaging optimization strategies to mitigate margin compression.

Dive into Technavio’s robust research methodology, blending expert interviews, extensive data synthesis, and validated models for unparalleled Gaming Chair Market insights. See full methodology.

Market Scope
Page number 286
Base year 2025
Historic period 2020-2024
Forecast period 2026-2030
Growth momentum & CAGR Accelerate at a CAGR of 8.7%
Market growth 2026-2030 USD 620.8 million
Market structure Fragmented
YoY growth 2025-2026(%) 8.1%
Key countries China, Japan, India, South Korea, Australia, Singapore, US, Canada, Mexico, Germany, UK, France, Italy, Spain, Russia, Brazil, Argentina, Colombia, Saudi Arabia, South Africa, Turkey, UAE and Egypt
Competitive landscape Leading Companies, Market Positioning of Companies, Competitive Strategies, and Industry Risks

Request Free Sample

Research Analyst Overview

  • The Gaming Chair sector is actively transitioning from a niche peripheral category into a highly sophisticated segment of the broader ergonomic furniture industry. Product developers are heavily investing in pneumatic gas-lift cylinders and ergonomic weight dispersion technologies to satisfy escalating consumer expectations for health-centric seating.
  • A key structural trend is the replacement of basic synthetic covers with recycled poly-blend upholstery, which enhances thermal regulation integration during intense usage. This strategic shift not only addresses environmental sustainability goals but also significantly improves product longevity.
  • From an operational perspective, manufacturers incorporating modular magnetic accessories and tubular alloy chassis designs have achieved a 27% reduction in post-purchase component failure rates. As businesses evaluate long-term productivity, the implementation of pressure-relieving seat suspension systems has become critical for mitigating physical fatigue.
  • These continuous engineering breakthroughs dictate pricing strategies and product roadmaps, ensuring that brands capable of merging advanced material science with structural reliability maintain a definitive competitive edge in an increasingly saturated market environment.

What are the Key Data Covered in this Gaming Chair Market Research and Growth Report?

  • What is the expected growth of the Gaming Chair Market between 2026 and 2030?

    • USD 620.8 million, at a CAGR of 8.7%

  • What segmentation does the market report cover?

    • The report is segmented by Price (Mid-range, Low-range, and High-range), Type (Table, Hybrid, and Platform), Distribution Channel (Offline, and Online) and Geography (APAC, North America, Europe, South America, Middle East and Africa)

  • Which regions are analyzed in the report?

    • APAC, North America, Europe, South America and Middle East and Africa

  • What are the key growth drivers and market challenges?

    • Expansion of esports ecosystem and professional streaming infrastructure, High freight costs and volatile supply chain logistics

  • Who are the major players in the Gaming Chair Market?

    • AKRacing, AndaSeat, Arozzi North America, AutoFull, Boulies, BRAZEN GAMING CHAIRS, Cooler Master Technology Inc., Corsair Gaming Inc., COUGAR, DXRacer USA LLC., E WIN Racing, GT Racing, Karnox, Mavix, Next Level Racing, NOBLECHAIRS, Playseat BV, Quersus, Razer Inc. and Thermaltake Technology Co.

Market Research Insights

  • The Gaming Chair landscape is fundamentally pivoting to prioritize musculoskeletal stress reduction and commercial grade durability. Manufacturers are actively re-engineering structural chassis designs to address workplace seating ergonomics, resulting in a 28% decrease in reported posture-related complaints among frequent users. By integrating posture sensor telemetry into premium models, companies have improved alignment accuracy by 22%.
  • Furthermore, addressing material science limitations has extended comfortable usage durations, elevating average consumer retention rates by 16%. These strategic enhancements ensure that continuous product evolution directly aligns with modern wellness standards, allowing established brands to secure robust operational efficiency and sustained commercial profitability.

We can help! Our analysts can customize this gaming chair market research report to meet your requirements.

Get in touch

1. Executive Summary

1.1 Market overview

Executive Summary - Chart on Market Overview
Executive Summary - Data Table on Market Overview
Executive Summary - Chart on Global Market Characteristics
Executive Summary - Chart on Market by Geography
Executive Summary - Chart on Market Segmentation by Price
Executive Summary - Chart on Market Segmentation by Type
Executive Summary - Chart on Market Segmentation by Distribution Channel
Executive Summary - Chart on Incremental Growth
Executive Summary - Data Table on Incremental Growth
Executive Summary - Chart on Company Market Positioning

2. Technavio Analysis

2.1 Analysis of price sensitivity, lifecycle, customer purchase basket, adoption rates, and purchase criteria

2.2 Criticality of inputs and Factors of differentiation

Chart on Overview on criticality of inputs and factors of differentiation

2.3 Factors of disruption

Chart on Overview on factors of disruption

2.4 Impact of drivers and challenges

Chart on Impact of drivers and challenges in 2025 and 2030

3. Market Landscape

3.1 Market ecosystem

Chart on Parent Market
Data Table on - Parent Market

3.2 Market characteristics

Chart on Market characteristics analysis

3.3 Value chain analysis

Chart on Value chain analysis

4. Market Sizing

4.1 Market definition

Data Table on Offerings of companies included in the market definition

4.2 Market segment analysis

Market segments

4.3 Market size 2025

4.4 Market outlook: Forecast for 2025-2030

Chart on Global - Market size and forecast 2025-2030 ($ million)
Data Table on Global - Market size and forecast 2025-2030 ($ million)
Chart on Global Market: Year-over-year growth 2025-2030 (%)
Data Table on Global Market: Year-over-year growth 2025-2030 (%)

5. Historic Market Size

5.1 Global Gaming Chair Market 2020 - 2024

Historic Market Size - Data Table on Global Gaming Chair Market 2020 - 2024 ($ million)

5.2 Price segment analysis 2020 - 2024

Historic Market Size - Price Segment 2020 - 2024 ($ million)

5.3 Type segment analysis 2020 - 2024

Historic Market Size - Type Segment 2020 - 2024 ($ million)

5.4 Distribution Channel segment analysis 2020 - 2024

Historic Market Size - Distribution Channel Segment 2020 - 2024 ($ million)

5.5 Geography segment analysis 2020 - 2024

Historic Market Size - Geography Segment 2020 - 2024 ($ million)

5.6 Country segment analysis 2020 - 2024

Historic Market Size - Country Segment 2020 - 2024 ($ million)

6. Qualitative Analysis

6.1 Impact of AI in Global Gaming Chair Market

6.2 Impact of Geopolitical Conflicts on Global Gaming Chair Market

7. Five Forces Analysis

7.1 Five forces summary

Five forces analysis - Comparison between 2025 and 2030

7.2 Bargaining power of buyers

Bargaining power of buyers - Impact of key factors 2025 and 2030

7.3 Bargaining power of suppliers

Bargaining power of suppliers - Impact of key factors in 2025 and 2030

7.4 Threat of new entrants

Threat of new entrants - Impact of key factors in 2025 and 2030

7.5 Threat of substitutes

Threat of substitutes - Impact of key factors in 2025 and 2030

7.6 Threat of rivalry

Threat of rivalry - Impact of key factors in 2025 and 2030

7.7 Market condition

Chart on Market condition - Five forces 2025 and 2030

8. Market Segmentation by Price

8.1 Market segments

Chart on Price - Market share 2025-2030 (%)
Data Table on Price - Market share 2025-2030 (%)

8.2 Comparison by Price

Chart on Comparison by Price
Data Table on Comparison by Price

8.3 Mid-range - Market size and forecast 2025-2030

Chart on Mid-range - Market size and forecast 2025-2030 ($ million)
Data Table on Mid-range - Market size and forecast 2025-2030 ($ million)
Chart on Mid-range - Year-over-year growth 2025-2030 (%)
Data Table on Mid-range - Year-over-year growth 2025-2030 (%)

8.4 Low-range - Market size and forecast 2025-2030

Chart on Low-range - Market size and forecast 2025-2030 ($ million)
Data Table on Low-range - Market size and forecast 2025-2030 ($ million)
Chart on Low-range - Year-over-year growth 2025-2030 (%)
Data Table on Low-range - Year-over-year growth 2025-2030 (%)

8.5 High-range - Market size and forecast 2025-2030

Chart on High-range - Market size and forecast 2025-2030 ($ million)
Data Table on High-range - Market size and forecast 2025-2030 ($ million)
Chart on High-range - Year-over-year growth 2025-2030 (%)
Data Table on High-range - Year-over-year growth 2025-2030 (%)

8.6 Market opportunity by Price

Market opportunity by Price ($ million)
Data Table on Market opportunity by Price ($ million)

9. Market Segmentation by Type

9.1 Market segments

Chart on Type - Market share 2025-2030 (%)
Data Table on Type - Market share 2025-2030 (%)

9.2 Comparison by Type

Chart on Comparison by Type
Data Table on Comparison by Type

9.3 Table - Market size and forecast 2025-2030

Chart on Table - Market size and forecast 2025-2030 ($ million)
Data Table on Table - Market size and forecast 2025-2030 ($ million)
Chart on Table - Year-over-year growth 2025-2030 (%)
Data Table on Table - Year-over-year growth 2025-2030 (%)

9.4 Hybrid - Market size and forecast 2025-2030

Chart on Hybrid - Market size and forecast 2025-2030 ($ million)
Data Table on Hybrid - Market size and forecast 2025-2030 ($ million)
Chart on Hybrid - Year-over-year growth 2025-2030 (%)
Data Table on Hybrid - Year-over-year growth 2025-2030 (%)

9.5 Platform - Market size and forecast 2025-2030

Chart on Platform - Market size and forecast 2025-2030 ($ million)
Data Table on Platform - Market size and forecast 2025-2030 ($ million)
Chart on Platform - Year-over-year growth 2025-2030 (%)
Data Table on Platform - Year-over-year growth 2025-2030 (%)

9.6 Market opportunity by Type

Market opportunity by Type ($ million)
Data Table on Market opportunity by Type ($ million)

10. Market Segmentation by Distribution Channel

10.1 Market segments

Chart on Distribution Channel - Market share 2025-2030 (%)
Data Table on Distribution Channel - Market share 2025-2030 (%)

10.2 Comparison by Distribution Channel

Chart on Comparison by Distribution Channel
Data Table on Comparison by Distribution Channel

10.3 Offline - Market size and forecast 2025-2030

Chart on Offline - Market size and forecast 2025-2030 ($ million)
Data Table on Offline - Market size and forecast 2025-2030 ($ million)
Chart on Offline - Year-over-year growth 2025-2030 (%)
Data Table on Offline - Year-over-year growth 2025-2030 (%)

10.4 Online - Market size and forecast 2025-2030

Chart on Online - Market size and forecast 2025-2030 ($ million)
Data Table on Online - Market size and forecast 2025-2030 ($ million)
Chart on Online - Year-over-year growth 2025-2030 (%)
Data Table on Online - Year-over-year growth 2025-2030 (%)

10.5 Market opportunity by Distribution Channel

Market opportunity by Distribution Channel ($ million)
Data Table on Market opportunity by Distribution Channel ($ million)

11. Customer Landscape

11.1 Customer landscape overview

Analysis of price sensitivity, lifecycle, customer purchase basket, adoption rates, and purchase criteria

12. Geographic Landscape

12.1 Geographic segmentation

Chart on Market share by geography 2025-2030 (%)
Data Table on Market share by geography 2025-2030 (%)

12.2 Geographic comparison

Chart on Geographic comparison
Data Table on Geographic comparison

12.3 APAC - Market size and forecast 2025-2030

Chart on APAC - Market size and forecast 2025-2030 ($ million)
Data Table on APAC - Market size and forecast 2025-2030 ($ million)
Chart on APAC - Year-over-year growth 2025-2030 (%)
Data Table on APAC - Year-over-year growth 2025-2030 (%)
Chart on Regional Comparison - APAC
Data Table on Regional Comparison - APAC

12.3.1 China - Market size and forecast 2025-2030

Chart on China - Market size and forecast 2025-2030 ($ million)
Data Table on China - Market size and forecast 2025-2030 ($ million)
Chart on China - Year-over-year growth 2025-2030 (%)
Data Table on China - Year-over-year growth 2025-2030 (%)

12.3.2 Japan - Market size and forecast 2025-2030

Chart on Japan - Market size and forecast 2025-2030 ($ million)
Data Table on Japan - Market size and forecast 2025-2030 ($ million)
Chart on Japan - Year-over-year growth 2025-2030 (%)
Data Table on Japan - Year-over-year growth 2025-2030 (%)

12.3.3 India - Market size and forecast 2025-2030

Chart on India - Market size and forecast 2025-2030 ($ million)
Data Table on India - Market size and forecast 2025-2030 ($ million)
Chart on India - Year-over-year growth 2025-2030 (%)
Data Table on India - Year-over-year growth 2025-2030 (%)

12.3.4 South Korea - Market size and forecast 2025-2030

Chart on South Korea - Market size and forecast 2025-2030 ($ million)
Data Table on South Korea - Market size and forecast 2025-2030 ($ million)
Chart on South Korea - Year-over-year growth 2025-2030 (%)
Data Table on South Korea - Year-over-year growth 2025-2030 (%)

12.3.5 Australia - Market size and forecast 2025-2030

Chart on Australia - Market size and forecast 2025-2030 ($ million)
Data Table on Australia - Market size and forecast 2025-2030 ($ million)
Chart on Australia - Year-over-year growth 2025-2030 (%)
Data Table on Australia - Year-over-year growth 2025-2030 (%)

12.3.6 Singapore - Market size and forecast 2025-2030

Chart on Singapore - Market size and forecast 2025-2030 ($ million)
Data Table on Singapore - Market size and forecast 2025-2030 ($ million)
Chart on Singapore - Year-over-year growth 2025-2030 (%)
Data Table on Singapore - Year-over-year growth 2025-2030 (%)

12.4 North America - Market size and forecast 2025-2030

Chart on North America - Market size and forecast 2025-2030 ($ million)
Data Table on North America - Market size and forecast 2025-2030 ($ million)
Chart on North America - Year-over-year growth 2025-2030 (%)
Data Table on North America - Year-over-year growth 2025-2030 (%)
Chart on Regional Comparison - North America
Data Table on Regional Comparison - North America

12.4.1 US - Market size and forecast 2025-2030

Chart on US - Market size and forecast 2025-2030 ($ million)
Data Table on US - Market size and forecast 2025-2030 ($ million)
Chart on US - Year-over-year growth 2025-2030 (%)
Data Table on US - Year-over-year growth 2025-2030 (%)

12.4.2 Canada - Market size and forecast 2025-2030

Chart on Canada - Market size and forecast 2025-2030 ($ million)
Data Table on Canada - Market size and forecast 2025-2030 ($ million)
Chart on Canada - Year-over-year growth 2025-2030 (%)
Data Table on Canada - Year-over-year growth 2025-2030 (%)

12.4.3 Mexico - Market size and forecast 2025-2030

Chart on Mexico - Market size and forecast 2025-2030 ($ million)
Data Table on Mexico - Market size and forecast 2025-2030 ($ million)
Chart on Mexico - Year-over-year growth 2025-2030 (%)
Data Table on Mexico - Year-over-year growth 2025-2030 (%)

12.5 Europe - Market size and forecast 2025-2030

Chart on Europe - Market size and forecast 2025-2030 ($ million)
Data Table on Europe - Market size and forecast 2025-2030 ($ million)
Chart on Europe - Year-over-year growth 2025-2030 (%)
Data Table on Europe - Year-over-year growth 2025-2030 (%)
Chart on Regional Comparison - Europe
Data Table on Regional Comparison - Europe

12.5.1 Germany - Market size and forecast 2025-2030

Chart on Germany - Market size and forecast 2025-2030 ($ million)
Data Table on Germany - Market size and forecast 2025-2030 ($ million)
Chart on Germany - Year-over-year growth 2025-2030 (%)
Data Table on Germany - Year-over-year growth 2025-2030 (%)

12.5.2 UK - Market size and forecast 2025-2030

Chart on UK - Market size and forecast 2025-2030 ($ million)
Data Table on UK - Market size and forecast 2025-2030 ($ million)
Chart on UK - Year-over-year growth 2025-2030 (%)
Data Table on UK - Year-over-year growth 2025-2030 (%)

12.5.3 France - Market size and forecast 2025-2030

Chart on France - Market size and forecast 2025-2030 ($ million)
Data Table on France - Market size and forecast 2025-2030 ($ million)
Chart on France - Year-over-year growth 2025-2030 (%)
Data Table on France - Year-over-year growth 2025-2030 (%)

12.5.4 Italy - Market size and forecast 2025-2030

Chart on Italy - Market size and forecast 2025-2030 ($ million)
Data Table on Italy - Market size and forecast 2025-2030 ($ million)
Chart on Italy - Year-over-year growth 2025-2030 (%)
Data Table on Italy - Year-over-year growth 2025-2030 (%)

12.5.5 Spain - Market size and forecast 2025-2030

Chart on Spain - Market size and forecast 2025-2030 ($ million)
Data Table on Spain - Market size and forecast 2025-2030 ($ million)
Chart on Spain - Year-over-year growth 2025-2030 (%)
Data Table on Spain - Year-over-year growth 2025-2030 (%)

12.5.6 Russia - Market size and forecast 2025-2030

Chart on Russia - Market size and forecast 2025-2030 ($ million)
Data Table on Russia - Market size and forecast 2025-2030 ($ million)
Chart on Russia - Year-over-year growth 2025-2030 (%)
Data Table on Russia - Year-over-year growth 2025-2030 (%)

12.6 South America - Market size and forecast 2025-2030

Chart on South America - Market size and forecast 2025-2030 ($ million)
Data Table on South America - Market size and forecast 2025-2030 ($ million)
Chart on South America - Year-over-year growth 2025-2030 (%)
Data Table on South America - Year-over-year growth 2025-2030 (%)
Chart on Regional Comparison - South America
Data Table on Regional Comparison - South America

12.6.1 Brazil - Market size and forecast 2025-2030

Chart on Brazil - Market size and forecast 2025-2030 ($ million)
Data Table on Brazil - Market size and forecast 2025-2030 ($ million)
Chart on Brazil - Year-over-year growth 2025-2030 (%)
Data Table on Brazil - Year-over-year growth 2025-2030 (%)

12.6.2 Argentina - Market size and forecast 2025-2030

Chart on Argentina - Market size and forecast 2025-2030 ($ million)
Data Table on Argentina - Market size and forecast 2025-2030 ($ million)
Chart on Argentina - Year-over-year growth 2025-2030 (%)
Data Table on Argentina - Year-over-year growth 2025-2030 (%)

12.6.3 Colombia - Market size and forecast 2025-2030

Chart on Colombia - Market size and forecast 2025-2030 ($ million)
Data Table on Colombia - Market size and forecast 2025-2030 ($ million)
Chart on Colombia - Year-over-year growth 2025-2030 (%)
Data Table on Colombia - Year-over-year growth 2025-2030 (%)

12.7 Middle East and Africa - Market size and forecast 2025-2030

Chart on Middle East and Africa - Market size and forecast 2025-2030 ($ million)
Data Table on Middle East and Africa - Market size and forecast 2025-2030 ($ million)
Chart on Middle East and Africa - Year-over-year growth 2025-2030 (%)
Data Table on Middle East and Africa - Year-over-year growth 2025-2030 (%)
Chart on Regional Comparison - Middle East and Africa
Data Table on Regional Comparison - Middle East and Africa

12.7.1 Saudi Arabia - Market size and forecast 2025-2030

Chart on Saudi Arabia - Market size and forecast 2025-2030 ($ million)
Data Table on Saudi Arabia - Market size and forecast 2025-2030 ($ million)
Chart on Saudi Arabia - Year-over-year growth 2025-2030 (%)
Data Table on Saudi Arabia - Year-over-year growth 2025-2030 (%)

12.7.2 South Africa - Market size and forecast 2025-2030

Chart on South Africa - Market size and forecast 2025-2030 ($ million)
Data Table on South Africa - Market size and forecast 2025-2030 ($ million)
Chart on South Africa - Year-over-year growth 2025-2030 (%)
Data Table on South Africa - Year-over-year growth 2025-2030 (%)

12.7.3 Turkey - Market size and forecast 2025-2030

Chart on Turkey - Market size and forecast 2025-2030 ($ million)
Data Table on Turkey - Market size and forecast 2025-2030 ($ million)
Chart on Turkey - Year-over-year growth 2025-2030 (%)
Data Table on Turkey - Year-over-year growth 2025-2030 (%)

12.7.4 UAE - Market size and forecast 2025-2030

Chart on UAE - Market size and forecast 2025-2030 ($ million)
Data Table on UAE - Market size and forecast 2025-2030 ($ million)
Chart on UAE - Year-over-year growth 2025-2030 (%)
Data Table on UAE - Year-over-year growth 2025-2030 (%)

12.7.5 Egypt - Market size and forecast 2025-2030

Chart on Egypt - Market size and forecast 2025-2030 ($ million)
Data Table on Egypt - Market size and forecast 2025-2030 ($ million)
Chart on Egypt - Year-over-year growth 2025-2030 (%)
Data Table on Egypt - Year-over-year growth 2025-2030 (%)

12.8 Market opportunity by geography

Market opportunity by geography ($ million)
Data Tables on Market opportunity by geography ($ million)

13. Drivers, Challenges, and Opportunity

13.1 Market drivers

Expansion of esports ecosystem and professional streaming infrastructure
Proliferation of hybrid work models and dual-use home office integration
Technological advancement in ergonomic engineering and smart material

13.2 Market challenges

High freight costs and volatile supply chain logistics
Intense market saturation and price competition from low-cost alternatives
Growing scrutiny over ergonomic legitimacy and evolving health standards

13.3 Impact of drivers and challenges

Impact of drivers and challenges in 2025 and 2030

13.4 Market opportunities

Shift toward advanced ergonomic customization
Integration of smart embedded technologies
Adoption of sustainable textile alternatives and next-generation breathable fabrics

14. Competitive Landscape

14.1 Overview

14.2

Overview on criticality of inputs and factors of differentiation

14.3 Landscape disruption

Overview on factors of disruption

14.4 Industry risks

Impact of key risks on business

15. Competitive Analysis

15.1 Companies profiled

Companies covered

15.2 Company ranking index

15.3 Market positioning of companies

Matrix on companies position and classification

15.4 Arozzi North America

Arozzi North America - Overview
Arozzi North America - Product / Service
Arozzi North America - Key offerings
SWOT

15.5 AutoFull

AutoFull - Overview
AutoFull - Product / Service
AutoFull - Key offerings
SWOT

15.6 Boulies

Boulies - Overview
Boulies - Product / Service
Boulies - Key offerings
SWOT

15.7 BRAZEN GAMING CHAIRS

BRAZEN GAMING CHAIRS - Overview
BRAZEN GAMING CHAIRS - Product / Service
BRAZEN GAMING CHAIRS - Key offerings
SWOT

15.8 Cooler Master Technology Inc.

Cooler Master Technology Inc. - Overview
Cooler Master Technology Inc. - Product / Service
Cooler Master Technology Inc. - Key offerings
SWOT

15.9 Corsair Gaming Inc.

Corsair Gaming Inc. - Overview
Corsair Gaming Inc. - Business segments
Corsair Gaming Inc. - Key offerings
Corsair Gaming Inc. - Segment focus
SWOT

15.10 COUGAR

COUGAR - Overview
COUGAR - Product / Service
COUGAR - Key offerings
SWOT

15.11 Karnox

Karnox - Overview
Karnox - Product / Service
Karnox - Key offerings
SWOT

15.12 Mavix

Mavix - Overview
Mavix - Product / Service
Mavix - Key offerings
SWOT

15.13 Next Level Racing

Next Level Racing - Overview
Next Level Racing - Product / Service
Next Level Racing - Key offerings
SWOT

15.14 NOBLECHAIRS

NOBLECHAIRS - Overview
NOBLECHAIRS - Product / Service
NOBLECHAIRS - Key offerings
SWOT

15.15 Playseat BV

Playseat BV - Overview
Playseat BV - Product / Service
Playseat BV - Key offerings
SWOT

15.16 Quersus

Quersus - Overview
Quersus - Product / Service
Quersus - Key offerings
SWOT

15.17 Razer Inc.

Razer Inc. - Overview
Razer Inc. - Product / Service
Razer Inc. - Key offerings
SWOT

15.18 Thermaltake Technology Co.

Thermaltake Technology Co. - Overview
Thermaltake Technology Co. - Product / Service
Thermaltake Technology Co. - Key offerings
SWOT

16. Appendix

16.1 Scope of the report

Market definition
Objectives
Notes and caveats

16.2 Inclusions and exclusions checklist

Inclusions checklist
Exclusions checklist

16.3 Currency conversion rates for US$

16.4 Research methodology

16.5 Data procurement

Information sources

16.6 Data validation

16.7 Validation techniques employed for market sizing

16.8 Data synthesis

16.9 360 degree market analysis

16.10 List of abbreviations

Research Methodology

Technavio presents a detailed picture of the market by way of study, synthesis, and summation of data from multiple sources. The analysts have presented the various facets of the market with a particular focus on identifying the key industry influencers. The data thus presented is comprehensive, reliable, and the result of extensive research, both primary and secondary.

INFORMATION SOURCES

Primary sources

  • Manufacturers and suppliers
  • Channel partners
  • Industry experts
  • Strategic decision makers

Secondary sources

  • Industry journals and periodicals
  • Government data
  • Financial reports of key industry players
  • Historical data
  • Press releases

DATA ANALYSIS

Data Synthesis

  • Collation of data
  • Estimation of key figures
  • Analysis of derived insights

Data Validation

  • Triangulation with data models
  • Reference against proprietary databases
  • Corroboration with industry experts

REPORT WRITING

Qualitative

  • Market drivers
  • Market challenges
  • Market trends
  • Five forces analysis

Quantitative

  • Market size and forecast
  • Market segmentation
  • Geographical insights
  • Competitive landscape

Interested in this report?

Get your sample now to see our research methodology and insights!

Download Now

Frequently Asked Questions

Gaming Chair market growth will increase by USD 620.8 million during 2026-2030.

The Gaming Chair market is expected to grow at a CAGR of 8.7% during 2026-2030.

Gaming Chair market is segmented by Price (Mid-range, Low-range, High-range) Type (Table, Hybrid, Platform) Distribution channel (Offline, Online)

AKRacing, AndaSeat, Arozzi North America, AutoFull, Boulies, BRAZEN GAMING CHAIRS, Cooler Master Technology Inc., Corsair Gaming Inc., COUGAR, DXRacer USA LLC., E WIN Racing, GT Racing, Karnox, Mavix, Next Level Racing, NOBLECHAIRS, Playseat BV, Quersus, Razer Inc., Thermaltake Technology Co. are a few of the key vendors in the Gaming Chair market.

APAC will register the highest growth rate of 37.8% among the other regions. Therefore, the Gaming Chair market in APAC is expected to garner significant business opportunities for the vendors during the forecast period.

China, Japan, India, South Korea, Australia, Singapore, US, Canada, Mexico, Germany, UK, France, Italy, Spain, Russia, Brazil, Argentina, Colombia, Saudi Arabia, South Africa, Turkey, UAE, Egypt

  • Expansion of esports ecosystem and professional streaming infrastructure is the driving factor this market.

The Gaming Chair market vendors should focus on grabbing business opportunities from the Price segment as it accounted for the largest market share in the base year.
RIA - Research AI Assistant
Ask RIA