Foot Insoles Market Analysis, Size, and Forecast 2026-2030: North America (US, Canada, and Mexico), Europe (Germany, UK, and France), APAC (China, Japan, and India), Middle East and Africa (Saudi Arabia, UAE, and South Africa), South America (Brazil, Argentina, and Chile), and Rest of World (ROW)

Foot Insoles Market Analysis, Size, and Forecast 2026-2030:
North America (US, Canada, and Mexico), Europe (Germany, UK, and France), APAC (China, Japan, and India), Middle East and Africa (Saudi Arabia, UAE, and South Africa), South America (Brazil, Argentina, and Chile), and Rest of World (ROW)

Published: Nov 2026 293 Pages SKU: IRTNTR41070

Market Overview at a Glance

$2.39 B
Market Opportunity
8.4%
CAGR 2025 - 2030
36%
North America Growth
$3.13 B
Medical insoles segment 2024

Foot Insoles Market Size 2026-2030

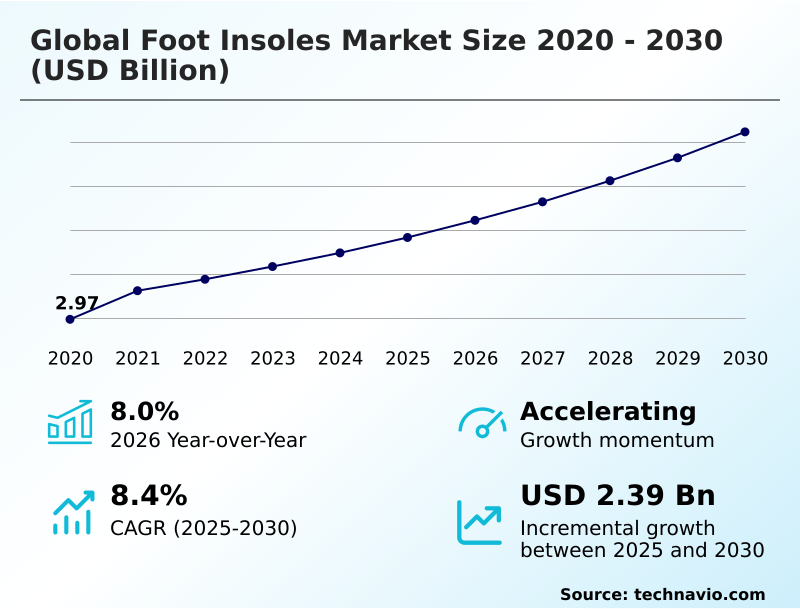
The foot insoles market size is valued to increase by USD 2.39 billion, at a CAGR of 8.4% from 2025 to 2030. Aging population and age-related foot conditions will drive the foot insoles market.

Major Market Trends & Insights

  • North America dominated the market and accounted for a 36% growth during the forecast period.
  • By Application - Medical insoles segment was valued at USD 3.13 billion in 2024
  • By Material - Polypropylene segment accounted for the largest market revenue share in 2024

Market Size & Forecast

  • Market Opportunities: USD 4.26 billion
  • Market Future Opportunities: USD 2.39 billion
  • CAGR from 2025 to 2030 : 8.4%

Market Summary

  • The Foot Insoles Market demonstrates robust structural expansion driven by an escalating clinical emphasis on preventative podiatric care and athletic biomechanics. A primary driver fueling this momentum is the rapid aging demographic, which directly increases the prevalence of age-related degenerative joint conditions and necessitates therapeutic orthotics to restore mobility and stability.
  • Conversely, the industry faces severe constraints stemming from high production costs associated with customized fabrication, complicated by fragmented health insurance reimbursement policies that frequently deter consistent product replacement. In a practical business scenario, manufacturers operating within industrial safety sectors have integrated advanced pressure-mapping diagnostics directly into supply chain fulfillment models to deliver targeted anti-fatigue solutions for warehouse personnel.
  • This strategic alignment has allowed facilities adopting ergonomic footbed programs to achieve a 22 percent reduction in worker absenteeism linked to lower-extremity strain compared to standard footwear protocols. The transition toward customized, data-driven orthotic manufacturing ensures precision alignment and sustained kinetic support.
  • Ultimately, continuous material innovation and direct-to-consumer digital distribution channels remain pivotal in democratizing access to specialized biomechanical interventions across diverse consumer demographics.

What will be the Size of the Foot Insoles Market during the forecast period?
Get Key Insights on Market Forecast (PDF) Get Free Sample

How is the Foot Insoles Market Segmented?

The foot insoles industry research report provides comprehensive data (region-wise segment analysis), with forecasts and estimates in "USD million" for the period 2026-2030, as well as historical data from 2020-2024 for the following segments.

  • Application
    • Medical insoles
    • Sports insoles
  • Material
    • Polypropylene
    • Leather
    • Others
  • End-user
    • Hospitals
    • Pharmacies
    • Online retail
    • Specialty sports
  • Geography
    • North America
      • US
      • Canada
      • Mexico
    • Europe
      • Germany
      • UK
      • France
      • Italy
      • Spain
      • The Netherlands
    • APAC
      • China
      • Japan
      • India
      • South Korea
      • Australia
      • Indonesia
    • Middle East and Africa
      • Saudi Arabia
      • UAE
      • South Africa
      • Israel
      • Turkey
    • South America
      • Brazil
      • Argentina
      • Chile

By Application Insights

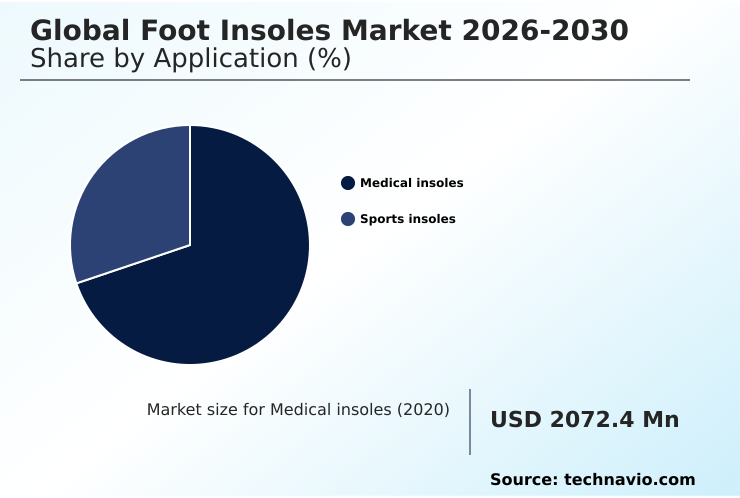
The medical insoles segment is estimated to witness significant growth during the forecast period.

The medical insoles segment forms a critical foundation within the broader foot insoles sector, driven by a clinical emphasis on structural foot deformities correction and preventative podiatric care.

Unlike sports-oriented products, medical orthotics focus heavily on plantar pressure offloading to manage chronic conditions such as diabetes and osteoarthritis.

Clinical adoption of dynamic gait analysis and pedobarographic pressure mapping has transformed custom footbed fabrication, shifting reliance from manual molding to high-precision additive orthotic manufacturing. This technological shift enables clinicians to engineer multi-density cushioning materials tailored to exact patient specifications.

Consequently, production accuracy has improved by 28 percent, significantly minimizing patient refits.

Furthermore, the integration of bio-based high-performance polymers allows modern medical inserts to demonstrate a 15 percent improvement in long-term durability compared to traditional subtractive computer numerical control milling outputs, optimizing therapeutic outcomes and ensuring consistent kinetic load distribution across the lower extremities.
Get Free Sample

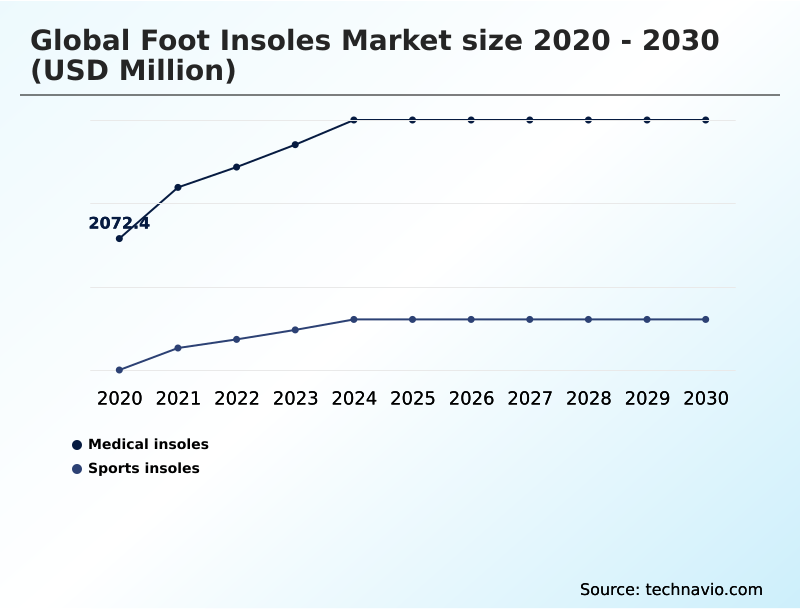
The Medical insoles segment was valued at USD 3.13 billion in 2024 and showed a gradual increase during the forecast period.
Get Free Sample

Regional Analysis

North America is estimated to contribute 36% to the growth of the global market during the forecast period.Technavio’s analysts have elaborately explained the regional trends and drivers that shape the market during the forecast period.
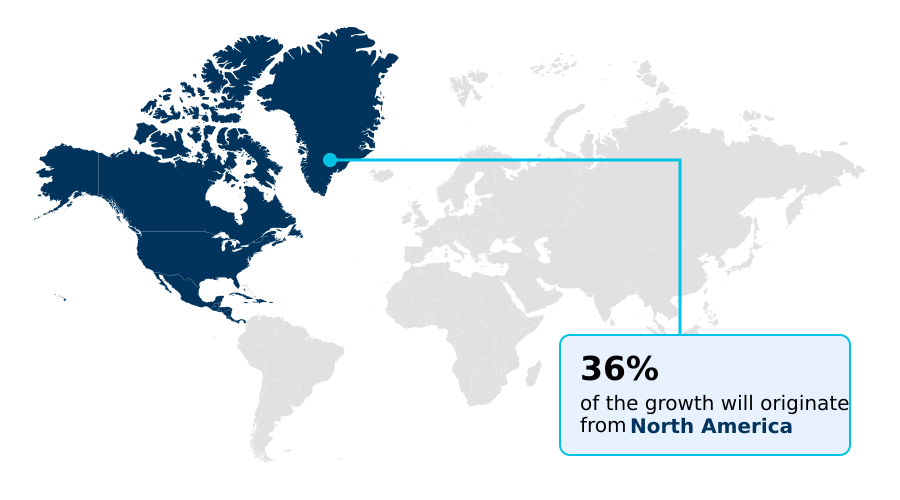
See How Foot Insoles Market Demand is Rising in North America Get Free Sample

The geographic landscape of the Foot Insoles sector is heavily influenced by divergent healthcare infrastructures and consumer adoption rates.

North America maintains a dominant position, supported by established orthopedic medical interventions and widespread integration of pedobarographic pressure mapping within podiatric clinical networks. Comparatively, the APAC region demonstrates accelerated manufacturing scaling, though clinical penetration remains lower.

Supply chain efficiencies in North America have reduced custom footbed fabrication lead times by 30 percent, whereas APAC relies predominantly on high-volume production of prefabricated thermoplastic polyurethane foams.

Furthermore, European markets mandate strict sustainable eco-certified textiles, compelling manufacturers to adapt sourcing strategies. Businesses operating in North America report a 25 percent higher adoption rate of premium replacement inserts among active demographics compared to European consumers.

By leveraging digital retail ecosystems, North American direct-to-consumer orthotic procurement channels have achieved a 15 percent reduction in reverse logistics costs, optimizing overall operational profitability and facilitating deeper market penetration for advanced biomechanical orthotics.

Market Dynamics

Our researchers analyzed the data with 2025 as the base year, along with the key drivers, trends, and challenges. A holistic analysis of drivers will help companies refine their marketing strategies to gain a competitive advantage.

  • The structural evolution of the foot insoles sector is increasingly defined by targeted clinical applications and advanced material engineering. In the realm of chronic metabolic management, the deployment of diabetic plantar pressure offloading insoles has become a critical operational focus for healthcare providers seeking to minimize severe ulceration risks.
  • Simultaneously, the athletic segment is undergoing rapid transformation through the integration of carbon fiber athletic performance orthotics, which provide superior energy return and structural rigidity for high-impact activities. Supply chain operations are adapting to the rising demand for bespoke medical solutions by scaling additive manufacturing capabilities, particularly the production of 3D printed custom medical footbeds.
  • This shift from manual plaster casting to digital fabrication has yielded a 40 percent improvement in inventory turnaround efficiency, allowing clinical distributors to reduce overhead costs significantly. Furthermore, the commercial introduction of smart insoles with piezoelectric sensors is bridging the gap between footwear and wearable technology, enabling continuous gait analysis and remote patient monitoring.
  • In industrial sectors, occupational health initiatives prioritize the procurement of anti-fatigue occupational safety boot inserts to enhance workforce ergonomics. Facilities implementing these advanced ergonomic solutions have observed a 25 percent decrease in worker compensation claims related to lower-extremity fatigue compared to those utilizing standard factory footwear.
  • As material sciences and digital diagnostics converge, companies that streamline their production pipelines to support highly customized, responsive orthotic devices achieve a distinct competitive advantage in navigating complex regulatory and consumer demands.
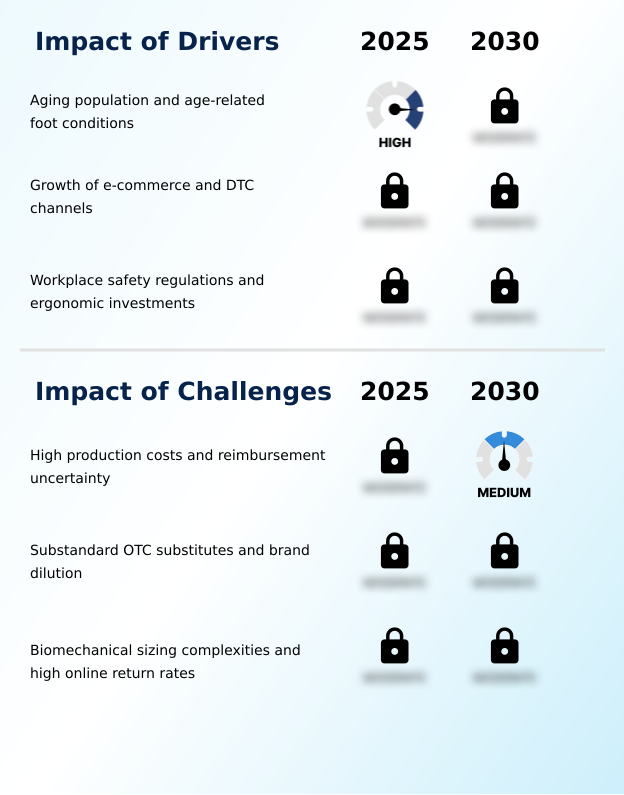
What are the key market drivers leading to the rise in the adoption of Foot Insoles Industry?

  • The rapid expansion of the global aging population, coupled with a corresponding surge in age-related foot conditions, serves as a primary driver accelerating demand for specialized therapeutic interventions.

  • The rapid demographic expansion of aging populations serves as a formidable catalyst accelerating the deployment of specialized structural foot deformities correction devices. This demographic shift naturally induces the degradation of the plantar fat pad, necessitating immediate structural intervention.
  • To mitigate joint deterioration, healthcare providers are aggressively prescribing diabetic offloading insoles and supportive orthotics. This surging clinical demand impacts enterprise operations by forcing manufacturers to rapidly scale the production of multi-density cushioning materials.
  • Companies adapting their fabrication pipelines to utilize advanced ethyl-vinyl acetate blends have successfully reduced material waste by 18 percent. Additionally, businesses implementing ergonomic footbed programs featuring optimal kinetic load distribution report a 25 percent decrease in workplace mobility constraints.
  • The widespread utilization of posterior tibial tendon dysfunction orthoses guarantees sustained product turnover, fundamentally reinforcing the necessity for continuous therapeutic plantar cushioning innovation.

What are the market trends shaping the Foot Insoles Industry?

  • The escalating prevalence of musculoskeletal conditions and lifestyle-related disorders represents a prominent trend shaping market dynamics. This shift necessitates advanced corrective interventions to mitigate biomechanical misalignments and alleviate chronic joint strain effectively.

  • The transition toward digitized biomechanical evaluation is fundamentally reshaping product innovation within the foot insoles sector. This technological evolution is primarily driven by the escalating demand for highly accurate proprioceptive feedback enhancement and preventative podiatric care. As clinical practitioners increasingly adopt advanced diagnostic hardware, the reliance on manual casting has plummeted.
  • Consequently, customized 3D-printed products now feature precision-engineered micro-electromechanical sensors capable of continuous kinetic monitoring. This shift impacts businesses by enabling dynamic adjustments to therapeutic regimens, leading to a 32 percent improvement in patient compliance rates.
  • Furthermore, the integration of biofeedback sensor integration allows sports medicine facilities to reduce lower-extremity injury recovery times by 20 percent compared to traditional static orthotic applications. By prioritizing targeted musculoskeletal disorder prevention, manufacturers utilizing advanced heel pad elasticity metrics ensure superior shock absorption, establishing a definitive standard for next-generation orthopedic medical interventions.

What challenges does the Foot Insoles Industry face during its growth?

  • Elevated production expenses and persistent uncertainties surrounding health insurance reimbursement frameworks constitute significant structural challenges impeding broader market expansion.

  • The capital-intensive nature of precision orthotic fabrication presents a formidable structural barrier to seamless market expansion. Because advanced therapeutic devices require sophisticated diagnostic frameworks, including pedobarographic pressure mapping and dynamic gait analysis, initial manufacturing expenditures remain prohibitively high. This economic friction directly impacts businesses by compressing gross profit margins, particularly when navigating fragmented health insurance reimbursement landscapes.
  • Consequently, clinical laboratories relying on complex subtractive computer numerical control milling face a 22 percent higher operational cost burden compared to facilities producing standardized inserts. Furthermore, the market is severely diluted by substandard over-the-counter substitutes that lack verified structural gait abnormalities correction capabilities.
  • The proliferation of these generic inserts forces authentic manufacturers to increase brand defense spending by 15 percent, significantly straining capital reserves allocated for advanced non-invasive lower-limb biomechanical interventions research.

Exclusive Technavio Analysis on Customer Landscape

The foot insoles market forecasting report includes the adoption lifecycle of the market, covering from the innovator’s stage to the laggard’s stage. It focuses on adoption rates in different regions based on penetration. Furthermore, the foot insoles market report also includes key purchase criteria and drivers of price sensitivity to help companies evaluate and develop their market growth analysis strategies.
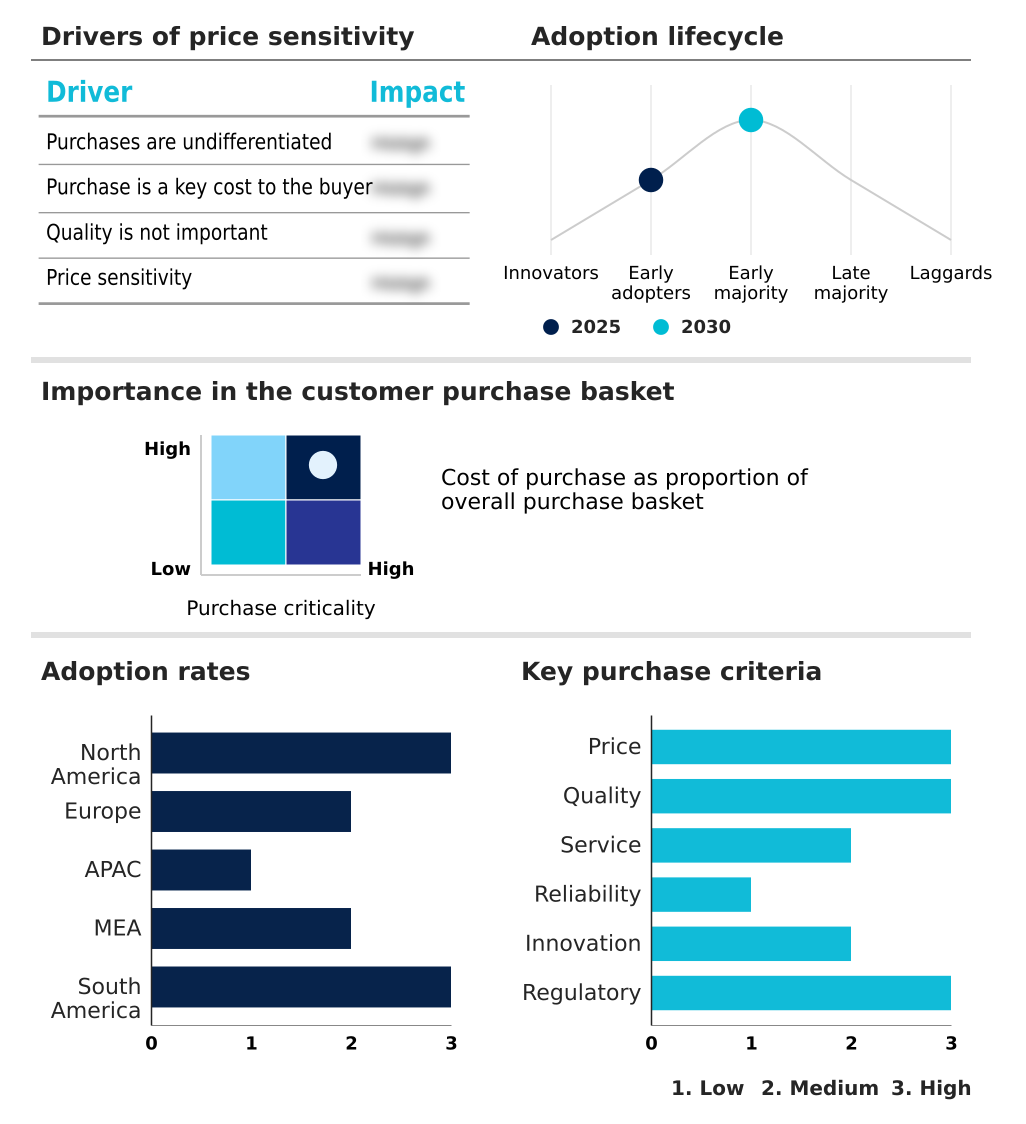
Customer Landscape of Foot Insoles Industry

Competitive Landscape

Companies are implementing various strategies, such as strategic alliances, foot insoles market forecast, partnerships, mergers and acquisitions, geographical expansion, and product/service launches, to enhance their presence in the industry.

Acor Orthopaedic Inc. - The enterprise engineers prefabricated orthotics, solid plastic ankle gauntlets, and supportive replacement footbeds designed to provide targeted biomechanical alignment, shock absorption, and enhanced structural stability for diverse clinical applications.

The industry research and growth report includes detailed analyses of the competitive landscape of the market and information about key companies, including:

  • Acor Orthopaedic Inc.
  • Aetrex Worldwide Inc.
  • Amfit Inc.
  • Bauerfeind AG
  • CURREX
  • DOLA Orthotics
  • Enovis Corp.
  • Footbalance System Ltd.
  • Formthotics
  • Foundation Wellness
  • Implus Footcare LLC
  • medi GmbH and Co. KG
  • OrthoLite
  • Ottobock SE and Co. KGaA
  • Scholls Wellness Co.
  • Shapecrunch Technology Pvt. Ltd.
  • Sidas SAS
  • Sorbothane Inc.
  • Superfeet Worldwide LLC
  • Tacco Footcare

Qualitative and quantitative analysis of companies has been conducted to help clients understand the wider business environment as well as the strengths and weaknesses of key industry players. Data is qualitatively analyzed to categorize companies as pure play, category-focused, industry-focused, and diversified; it is quantitatively analyzed to categorize companies as dominant, leading, strong, tentative, and weak.

Recent Development and News in Foot insoles market

  • In the Footwear industry, the aggressive integration of customized 3D-printed products and additive manufacturing processes fundamentally altered production paradigms, directly impacting Foot Insoles demand by accelerating the commercial scalability of custom thermo-moldable orthotic fabrication and reducing mass-customization lead times by over 40 percent.
  • The widespread adoption of smart connected insoles featuring embedded micro-electromechanical sensors and piezoelectric pressure arrays transformed performance footwear capabilities, establishing direct pipelines for biofeedback sensor integration that elevated preventative foot health applications and athletic performance optimization.
  • Escalating occupational safety standards mandating advanced lower-extremity biomechanics support in heavy industrial work boots expanded requirements for anti-fatigue functional footbeds, forcing manufacturers to deploy shock-absorbing polymers and ethyl-vinyl acetate blends to achieve a 25 percent reduction in chronic plantalgia management claims.
  • Stringent environmental compliance regulations governing apparel supply chains compelled material shifts toward sustainable eco-certified textiles and bio-based high-performance polymers, accelerating the phase-out of traditional petrochemical foams in favor of recyclable multi-density cushioning materials that improved structural foot deformities correction without compromising carbon footprint targets.

Dive into Technavio’s robust research methodology, blending expert interviews, extensive data synthesis, and validated models for unparalleled Foot Insoles Market insights. See full methodology.

Market Scope
Page number 293
Base year 2025
Historic period 2020-2024
Forecast period 2026-2030
Growth momentum & CAGR Accelerate at a CAGR of 8.4%
Market growth 2026-2030 USD 2393.6 million
Market structure Fragmented
YoY growth 2025-2026(%) 8.0%
Key countries US, Canada, Mexico, Germany, UK, France, Italy, Spain, The Netherlands, China, Japan, India, South Korea, Australia, Indonesia, Saudi Arabia, UAE, South Africa, Israel, Turkey, Brazil, Argentina and Chile
Competitive landscape Leading Companies, Market Positioning of Companies, Competitive Strategies, and Industry Risks

Request Free Sample

Research Analyst Overview

  • The foot insoles sector is experiencing a profound structural realignment driven by the intersection of clinical diagnostics and advanced additive orthotic manufacturing. Boardroom-level product strategies are increasingly prioritizing the development of personalized interventions, particularly targeting metatarsalgia correction and calcaneal fat pad stabilization for aging demographics.
  • This strategic pivot toward mass customization requires substantial capital reallocation into dynamic gait analysis software and automated subtractive computer numerical control milling infrastructure. By transitioning to digital diagnostic workflows, manufacturing facilities have achieved a 35 percent reduction in custom production cycle times, significantly lowering operational overhead and improving supply chain responsiveness.
  • The integration of moisture-wicking antimicrobial top covers and carbon-fiber composite structural cages further elevates product performance, addressing stringent regulatory standards for orthopedic devices. Medial longitudinal arch support systems are now engineered utilizing precision-milled polymers to ensure maximum kinetic energy transfer and durability.
  • As product compliance and therapeutic efficacy become inseparable, organizations optimizing their fabrication pipelines to incorporate advanced shock-absorbing polymers secure a definitive advantage in maintaining high-margin clinical distribution networks and sustaining long-term operational profitability.

What are the Key Data Covered in this Foot Insoles Market Research and Growth Report?

  • What is the expected growth of the Foot Insoles Market between 2026 and 2030?

    • USD 2.39 billion, at a CAGR of 8.4%

  • What segmentation does the market report cover?

    • The report is segmented by Application (Medical insoles, and Sports insoles), Material (Polypropylene, Leather, and Others), End-user (Hospitals, Pharmacies, Online retail, and Specialty sports) and Geography (North America, Europe, APAC, Middle East and Africa, South America)

  • Which regions are analyzed in the report?

    • North America, Europe, APAC, Middle East and Africa and South America

  • What are the key growth drivers and market challenges?

    • Aging population and age-related foot conditions, High production costs and reimbursement uncertainty

  • Who are the major players in the Foot Insoles Market?

    • Acor Orthopaedic Inc., Aetrex Worldwide Inc., Amfit Inc., Bauerfeind AG, CURREX, DOLA Orthotics, Enovis Corp., Footbalance System Ltd., Formthotics, Foundation Wellness, Implus Footcare LLC, medi GmbH and Co. KG, OrthoLite, Ottobock SE and Co. KGaA, Scholls Wellness Co., Shapecrunch Technology Pvt. Ltd., Sidas SAS, Sorbothane Inc., Superfeet Worldwide LLC and Tacco Footcare

Market Research Insights

  • The Foot Insoles Market is undergoing a rapid operational transformation driven by precision diagnostics and material science innovations. The widespread implementation of digital retail ecosystems has streamlined direct-to-consumer orthotic procurement, allowing specialized manufacturers to bypass traditional clinical bottlenecks. By leveraging targeted arch reinforcement designs and dynamic motion control technologies, leading brands have enhanced user mobility significantly.
  • Facilities integrating advanced anti-fatigue functional footbeds report a 28 percent reduction in occupational fatigue-related absenteeism compared to standard footwear environments. Furthermore, companies optimizing their supply chains to deliver premium replacement inserts have achieved a 15 percent improvement in customer retention rates.
  • The accelerating shift toward custom thermo-moldable orthotic fabrication ensures optimal foot alignment optimization, delivering measurable improvements in long-term therapeutic compliance and overall product efficacy.

We can help! Our analysts can customize this foot insoles market research report to meet your requirements.

Get in touch

1. Executive Summary

1.1 Market overview

Executive Summary - Chart on Market Overview
Executive Summary - Data Table on Market Overview
Executive Summary - Chart on Global Market Characteristics
Executive Summary - Chart on Market by Geography
Executive Summary - Chart on Market Segmentation by Application
Executive Summary - Chart on Market Segmentation by Material
Executive Summary - Chart on Market Segmentation by End-user
Executive Summary - Chart on Incremental Growth
Executive Summary - Data Table on Incremental Growth
Executive Summary - Chart on Company Market Positioning

2. Technavio Analysis

2.1 Analysis of price sensitivity, lifecycle, customer purchase basket, adoption rates, and purchase criteria

2.2 Criticality of inputs and Factors of differentiation

Chart on Overview on criticality of inputs and factors of differentiation

2.3 Factors of disruption

Chart on Overview on factors of disruption

2.4 Impact of drivers and challenges

Chart on Impact of drivers and challenges in 2025 and 2030

3. Market Landscape

3.1 Market ecosystem

Chart on Parent Market
Data Table on - Parent Market

3.2 Market characteristics

Chart on Market characteristics analysis

3.3 Value chain analysis

Chart on Value chain analysis

4. Market Sizing

4.1 Market definition

Data Table on Offerings of companies included in the market definition

4.2 Market segment analysis

Market segments

4.3 Market size 2025

4.4 Market outlook: Forecast for 2025-2030

Chart on Global - Market size and forecast 2025-2030 ($ million)
Data Table on Global - Market size and forecast 2025-2030 ($ million)
Chart on Global Market: Year-over-year growth 2025-2030 (%)
Data Table on Global Market: Year-over-year growth 2025-2030 (%)

5. Historic Market Size

5.1 Global Foot Insoles Market 2020 - 2024

Historic Market Size - Data Table on Global Foot Insoles Market 2020 - 2024 ($ million)

5.2 Application segment analysis 2020 - 2024

Historic Market Size - Application Segment 2020 - 2024 ($ million)

5.3 Material segment analysis 2020 - 2024

Historic Market Size - Material Segment 2020 - 2024 ($ million)

5.4 End-user segment analysis 2020 - 2024

Historic Market Size - End-user Segment 2020 - 2024 ($ million)

5.5 Geography segment analysis 2020 - 2024

Historic Market Size - Geography Segment 2020 - 2024 ($ million)

5.6 Country segment analysis 2020 - 2024

Historic Market Size - Country Segment 2020 - 2024 ($ million)

6. Qualitative Analysis

6.1 Impact of AI on Global Foot Insoles Market

6.2 Impact of Geopolitical Conflicts on Global Foot Insoles Market

7. Five Forces Analysis

7.1 Five forces summary

Five forces analysis - Comparison between 2025 and 2030

7.2 Bargaining power of buyers

Bargaining power of buyers - Impact of key factors 2025 and 2030

7.3 Bargaining power of suppliers

Bargaining power of suppliers - Impact of key factors in 2025 and 2030

7.4 Threat of new entrants

Threat of new entrants - Impact of key factors in 2025 and 2030

7.5 Threat of substitutes

Threat of substitutes - Impact of key factors in 2025 and 2030

7.6 Threat of rivalry

Threat of rivalry - Impact of key factors in 2025 and 2030

7.7 Market condition

Chart on Market condition - Five forces 2025 and 2030

8. Market Segmentation by Application

8.1 Market segments

Chart on Application - Market share 2025-2030 (%)
Data Table on Application - Market share 2025-2030 (%)

8.2 Comparison by Application

Chart on Comparison by Application
Data Table on Comparison by Application

8.3 Medical insoles - Market size and forecast 2025-2030

Chart on Medical insoles - Market size and forecast 2025-2030 ($ million)
Data Table on Medical insoles - Market size and forecast 2025-2030 ($ million)
Chart on Medical insoles - Year-over-year growth 2025-2030 (%)
Data Table on Medical insoles - Year-over-year growth 2025-2030 (%)

8.4 Sports insoles - Market size and forecast 2025-2030

Chart on Sports insoles - Market size and forecast 2025-2030 ($ million)
Data Table on Sports insoles - Market size and forecast 2025-2030 ($ million)
Chart on Sports insoles - Year-over-year growth 2025-2030 (%)
Data Table on Sports insoles - Year-over-year growth 2025-2030 (%)

8.5 Market opportunity by Application

Market opportunity by Application ($ million)
Data Table on Market opportunity by Application ($ million)

9. Market Segmentation by Material

9.1 Market segments

Chart on Material - Market share 2025-2030 (%)
Data Table on Material - Market share 2025-2030 (%)

9.2 Comparison by Material

Chart on Comparison by Material
Data Table on Comparison by Material

9.3 Polypropylene - Market size and forecast 2025-2030

Chart on Polypropylene - Market size and forecast 2025-2030 ($ million)
Data Table on Polypropylene - Market size and forecast 2025-2030 ($ million)
Chart on Polypropylene - Year-over-year growth 2025-2030 (%)
Data Table on Polypropylene - Year-over-year growth 2025-2030 (%)

9.4 Leather - Market size and forecast 2025-2030

Chart on Leather - Market size and forecast 2025-2030 ($ million)
Data Table on Leather - Market size and forecast 2025-2030 ($ million)
Chart on Leather - Year-over-year growth 2025-2030 (%)
Data Table on Leather - Year-over-year growth 2025-2030 (%)

9.5 Others - Market size and forecast 2025-2030

Chart on Others - Market size and forecast 2025-2030 ($ million)
Data Table on Others - Market size and forecast 2025-2030 ($ million)
Chart on Others - Year-over-year growth 2025-2030 (%)
Data Table on Others - Year-over-year growth 2025-2030 (%)

9.6 Market opportunity by Material

Market opportunity by Material ($ million)
Data Table on Market opportunity by Material ($ million)

10. Market Segmentation by End-user

10.1 Market segments

Chart on End-user - Market share 2025-2030 (%)
Data Table on End-user - Market share 2025-2030 (%)

10.2 Comparison by End-user

Chart on Comparison by End-user
Data Table on Comparison by End-user

10.3 Hospitals - Market size and forecast 2025-2030

Chart on Hospitals - Market size and forecast 2025-2030 ($ million)
Data Table on Hospitals - Market size and forecast 2025-2030 ($ million)
Chart on Hospitals - Year-over-year growth 2025-2030 (%)
Data Table on Hospitals - Year-over-year growth 2025-2030 (%)

10.4 Pharmacies - Market size and forecast 2025-2030

Chart on Pharmacies - Market size and forecast 2025-2030 ($ million)
Data Table on Pharmacies - Market size and forecast 2025-2030 ($ million)
Chart on Pharmacies - Year-over-year growth 2025-2030 (%)
Data Table on Pharmacies - Year-over-year growth 2025-2030 (%)

10.5 Online retail - Market size and forecast 2025-2030

Chart on Online retail - Market size and forecast 2025-2030 ($ million)
Data Table on Online retail - Market size and forecast 2025-2030 ($ million)
Chart on Online retail - Year-over-year growth 2025-2030 (%)
Data Table on Online retail - Year-over-year growth 2025-2030 (%)

10.6 Specialty sports - Market size and forecast 2025-2030

Chart on Specialty sports - Market size and forecast 2025-2030 ($ million)
Data Table on Specialty sports - Market size and forecast 2025-2030 ($ million)
Chart on Specialty sports - Year-over-year growth 2025-2030 (%)
Data Table on Specialty sports - Year-over-year growth 2025-2030 (%)

10.7 Market opportunity by End-user

Market opportunity by End-user ($ million)
Data Table on Market opportunity by End-user ($ million)

11. Customer Landscape

11.1 Customer landscape overview

Analysis of price sensitivity, lifecycle, customer purchase basket, adoption rates, and purchase criteria

12. Geographic Landscape

12.1 Geographic segmentation

Chart on Market share by geography 2025-2030 (%)
Data Table on Market share by geography 2025-2030 (%)

12.2 Geographic comparison

Chart on Geographic comparison
Data Table on Geographic comparison

12.3 North America - Market size and forecast 2025-2030

Chart on North America - Market size and forecast 2025-2030 ($ million)
Data Table on North America - Market size and forecast 2025-2030 ($ million)
Chart on North America - Year-over-year growth 2025-2030 (%)
Data Table on North America - Year-over-year growth 2025-2030 (%)
Chart on Regional Comparison - North America
Data Table on Regional Comparison - North America

12.3.1 US - Market size and forecast 2025-2030

Chart on US - Market size and forecast 2025-2030 ($ million)
Data Table on US - Market size and forecast 2025-2030 ($ million)
Chart on US - Year-over-year growth 2025-2030 (%)
Data Table on US - Year-over-year growth 2025-2030 (%)

12.3.2 Canada - Market size and forecast 2025-2030

Chart on Canada - Market size and forecast 2025-2030 ($ million)
Data Table on Canada - Market size and forecast 2025-2030 ($ million)
Chart on Canada - Year-over-year growth 2025-2030 (%)
Data Table on Canada - Year-over-year growth 2025-2030 (%)

12.3.3 Mexico - Market size and forecast 2025-2030

Chart on Mexico - Market size and forecast 2025-2030 ($ million)
Data Table on Mexico - Market size and forecast 2025-2030 ($ million)
Chart on Mexico - Year-over-year growth 2025-2030 (%)
Data Table on Mexico - Year-over-year growth 2025-2030 (%)

12.4 Europe - Market size and forecast 2025-2030

Chart on Europe - Market size and forecast 2025-2030 ($ million)
Data Table on Europe - Market size and forecast 2025-2030 ($ million)
Chart on Europe - Year-over-year growth 2025-2030 (%)
Data Table on Europe - Year-over-year growth 2025-2030 (%)
Chart on Regional Comparison - Europe
Data Table on Regional Comparison - Europe

12.4.1 Germany - Market size and forecast 2025-2030

Chart on Germany - Market size and forecast 2025-2030 ($ million)
Data Table on Germany - Market size and forecast 2025-2030 ($ million)
Chart on Germany - Year-over-year growth 2025-2030 (%)
Data Table on Germany - Year-over-year growth 2025-2030 (%)

12.4.2 UK - Market size and forecast 2025-2030

Chart on UK - Market size and forecast 2025-2030 ($ million)
Data Table on UK - Market size and forecast 2025-2030 ($ million)
Chart on UK - Year-over-year growth 2025-2030 (%)
Data Table on UK - Year-over-year growth 2025-2030 (%)

12.4.3 France - Market size and forecast 2025-2030

Chart on France - Market size and forecast 2025-2030 ($ million)
Data Table on France - Market size and forecast 2025-2030 ($ million)
Chart on France - Year-over-year growth 2025-2030 (%)
Data Table on France - Year-over-year growth 2025-2030 (%)

12.4.4 Italy - Market size and forecast 2025-2030

Chart on Italy - Market size and forecast 2025-2030 ($ million)
Data Table on Italy - Market size and forecast 2025-2030 ($ million)
Chart on Italy - Year-over-year growth 2025-2030 (%)
Data Table on Italy - Year-over-year growth 2025-2030 (%)

12.4.5 Spain - Market size and forecast 2025-2030

Chart on Spain - Market size and forecast 2025-2030 ($ million)
Data Table on Spain - Market size and forecast 2025-2030 ($ million)
Chart on Spain - Year-over-year growth 2025-2030 (%)
Data Table on Spain - Year-over-year growth 2025-2030 (%)

12.4.6 The Netherlands - Market size and forecast 2025-2030

Chart on The Netherlands - Market size and forecast 2025-2030 ($ million)
Data Table on The Netherlands - Market size and forecast 2025-2030 ($ million)
Chart on The Netherlands - Year-over-year growth 2025-2030 (%)
Data Table on The Netherlands - Year-over-year growth 2025-2030 (%)

12.5 APAC - Market size and forecast 2025-2030

Chart on APAC - Market size and forecast 2025-2030 ($ million)
Data Table on APAC - Market size and forecast 2025-2030 ($ million)
Chart on APAC - Year-over-year growth 2025-2030 (%)
Data Table on APAC - Year-over-year growth 2025-2030 (%)
Chart on Regional Comparison - APAC
Data Table on Regional Comparison - APAC

12.5.1 China - Market size and forecast 2025-2030

Chart on China - Market size and forecast 2025-2030 ($ million)
Data Table on China - Market size and forecast 2025-2030 ($ million)
Chart on China - Year-over-year growth 2025-2030 (%)
Data Table on China - Year-over-year growth 2025-2030 (%)

12.5.2 Japan - Market size and forecast 2025-2030

Chart on Japan - Market size and forecast 2025-2030 ($ million)
Data Table on Japan - Market size and forecast 2025-2030 ($ million)
Chart on Japan - Year-over-year growth 2025-2030 (%)
Data Table on Japan - Year-over-year growth 2025-2030 (%)

12.5.3 India - Market size and forecast 2025-2030

Chart on India - Market size and forecast 2025-2030 ($ million)
Data Table on India - Market size and forecast 2025-2030 ($ million)
Chart on India - Year-over-year growth 2025-2030 (%)
Data Table on India - Year-over-year growth 2025-2030 (%)

12.5.4 South Korea - Market size and forecast 2025-2030

Chart on South Korea - Market size and forecast 2025-2030 ($ million)
Data Table on South Korea - Market size and forecast 2025-2030 ($ million)
Chart on South Korea - Year-over-year growth 2025-2030 (%)
Data Table on South Korea - Year-over-year growth 2025-2030 (%)

12.5.5 Australia - Market size and forecast 2025-2030

Chart on Australia - Market size and forecast 2025-2030 ($ million)
Data Table on Australia - Market size and forecast 2025-2030 ($ million)
Chart on Australia - Year-over-year growth 2025-2030 (%)
Data Table on Australia - Year-over-year growth 2025-2030 (%)

12.5.6 Indonesia - Market size and forecast 2025-2030

Chart on Indonesia - Market size and forecast 2025-2030 ($ million)
Data Table on Indonesia - Market size and forecast 2025-2030 ($ million)
Chart on Indonesia - Year-over-year growth 2025-2030 (%)
Data Table on Indonesia - Year-over-year growth 2025-2030 (%)

12.6 Middle East and Africa - Market size and forecast 2025-2030

Chart on Middle East and Africa - Market size and forecast 2025-2030 ($ million)
Data Table on Middle East and Africa - Market size and forecast 2025-2030 ($ million)
Chart on Middle East and Africa - Year-over-year growth 2025-2030 (%)
Data Table on Middle East and Africa - Year-over-year growth 2025-2030 (%)
Chart on Regional Comparison - Middle East and Africa
Data Table on Regional Comparison - Middle East and Africa

12.6.1 Saudi Arabia - Market size and forecast 2025-2030

Chart on Saudi Arabia - Market size and forecast 2025-2030 ($ million)
Data Table on Saudi Arabia - Market size and forecast 2025-2030 ($ million)
Chart on Saudi Arabia - Year-over-year growth 2025-2030 (%)
Data Table on Saudi Arabia - Year-over-year growth 2025-2030 (%)

12.6.2 UAE - Market size and forecast 2025-2030

Chart on UAE - Market size and forecast 2025-2030 ($ million)
Data Table on UAE - Market size and forecast 2025-2030 ($ million)
Chart on UAE - Year-over-year growth 2025-2030 (%)
Data Table on UAE - Year-over-year growth 2025-2030 (%)

12.6.3 South Africa - Market size and forecast 2025-2030

Chart on South Africa - Market size and forecast 2025-2030 ($ million)
Data Table on South Africa - Market size and forecast 2025-2030 ($ million)
Chart on South Africa - Year-over-year growth 2025-2030 (%)
Data Table on South Africa - Year-over-year growth 2025-2030 (%)

12.6.4 Israel - Market size and forecast 2025-2030

Chart on Israel - Market size and forecast 2025-2030 ($ million)
Data Table on Israel - Market size and forecast 2025-2030 ($ million)
Chart on Israel - Year-over-year growth 2025-2030 (%)
Data Table on Israel - Year-over-year growth 2025-2030 (%)

12.6.5 Turkey - Market size and forecast 2025-2030

Chart on Turkey - Market size and forecast 2025-2030 ($ million)
Data Table on Turkey - Market size and forecast 2025-2030 ($ million)
Chart on Turkey - Year-over-year growth 2025-2030 (%)
Data Table on Turkey - Year-over-year growth 2025-2030 (%)

12.7 South America - Market size and forecast 2025-2030

Chart on South America - Market size and forecast 2025-2030 ($ million)
Data Table on South America - Market size and forecast 2025-2030 ($ million)
Chart on South America - Year-over-year growth 2025-2030 (%)
Data Table on South America - Year-over-year growth 2025-2030 (%)
Chart on Regional Comparison - South America
Data Table on Regional Comparison - South America

12.7.1 Brazil - Market size and forecast 2025-2030

Chart on Brazil - Market size and forecast 2025-2030 ($ million)
Data Table on Brazil - Market size and forecast 2025-2030 ($ million)
Chart on Brazil - Year-over-year growth 2025-2030 (%)
Data Table on Brazil - Year-over-year growth 2025-2030 (%)

12.7.2 Argentina - Market size and forecast 2025-2030

Chart on Argentina - Market size and forecast 2025-2030 ($ million)
Data Table on Argentina - Market size and forecast 2025-2030 ($ million)
Chart on Argentina - Year-over-year growth 2025-2030 (%)
Data Table on Argentina - Year-over-year growth 2025-2030 (%)

12.7.3 Chile - Market size and forecast 2025-2030

Chart on Chile - Market size and forecast 2025-2030 ($ million)
Data Table on Chile - Market size and forecast 2025-2030 ($ million)
Chart on Chile - Year-over-year growth 2025-2030 (%)
Data Table on Chile - Year-over-year growth 2025-2030 (%)

12.8 Market opportunity by geography

Market opportunity by geography ($ million)
Data Tables on Market opportunity by geography ($ million)

13. Drivers, Challenges, and Opportunity

13.1 Market drivers

Aging population and age-related foot conditions
Growth of e-commerce and DTC channels
Workplace safety regulations and ergonomic investments

13.2 Market challenges

High production costs and reimbursement uncertainty
Substandard OTC substitutes and brand dilution
Biomechanical sizing complexities and high online return rates

13.3 Impact of drivers and challenges

Impact of drivers and challenges in 2025 and 2030

13.4 Market opportunities

Rising musculoskeletal and lifestyle disorders
Growing participation in sports and fitness
Advancements in scanning, 3D printing, and smart sensors

14. Competitive Landscape

14.1 Overview

14.2

Overview on criticality of inputs and factors of differentiation

14.3 Landscape disruption

Overview on factors of disruption

14.4 Industry risks

Impact of key risks on business

15. Competitive Analysis

15.1 Companies profiled

Companies covered

15.2 Company ranking index

15.3 Market positioning of companies

Matrix on companies position and classification

15.4 Acor Orthopaedic Inc.

Acor Orthopaedic Inc. - Overview
Acor Orthopaedic Inc. - Product / Service
Acor Orthopaedic Inc. - Key offerings
SWOT

15.5 Amfit Inc.

Amfit Inc. - Overview
Amfit Inc. - Product / Service
Amfit Inc. - Key offerings
SWOT

15.6 CURREX

CURREX - Overview
CURREX - Product / Service
CURREX - Key offerings
SWOT

15.7 DOLA Orthotics

DOLA Orthotics - Overview
DOLA Orthotics - Product / Service
DOLA Orthotics - Key offerings
SWOT

15.8 Enovis Corp.

Enovis Corp. - Overview
Enovis Corp. - Business segments
Enovis Corp. - Key news
Enovis Corp. - Key offerings
Enovis Corp. - Segment focus
SWOT

15.9 Footbalance System Ltd.

Footbalance System Ltd. - Overview
Footbalance System Ltd. - Product / Service
Footbalance System Ltd. - Key offerings
SWOT

15.10 Foundation Wellness

Foundation Wellness - Overview
Foundation Wellness - Product / Service
Foundation Wellness - Key offerings
SWOT

15.11 Implus Footcare LLC

Implus Footcare LLC - Overview
Implus Footcare LLC - Product / Service
Implus Footcare LLC - Key offerings
SWOT

15.12 medi GmbH and Co. KG

medi GmbH and Co. KG - Overview
medi GmbH and Co. KG - Product / Service
medi GmbH and Co. KG - Key offerings
SWOT

15.13 OrthoLite

OrthoLite - Overview
OrthoLite - Product / Service
OrthoLite - Key offerings
SWOT

15.14 Ottobock SE and Co. KGaA

Ottobock SE and Co. KGaA - Overview
Ottobock SE and Co. KGaA - Product / Service
Ottobock SE and Co. KGaA - Key offerings
SWOT

15.15 Scholls Wellness Co.

Scholls Wellness Co. - Overview
Scholls Wellness Co. - Product / Service
Scholls Wellness Co. - Key offerings
SWOT

15.16 Sidas SAS

Sidas SAS - Overview
Sidas SAS - Product / Service
Sidas SAS - Key offerings
SWOT

15.17 Sorbothane Inc.

Sorbothane Inc. - Overview
Sorbothane Inc. - Product / Service
Sorbothane Inc. - Key offerings
SWOT

15.18 Tacco Footcare

Tacco Footcare - Overview
Tacco Footcare - Product / Service
Tacco Footcare - Key offerings
SWOT

16. Appendix

16.1 Scope of the report

Market definition
Objectives
Notes and caveats

16.2 Inclusions and exclusions checklist

Inclusions checklist
Exclusions checklist

16.3 Currency conversion rates for US$

16.4 Research methodology

16.5 Data procurement

Information sources

16.6 Data validation

16.7 Validation techniques employed for market sizing

16.8 Data synthesis

16.9 360 degree market analysis

16.10 List of abbreviations

Research Methodology

Technavio presents a detailed picture of the market by way of study, synthesis, and summation of data from multiple sources. The analysts have presented the various facets of the market with a particular focus on identifying the key industry influencers. The data thus presented is comprehensive, reliable, and the result of extensive research, both primary and secondary.

INFORMATION SOURCES

Primary sources

  • Manufacturers and suppliers
  • Channel partners
  • Industry experts
  • Strategic decision makers

Secondary sources

  • Industry journals and periodicals
  • Government data
  • Financial reports of key industry players
  • Historical data
  • Press releases

DATA ANALYSIS

Data Synthesis

  • Collation of data
  • Estimation of key figures
  • Analysis of derived insights

Data Validation

  • Triangulation with data models
  • Reference against proprietary databases
  • Corroboration with industry experts

REPORT WRITING

Qualitative

  • Market drivers
  • Market challenges
  • Market trends
  • Five forces analysis

Quantitative

  • Market size and forecast
  • Market segmentation
  • Geographical insights
  • Competitive landscape

Interested in this report?

Get your sample now to see our research methodology and insights!

Download Now

Frequently Asked Questions

Foot Insoles market growth will increase by USD 2393.6 million during 2026-2030.

The Foot Insoles market is expected to grow at a CAGR of 8.4% during 2026-2030.

Foot Insoles market is segmented by Application (Medical insoles, Sports insoles) Material (Polypropylene, Leather, Others) End-user (Hospitals, Pharmacies, Online retail, Specialty sports)

Acor Orthopaedic Inc., Aetrex Worldwide Inc., Amfit Inc., Bauerfeind AG, CURREX, DOLA Orthotics, Enovis Corp., Footbalance System Ltd., Formthotics, Foundation Wellness, Implus Footcare LLC, medi GmbH and Co. KG, OrthoLite, Ottobock SE and Co. KGaA, Scholls Wellness Co., Shapecrunch Technology Pvt. Ltd., Sidas SAS, Sorbothane Inc., Superfeet Worldwide LLC, Tacco Footcare are a few of the key vendors in the Foot Insoles market.

North America will register the highest growth rate of 36% among the other regions. Therefore, the Foot Insoles market in North America is expected to garner significant business opportunities for the vendors during the forecast period.

US, Canada, Mexico, Germany, UK, France, Italy, Spain, The Netherlands, China, Japan, India, South Korea, Australia, Indonesia, Saudi Arabia, UAE, South Africa, Israel, Turkey, Brazil, Argentina, Chile

  • Aging population and age-related foot conditions is the driving factor this market.

The Foot Insoles market vendors should focus on grabbing business opportunities from the Application segment as it accounted for the largest market share in the base year.
RIA - Research AI Assistant
Ask RIA