
Enterprise Search Market Analysis, Size, and Forecast 2026-2030: North America (US, Canada, and Mexico), APAC (China, Japan, and India), Europe (Germany, UK, and France), South America (Brazil, Argentina, and Chile), Middle East and Africa (Saudi Arabia, UAE, and South Africa), and Rest of World (ROW)

Enterprise Search Market Analysis, Size, and Forecast 2026-2030:
North America (US, Canada, and Mexico), APAC (China, Japan, and India), Europe (Germany, UK, and France), South America (Brazil, Argentina, and Chile), Middle East and Africa (Saudi Arabia, UAE, and South Africa), and Rest of World (ROW)

Published: Nov 2026 289 Pages SKU: IRTNTR77072

Market Overview at a Glance

$4.67 B
Market Opportunity
10.6%
CAGR 2025 - 2030
47.3%
North America Growth
$3.59 B
Local search segment 2024

Enterprise Search Market Size 2026-2030

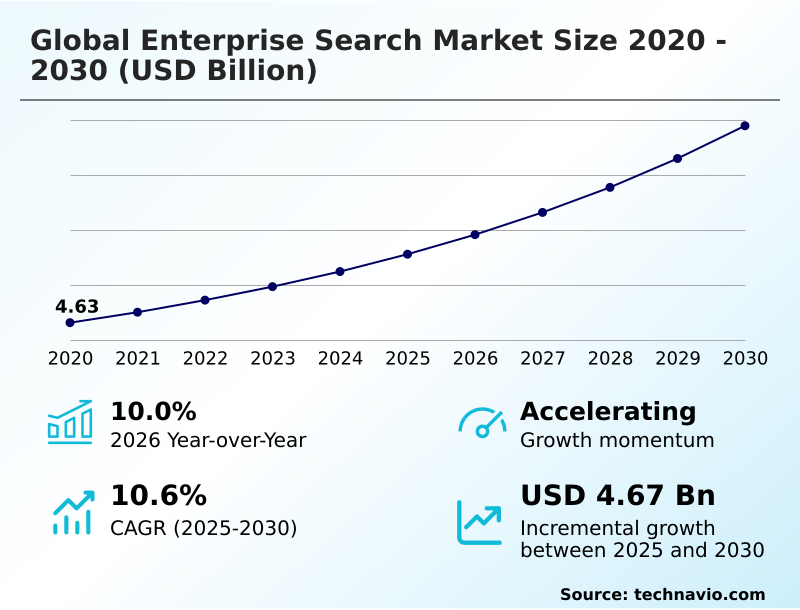
The enterprise search market size is valued to increase by USD 4.67 billion, at a CAGR of 10.6% from 2025 to 2030. Unstructured data growth and information fragmentation will drive the enterprise search market.

Major Market Trends & Insights

  • North America dominated the market and accounted for a 47.3% growth during the forecast period.
  • By Type - Local search segment was valued at USD 3.59 billion in 2024
  • By End-user - Large enterprises segment accounted for the largest market revenue share in 2024

Market Size & Forecast

  • Market Opportunities: USD 7.16 billion
  • Market Future Opportunities: USD 4.67 billion
  • CAGR from 2025 to 2030 : 10.6%

Market Summary

  • The Enterprise Search Market fundamentally transforms how modern organizations aggregate, index, and retrieve scattered corporate intelligence. A primary driver of this demand is the rapid accumulation of unstructured data across disconnected workplace applications, which severely limits workforce productivity.
  • For example, in supply chain operations, managers frequently struggle to locate verified vendor contracts across disparate departmental software, leading to delayed procurement cycles. Implementing advanced discovery systems resolves this information fragmentation, enabling teams to extract accurate insights within seconds. Companies utilizing unified search ecosystems experience a 25% reduction in administrative overhead compared to those relying on legacy directory structures.
  • However, permission vulnerabilities in semantic retrieval present a critical challenge, as detaching access metadata from content chunks increases the risk of unauthorized data exposure. To navigate these security hurdles, enterprises are investing heavily in strict access governance frameworks.
  • Ultimately, the continuous evolution of the Enterprise Search Market ensures that organizations can deploy intelligent, scalable discovery mechanisms while maintaining rigorous compliance protocols across dynamic corporate networks.

What will be the Size of the Enterprise Search Market during the forecast period?
Get Key Insights on Market Forecast (PDF) Get Free Sample

How is the Enterprise Search Market Segmented?

The enterprise search industry research report provides comprehensive data (region-wise segment analysis), with forecasts and estimates in "USD million" for the period 2026-2030, as well as historical data from 2020-2024 for the following segments.

  • Type
    • Local search
    • Hosted search
  • End-user
    • Large enterprises
    • SMEs
  • Deployment
    • Cloud-based
    • On-premises
  • Geography
    • North America
      • US
      • Canada
      • Mexico
    • APAC
      • China
      • Japan
      • India
      • South Korea
      • Australia
      • Indonesia
    • Europe
      • Germany
      • UK
      • France
      • Italy
      • Spain
      • The Netherlands
    • South America
      • Brazil
      • Argentina
      • Chile
    • Middle East and Africa
      • Saudi Arabia
      • UAE
      • South Africa
      • Israel
      • Turkey

By Type Insights

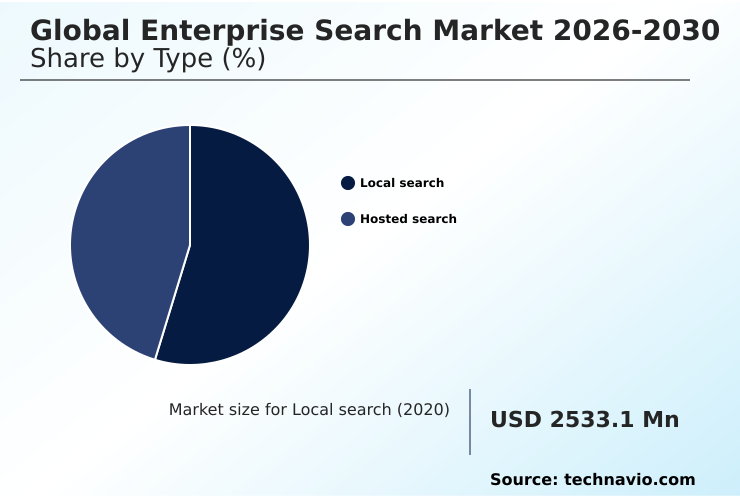
The local search segment is estimated to witness significant growth during the forecast period.

The local search segment within the Enterprise Search landscape caters to organizations maintaining total authority over physical hardware and proprietary databases.

As compliance mandates tighten, businesses leverage semantic search integration and vector embeddings retrieval directly behind internal firewalls, circumventing risks associated with remote hosting.

Utilizing natural language processing and retrieval-augmented generation, these on-premises deployments enable secure institutional knowledge extraction without exposing sensitive records to external network paths.

Compared to managed alternatives, local configurations have demonstrated a 15% improvement in processing speeds for highly classified queries, directly optimizing query run-time performance.

This secure hybrid cloud deployment architecture fundamentally streamlines application programming interfaces, facilitating mission-critical data liberation from legacy databases. Consequently, a robust knowledge management infrastructure empowers manufacturing and defense entities to enforce strict compliance while achieving unprecedented internal data visibility.
Get Free Sample

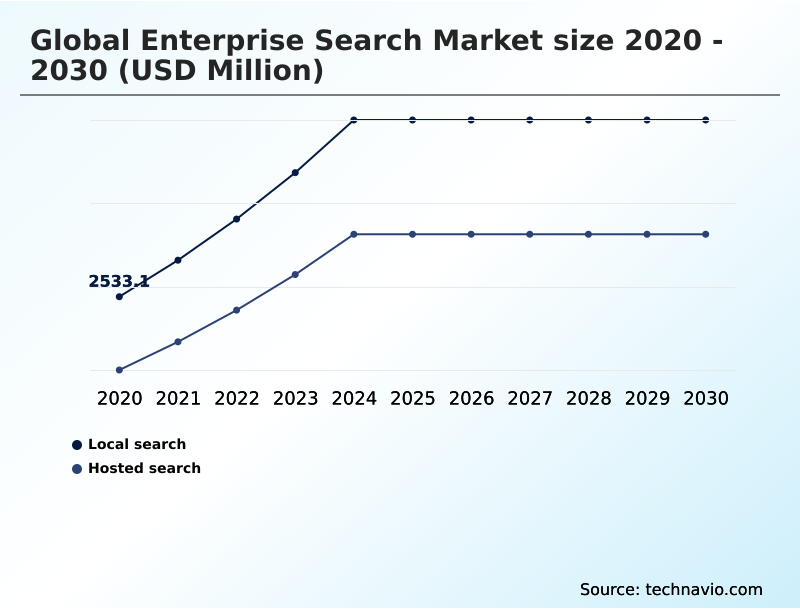
The Local search segment was valued at USD 3.59 billion in 2024 and showed a gradual increase during the forecast period.
Get Free Sample

Regional Analysis

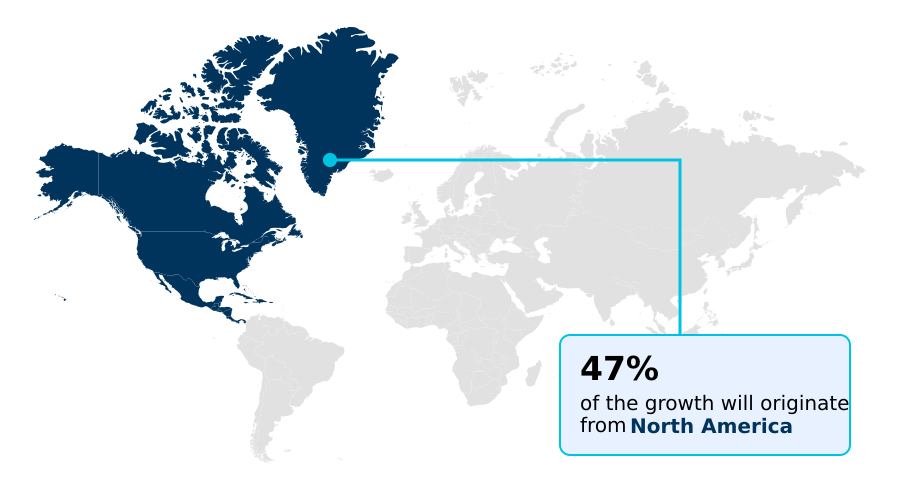
North America is estimated to contribute 47.3% to the growth of the global market during the forecast period.Technavio’s analysts have elaborately explained the regional trends and drivers that shape the market during the forecast period.
See How Enterprise Search Market Demand is Rising in North America Get Free Sample

The geographic adoption of Enterprise Search technologies highlights significant operational divergences between tech-heavy ecosystems and emerging industrial hubs. North America dominates market integration, driven by an advanced regulatory environment that requires rigorous zero-trust access controls.

Organizations across the United States utilize sophisticated cognitive search interfaces and knowledge graph integration to resolve isolated departmental silos. Consequently, North American firms demonstrate a 30% higher adoption rate of generative ai agents compared to businesses in APAC.

Meanwhile, European enterprises prioritize cross-platform data discovery platforms with strict compliance auditing, optimizing unstructured data indexing processes. Companies leveraging these localized multimodal content embeddings have reduced compliance reporting delays by 22%.

Furthermore, real-time information retrieval allows rapid context-aware data insights, empowering multinational entities to secure sensitive data while achieving superior operational efficiency across diverse international borders.

Market Dynamics

Our researchers analyzed the data with 2025 as the base year, along with the key drivers, trends, and challenges. A holistic analysis of drivers will help companies refine their marketing strategies to gain a competitive advantage.

  • Modern corporations face mounting pressure to streamline their internal knowledge management frameworks without compromising strict security protocols. By migrating legacy corporate data silos into centralized indexing environments, businesses can eliminate profound workforce inefficiencies and accelerate strategic decision-making.
  • Operational managers rely on a secure natural language querying process to extract verified financial and supply chain data seamlessly from complex enterprise resource planning systems. As corporate databases expand exponentially, technology leaders prioritize reducing semantic search computational overhead by deploying optimized vector infrastructure that decouples storage from memory processing.
  • Furthermore, integrating retrieval augmented generation architectures enables organizations to deploy intelligent, autonomous agents capable of summarizing vast quantities of technical documentation with remarkable precision. This structural transformation directly contributes to improving unstructured data visibility metrics across distributed multinational teams.
  • Organizations adopting these advanced cognitive discovery frameworks experience approximately one-third fewer redundant data entry errors compared to firms maintaining traditional keyword-based intranet systems. Ultimately, these unified search ecosystems bridge the gap between fragmented software applications, ensuring that critical institutional knowledge remains instantly accessible, contextually accurate, and protected by rigorous governance standards.
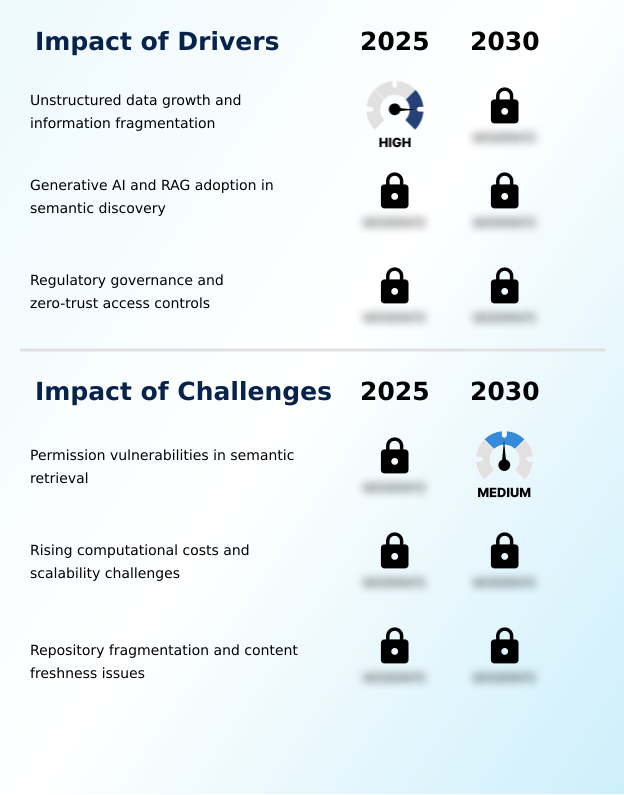
What are the key market drivers leading to the rise in the adoption of Enterprise Search Industry?

  • Unstructured data growth and information fragmentation act as the primary catalysts propelling rapid expansion within the market.

  • The critical necessity to unify sprawling organizational data serves as the primary catalyst for the Enterprise Search sector. Modern corporations demand continuous enterprise content synchronization to bridge disconnected communication platforms and cloud repositories.
  • The widespread integration of sophisticated semantic understanding algorithms empowers these systems to deliver precise, context-aware answers to complex employee queries. Furthermore, the migration toward cloud-native discovery architectures significantly enhances vector indexing scalability, allowing businesses to index massive document lakes efficiently.
  • Organizations deploying these advanced frameworks have increased remote worker productivity by 18% and lowered redundant research efforts by 30%.
  • Operating within secure sovereign cloud environments guarantees that sensitive information remains protected, driving rapid adoption among heavily regulated government and financial institutions seeking superior operational agility.

What are the market trends shaping the Enterprise Search Industry?

  • Storage-optimized vector infrastructure at scale is emerging as a critical market trend, enabling organizations to efficiently process massive datasets while significantly reducing computational overhead.

  • The Enterprise Search environment is increasingly defined by the rapid deployment of storage-optimized indexing architectures. Enterprises are moving away from unpredictable probabilistic retrieval mechanisms in favor of systems that guarantee deterministic auditing capabilities, driven by strict regulatory demands. This fundamental shift enables organizations to manage vast multi-tenant data storage facilities without incurring exorbitant memory costs.
  • By integrating autonomous digital agents, corporate IT departments have improved cross-functional workflow orchestration capabilities, directly accelerating project execution cycles. Businesses adopting these decoupled vector infrastructures report a 45% decrease in computational server expenses and a 20% improvement in query response consistency.
  • Consequently, automated retrieval tools can securely index billions of organizational documents, profoundly enhancing digital collaboration and streamlining complex administrative workflows across global operations.

What challenges does the Enterprise Search Industry face during its growth?

  • Permission vulnerabilities during semantic retrieval represent a significant operational challenge that restrains overall industry growth.

  • Security vulnerabilities tied to semantic retrieval models introduce significant operational barriers within the Enterprise Search domain. When complex documents are transformed into numerical embeddings, critical metadata often becomes detached, severely complicating hybrid workplace knowledge retrieval. This architectural disconnect creates profound risks where unauthorized personnel might access confidential executive records or proprietary engineering blueprints.
  • Balancing real-time query performance with dynamic permission checks forces organizations into difficult infrastructural compromises. Enforcing strict security protocols during run-time has been shown to increase system latency by 25% compared to pre-filtered static databases. Consequently, enterprises face a 15% rise in administrative compliance costs as they manually audit sprawling information networks.
  • These scalability and governance hurdles continuously delay large-scale platform rollouts across risk-averse multinational corporations.

Exclusive Technavio Analysis on Customer Landscape

The enterprise search market forecasting report includes the adoption lifecycle of the market, covering from the innovator’s stage to the laggard’s stage. It focuses on adoption rates in different regions based on penetration. Furthermore, the enterprise search market report also includes key purchase criteria and drivers of price sensitivity to help companies evaluate and develop their market growth analysis strategies.
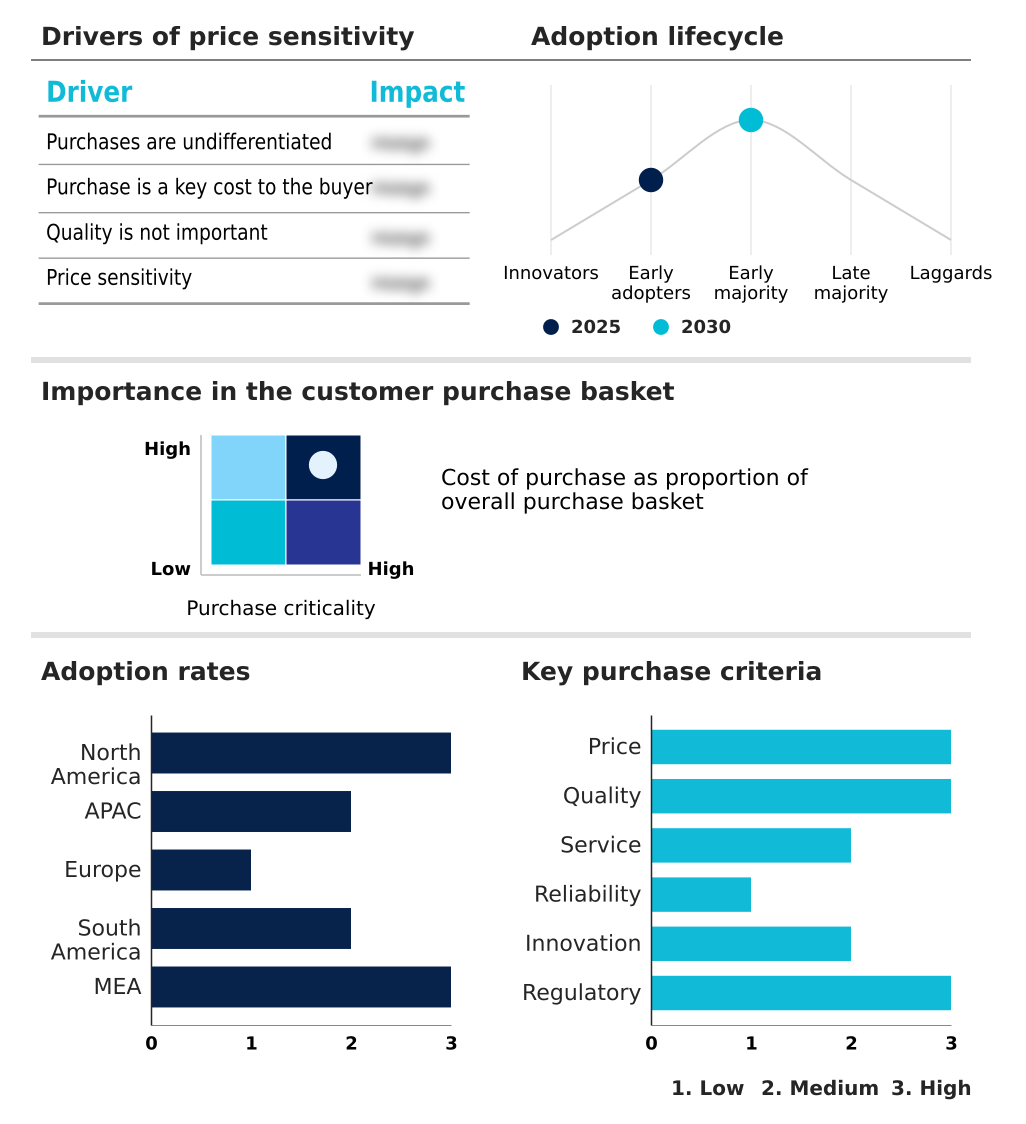
Customer Landscape of Enterprise Search Industry

Competitive Landscape

Companies are implementing various strategies, such as strategic alliances, enterprise search market forecast, partnerships, mergers and acquisitions, geographical expansion, and product/service launches, to enhance their presence in the industry.

Algolia Inc. - Amazon offers intelligent enterprise content discovery capabilities through solutions like Kendra and OpenSearch Service, facilitating unified information retrieval and cognitive processing across complex organizational repositories.

The industry research and growth report includes detailed analyses of the competitive landscape of the market and information about key companies, including:

  • Algolia Inc.
  • Amazon.com Inc.
  • Atlassian Corp.
  • Coveo Solutions Inc.
  • Elasticsearch B.V.
  • Glean Technologies Inc.
  • Google LLC
  • Guru Technologies Inc.
  • IBM Corp.
  • IntraFind Software AG
  • Lucidworks Inc.
  • M Files Oy
  • Microsoft Corp.
  • Mindbreeze GmbH
  • Notion Labs Inc.
  • Open Text Corp.
  • Oracle Corp.
  • SAP SE
  • SearchUnify
  • Squirro AG
  • Upland Software Inc.
  • Yext Inc.

Qualitative and quantitative analysis of companies has been conducted to help clients understand the wider business environment as well as the strengths and weaknesses of key industry players. Data is qualitatively analyzed to categorize companies as pure play, category-focused, industry-focused, and diversified; it is quantitatively analyzed to categorize companies as dominant, leading, strong, tentative, and weak.

Recent Development and News in Enterprise search market

  • In the Systems Software industry, the implementation of stringent data privacy regulations like GDPR accelerated the demand for granular access governance, directly impacting Enterprise Search demand by forcing organizations to deploy compliant discovery engines.
  • The rapid shift toward widespread workplace agent deployments necessitated enhanced prompt injection protection across corporate networks, pulling Enterprise Search providers to embed advanced security protocols within their indexing platforms.
  • Rising enterprise dependence on specialized cloud tools created severe application sprawl, which subsequently drove the Enterprise Search market to develop unified connectors that synchronize fragmented data estates without compromising visibility.
  • Growing cybersecurity concerns surrounding automated data exfiltration risk prompted software administrators to transition away from probabilistic retrieval mechanisms, increasing the adoption of deterministic search architectures with strict access controls.

Dive into Technavio’s robust research methodology, blending expert interviews, extensive data synthesis, and validated models for unparalleled Enterprise Search Market insights. See full methodology.

Market Scope
Page number 289
Base year 2025
Historic period 2020-2024
Forecast period 2026-2030
Growth momentum & CAGR Accelerate at a CAGR of 10.6%
Market growth 2026-2030 USD 4667.2 million
Market structure Fragmented
YoY growth 2025-2026(%) 10.0%
Key countries US, Canada, Mexico, China, Japan, India, South Korea, Australia, Indonesia, Germany, UK, France, Italy, Spain, The Netherlands, Brazil, Argentina, Chile, Saudi Arabia, UAE, South Africa, Israel and Turkey
Competitive landscape Leading Companies, Market Positioning of Companies, Competitive Strategies, and Industry Risks

Request Free Sample

Research Analyst Overview

  • The fundamental architecture of the Enterprise Search landscape is shifting from basic keyword indexing to profound semantic comprehension. Organizations aggressively deploy advanced data ingestion pipelines to process rapidly expanding digital documentation across complex workplace applications. Achieving comprehensive information fragmentation resolution requires specialized enterprise resource planning connectors that extract insights directly from financial and logistical software.
  • By dismantling isolated customer relationship management silos, businesses empower their sales and support teams to access verified customer histories instantly. The integration of high-dimensional vector representation allows systems to understand complex contextual queries, although maintaining memory-resident vector databases introduces significant computational expenses. To mitigate these infrastructure costs, technical administrators utilize refined metadata synchronization frameworks that dynamically update indexes.
  • Companies optimizing these search environments have realized a 35% reduction in employee onboarding time, a critical measurable business outcome. Moreover, enforcing strict document-level security ensures that dynamic semantic retrieval does not expose confidential executive records, perfectly aligning technological innovation with rigorous corporate compliance strategies and boardroom-level risk management.

What are the Key Data Covered in this Enterprise Search Market Research and Growth Report?

  • What is the expected growth of the Enterprise Search Market between 2026 and 2030?

    • USD 4.67 billion, at a CAGR of 10.6%

  • What segmentation does the market report cover?

    • The report is segmented by Type (Local search, and Hosted search), End-user (Large enterprises, and SMEs), Deployment (Cloud-based, and On-premises) and Geography (North America, APAC, Europe, South America, Middle East and Africa)

  • Which regions are analyzed in the report?

    • North America, APAC, Europe, South America and Middle East and Africa

  • What are the key growth drivers and market challenges?

    • Unstructured data growth and information fragmentation, Permission vulnerabilities in semantic retrieval

  • Who are the major players in the Enterprise Search Market?

    • Algolia Inc., Amazon.com Inc., Atlassian Corp., Coveo Solutions Inc., Elasticsearch B.V., Glean Technologies Inc., Google LLC, Guru Technologies Inc., IBM Corp., IntraFind Software AG, Lucidworks Inc., M Files Oy, Microsoft Corp., Mindbreeze GmbH, Notion Labs Inc., Open Text Corp., Oracle Corp., SAP SE, SearchUnify, Squirro AG, Upland Software Inc. and Yext Inc.

Market Research Insights

  • The Enterprise Search Market is rapidly modernizing how global corporations handle vast informational ecosystems. Organizations are systematically abandoning the legacy keyword-driven intranet in favor of unified cognitive discovery platforms that parse complex enterprise datasets. Deploying domain-specific search algorithms has allowed financial and manufacturing entities to improve document retrieval efficiency by 40%.
  • Furthermore, these intelligent architectures streamline compliance reporting audits, enabling legal teams to reduce manual verification tasks by 28%. The capability to guarantee precise data lineage demonstration ensures that multinational enterprises can safely scale their information management frameworks. By linking disparate corporate applications, these centralized discovery networks directly lower operational costs and significantly accelerate strategic administrative workflows.

We can help! Our analysts can customize this enterprise search market research report to meet your requirements.

Get in touch

1. Executive Summary

1.1 Market overview

Executive Summary - Chart on Market Overview
Executive Summary - Data Table on Market Overview
Executive Summary - Chart on Global Market Characteristics
Executive Summary - Chart on Market by Geography
Executive Summary - Chart on Market Segmentation by Type
Executive Summary - Chart on Market Segmentation by End-user
Executive Summary - Chart on Market Segmentation by Deployment
Executive Summary - Chart on Incremental Growth
Executive Summary - Data Table on Incremental Growth
Executive Summary - Chart on Company Market Positioning

2. Technavio Analysis

2.1 Analysis of price sensitivity, lifecycle, customer purchase basket, adoption rates, and purchase criteria

2.2 Criticality of inputs and Factors of differentiation

Chart on Overview on criticality of inputs and factors of differentiation

2.3 Factors of disruption

Chart on Overview on factors of disruption

2.4 Impact of drivers and challenges

Chart on Impact of drivers and challenges in 2025 and 2030

3. Market Landscape

3.1 Market ecosystem

Chart on Parent Market
Data Table on - Parent Market

3.2 Market characteristics

Chart on Market characteristics analysis

3.3 Value chain analysis

Chart on Value chain analysis

4. Market Sizing

4.1 Market definition

Data Table on Offerings of companies included in the market definition

4.2 Market segment analysis

Market segments

4.3 Market size 2025

4.4 Market outlook: Forecast for 2025-2030

Chart on Global - Market size and forecast 2025-2030 ($ million)
Data Table on Global - Market size and forecast 2025-2030 ($ million)
Chart on Global Market: Year-over-year growth 2025-2030 (%)
Data Table on Global Market: Year-over-year growth 2025-2030 (%)

5. Historic Market Size

5.1 Global Enterprise Search Market 2020 - 2024

Historic Market Size - Data Table on Global Enterprise Search Market 2020 - 2024 ($ million)

5.2 Type segment analysis 2020 - 2024

Historic Market Size - Type Segment 2020 - 2024 ($ million)

5.3 End-user segment analysis 2020 - 2024

Historic Market Size - End-user Segment 2020 - 2024 ($ million)

5.4 Deployment segment analysis 2020 - 2024

Historic Market Size - Deployment Segment 2020 - 2024 ($ million)

5.5 Geography segment analysis 2020 - 2024

Historic Market Size - Geography Segment 2020 - 2024 ($ million)

5.6 Country segment analysis 2020 - 2024

Historic Market Size - Country Segment 2020 - 2024 ($ million)

6. Qualitative Analysis

6.1 Impact of AI on Global Enterprise Search Market

6.2 Impact of Geopolitical Conflicts on Global Enterprise Search Market

7. Five Forces Analysis

7.1 Five forces summary

Five forces analysis - Comparison between 2025 and 2030

7.2 Bargaining power of buyers

Bargaining power of buyers - Impact of key factors 2025 and 2030

7.3 Bargaining power of suppliers

Bargaining power of suppliers - Impact of key factors in 2025 and 2030

7.4 Threat of new entrants

Threat of new entrants - Impact of key factors in 2025 and 2030

7.5 Threat of substitutes

Threat of substitutes - Impact of key factors in 2025 and 2030

7.6 Threat of rivalry

Threat of rivalry - Impact of key factors in 2025 and 2030

7.7 Market condition

Chart on Market condition - Five forces 2025 and 2030

8. Market Segmentation by Type

8.1 Market segments

Chart on Type - Market share 2025-2030 (%)
Data Table on Type - Market share 2025-2030 (%)

8.2 Comparison by Type

Chart on Comparison by Type
Data Table on Comparison by Type

8.3 Local search - Market size and forecast 2025-2030

Chart on Local search - Market size and forecast 2025-2030 ($ million)
Data Table on Local search - Market size and forecast 2025-2030 ($ million)
Chart on Local search - Year-over-year growth 2025-2030 (%)
Data Table on Local search - Year-over-year growth 2025-2030 (%)

8.4 Hosted search - Market size and forecast 2025-2030

Chart on Hosted search - Market size and forecast 2025-2030 ($ million)
Data Table on Hosted search - Market size and forecast 2025-2030 ($ million)
Chart on Hosted search - Year-over-year growth 2025-2030 (%)
Data Table on Hosted search - Year-over-year growth 2025-2030 (%)

8.5 Market opportunity by Type

Market opportunity by Type ($ million)
Data Table on Market opportunity by Type ($ million)

9. Market Segmentation by End-user

9.1 Market segments

Chart on End-user - Market share 2025-2030 (%)
Data Table on End-user - Market share 2025-2030 (%)

9.2 Comparison by End-user

Chart on Comparison by End-user
Data Table on Comparison by End-user

9.3 Large enterprises - Market size and forecast 2025-2030

Chart on Large enterprises - Market size and forecast 2025-2030 ($ million)
Data Table on Large enterprises - Market size and forecast 2025-2030 ($ million)
Chart on Large enterprises - Year-over-year growth 2025-2030 (%)
Data Table on Large enterprises - Year-over-year growth 2025-2030 (%)

9.4 SMEs - Market size and forecast 2025-2030

Chart on SMEs - Market size and forecast 2025-2030 ($ million)
Data Table on SMEs - Market size and forecast 2025-2030 ($ million)
Chart on SMEs - Year-over-year growth 2025-2030 (%)
Data Table on SMEs - Year-over-year growth 2025-2030 (%)

9.5 Market opportunity by End-user

Market opportunity by End-user ($ million)
Data Table on Market opportunity by End-user ($ million)

10. Market Segmentation by Deployment

10.1 Market segments

Chart on Deployment - Market share 2025-2030 (%)
Data Table on Deployment - Market share 2025-2030 (%)

10.2 Comparison by Deployment

Chart on Comparison by Deployment
Data Table on Comparison by Deployment

10.3 Cloud-based - Market size and forecast 2025-2030

Chart on Cloud-based - Market size and forecast 2025-2030 ($ million)
Data Table on Cloud-based - Market size and forecast 2025-2030 ($ million)
Chart on Cloud-based - Year-over-year growth 2025-2030 (%)
Data Table on Cloud-based - Year-over-year growth 2025-2030 (%)

10.4 On-premises - Market size and forecast 2025-2030

Chart on On-premises - Market size and forecast 2025-2030 ($ million)
Data Table on On-premises - Market size and forecast 2025-2030 ($ million)
Chart on On-premises - Year-over-year growth 2025-2030 (%)
Data Table on On-premises - Year-over-year growth 2025-2030 (%)

10.5 Market opportunity by Deployment

Market opportunity by Deployment ($ million)
Data Table on Market opportunity by Deployment ($ million)

11. Customer Landscape

11.1 Customer landscape overview

Analysis of price sensitivity, lifecycle, customer purchase basket, adoption rates, and purchase criteria

12. Geographic Landscape

12.1 Geographic segmentation

Chart on Market share by geography 2025-2030 (%)
Data Table on Market share by geography 2025-2030 (%)

12.2 Geographic comparison

Chart on Geographic comparison
Data Table on Geographic comparison

12.3 North America - Market size and forecast 2025-2030

Chart on North America - Market size and forecast 2025-2030 ($ million)
Data Table on North America - Market size and forecast 2025-2030 ($ million)
Chart on North America - Year-over-year growth 2025-2030 (%)
Data Table on North America - Year-over-year growth 2025-2030 (%)
Chart on Regional Comparison - North America
Data Table on Regional Comparison - North America

12.3.1 US - Market size and forecast 2025-2030

Chart on US - Market size and forecast 2025-2030 ($ million)
Data Table on US - Market size and forecast 2025-2030 ($ million)
Chart on US - Year-over-year growth 2025-2030 (%)
Data Table on US - Year-over-year growth 2025-2030 (%)

12.3.2 Canada - Market size and forecast 2025-2030

Chart on Canada - Market size and forecast 2025-2030 ($ million)
Data Table on Canada - Market size and forecast 2025-2030 ($ million)
Chart on Canada - Year-over-year growth 2025-2030 (%)
Data Table on Canada - Year-over-year growth 2025-2030 (%)

12.3.3 Mexico - Market size and forecast 2025-2030

Chart on Mexico - Market size and forecast 2025-2030 ($ million)
Data Table on Mexico - Market size and forecast 2025-2030 ($ million)
Chart on Mexico - Year-over-year growth 2025-2030 (%)
Data Table on Mexico - Year-over-year growth 2025-2030 (%)

12.4 APAC - Market size and forecast 2025-2030

Chart on APAC - Market size and forecast 2025-2030 ($ million)
Data Table on APAC - Market size and forecast 2025-2030 ($ million)
Chart on APAC - Year-over-year growth 2025-2030 (%)
Data Table on APAC - Year-over-year growth 2025-2030 (%)
Chart on Regional Comparison - APAC
Data Table on Regional Comparison - APAC

12.4.1 China - Market size and forecast 2025-2030

Chart on China - Market size and forecast 2025-2030 ($ million)
Data Table on China - Market size and forecast 2025-2030 ($ million)
Chart on China - Year-over-year growth 2025-2030 (%)
Data Table on China - Year-over-year growth 2025-2030 (%)

12.4.2 Japan - Market size and forecast 2025-2030

Chart on Japan - Market size and forecast 2025-2030 ($ million)
Data Table on Japan - Market size and forecast 2025-2030 ($ million)
Chart on Japan - Year-over-year growth 2025-2030 (%)
Data Table on Japan - Year-over-year growth 2025-2030 (%)

12.4.3 India - Market size and forecast 2025-2030

Chart on India - Market size and forecast 2025-2030 ($ million)
Data Table on India - Market size and forecast 2025-2030 ($ million)
Chart on India - Year-over-year growth 2025-2030 (%)
Data Table on India - Year-over-year growth 2025-2030 (%)

12.4.4 South Korea - Market size and forecast 2025-2030

Chart on South Korea - Market size and forecast 2025-2030 ($ million)
Data Table on South Korea - Market size and forecast 2025-2030 ($ million)
Chart on South Korea - Year-over-year growth 2025-2030 (%)
Data Table on South Korea - Year-over-year growth 2025-2030 (%)

12.4.5 Australia - Market size and forecast 2025-2030

Chart on Australia - Market size and forecast 2025-2030 ($ million)
Data Table on Australia - Market size and forecast 2025-2030 ($ million)
Chart on Australia - Year-over-year growth 2025-2030 (%)
Data Table on Australia - Year-over-year growth 2025-2030 (%)

12.4.6 Indonesia - Market size and forecast 2025-2030

Chart on Indonesia - Market size and forecast 2025-2030 ($ million)
Data Table on Indonesia - Market size and forecast 2025-2030 ($ million)
Chart on Indonesia - Year-over-year growth 2025-2030 (%)
Data Table on Indonesia - Year-over-year growth 2025-2030 (%)

12.5 Europe - Market size and forecast 2025-2030

Chart on Europe - Market size and forecast 2025-2030 ($ million)
Data Table on Europe - Market size and forecast 2025-2030 ($ million)
Chart on Europe - Year-over-year growth 2025-2030 (%)
Data Table on Europe - Year-over-year growth 2025-2030 (%)
Chart on Regional Comparison - Europe
Data Table on Regional Comparison - Europe

12.5.1 Germany - Market size and forecast 2025-2030

Chart on Germany - Market size and forecast 2025-2030 ($ million)
Data Table on Germany - Market size and forecast 2025-2030 ($ million)
Chart on Germany - Year-over-year growth 2025-2030 (%)
Data Table on Germany - Year-over-year growth 2025-2030 (%)

12.5.2 UK - Market size and forecast 2025-2030

Chart on UK - Market size and forecast 2025-2030 ($ million)
Data Table on UK - Market size and forecast 2025-2030 ($ million)
Chart on UK - Year-over-year growth 2025-2030 (%)
Data Table on UK - Year-over-year growth 2025-2030 (%)

12.5.3 France - Market size and forecast 2025-2030

Chart on France - Market size and forecast 2025-2030 ($ million)
Data Table on France - Market size and forecast 2025-2030 ($ million)
Chart on France - Year-over-year growth 2025-2030 (%)
Data Table on France - Year-over-year growth 2025-2030 (%)

12.5.4 Italy - Market size and forecast 2025-2030

Chart on Italy - Market size and forecast 2025-2030 ($ million)
Data Table on Italy - Market size and forecast 2025-2030 ($ million)
Chart on Italy - Year-over-year growth 2025-2030 (%)
Data Table on Italy - Year-over-year growth 2025-2030 (%)

12.5.5 Spain - Market size and forecast 2025-2030

Chart on Spain - Market size and forecast 2025-2030 ($ million)
Data Table on Spain - Market size and forecast 2025-2030 ($ million)
Chart on Spain - Year-over-year growth 2025-2030 (%)
Data Table on Spain - Year-over-year growth 2025-2030 (%)

12.5.6 The Netherlands - Market size and forecast 2025-2030

Chart on The Netherlands - Market size and forecast 2025-2030 ($ million)
Data Table on The Netherlands - Market size and forecast 2025-2030 ($ million)
Chart on The Netherlands - Year-over-year growth 2025-2030 (%)
Data Table on The Netherlands - Year-over-year growth 2025-2030 (%)

12.6 South America - Market size and forecast 2025-2030

Chart on South America - Market size and forecast 2025-2030 ($ million)
Data Table on South America - Market size and forecast 2025-2030 ($ million)
Chart on South America - Year-over-year growth 2025-2030 (%)
Data Table on South America - Year-over-year growth 2025-2030 (%)
Chart on Regional Comparison - South America
Data Table on Regional Comparison - South America

12.6.1 Brazil - Market size and forecast 2025-2030

Chart on Brazil - Market size and forecast 2025-2030 ($ million)
Data Table on Brazil - Market size and forecast 2025-2030 ($ million)
Chart on Brazil - Year-over-year growth 2025-2030 (%)
Data Table on Brazil - Year-over-year growth 2025-2030 (%)

12.6.2 Argentina - Market size and forecast 2025-2030

Chart on Argentina - Market size and forecast 2025-2030 ($ million)
Data Table on Argentina - Market size and forecast 2025-2030 ($ million)
Chart on Argentina - Year-over-year growth 2025-2030 (%)
Data Table on Argentina - Year-over-year growth 2025-2030 (%)

12.6.3 Chile - Market size and forecast 2025-2030

Chart on Chile - Market size and forecast 2025-2030 ($ million)
Data Table on Chile - Market size and forecast 2025-2030 ($ million)
Chart on Chile - Year-over-year growth 2025-2030 (%)
Data Table on Chile - Year-over-year growth 2025-2030 (%)

12.7 Middle East and Africa - Market size and forecast 2025-2030

Chart on Middle East and Africa - Market size and forecast 2025-2030 ($ million)
Data Table on Middle East and Africa - Market size and forecast 2025-2030 ($ million)
Chart on Middle East and Africa - Year-over-year growth 2025-2030 (%)
Data Table on Middle East and Africa - Year-over-year growth 2025-2030 (%)
Chart on Regional Comparison - Middle East and Africa
Data Table on Regional Comparison - Middle East and Africa

12.7.1 Saudi Arabia - Market size and forecast 2025-2030

Chart on Saudi Arabia - Market size and forecast 2025-2030 ($ million)
Data Table on Saudi Arabia - Market size and forecast 2025-2030 ($ million)
Chart on Saudi Arabia - Year-over-year growth 2025-2030 (%)
Data Table on Saudi Arabia - Year-over-year growth 2025-2030 (%)

12.7.2 UAE - Market size and forecast 2025-2030

Chart on UAE - Market size and forecast 2025-2030 ($ million)
Data Table on UAE - Market size and forecast 2025-2030 ($ million)
Chart on UAE - Year-over-year growth 2025-2030 (%)
Data Table on UAE - Year-over-year growth 2025-2030 (%)

12.7.3 South Africa - Market size and forecast 2025-2030

Chart on South Africa - Market size and forecast 2025-2030 ($ million)
Data Table on South Africa - Market size and forecast 2025-2030 ($ million)
Chart on South Africa - Year-over-year growth 2025-2030 (%)
Data Table on South Africa - Year-over-year growth 2025-2030 (%)

12.7.4 Israel - Market size and forecast 2025-2030

Chart on Israel - Market size and forecast 2025-2030 ($ million)
Data Table on Israel - Market size and forecast 2025-2030 ($ million)
Chart on Israel - Year-over-year growth 2025-2030 (%)
Data Table on Israel - Year-over-year growth 2025-2030 (%)

12.7.5 Turkey - Market size and forecast 2025-2030

Chart on Turkey - Market size and forecast 2025-2030 ($ million)
Data Table on Turkey - Market size and forecast 2025-2030 ($ million)
Chart on Turkey - Year-over-year growth 2025-2030 (%)
Data Table on Turkey - Year-over-year growth 2025-2030 (%)

12.8 Market opportunity by geography

Market opportunity by geography ($ million)
Data Tables on Market opportunity by geography ($ million)

13. Drivers, Challenges, and Opportunity

13.1 Market drivers

Unstructured data growth and information fragmentation
Generative AI and RAG adoption in semantic discovery
Regulatory governance and zero-trust access controls

13.2 Market challenges

Permission vulnerabilities in semantic retrieval
Rising computational costs and scalability challenges
Repository fragmentation and content freshness issues

13.3 Impact of drivers and challenges

Impact of drivers and challenges in 2025 and 2030

13.4 Market opportunities

Storage-optimized vector infrastructure at scale
Enterprise content management and agentic search
On-premises and sovereign cloud adoption

14. Competitive Landscape

14.1 Overview

14.2

Overview on criticality of inputs and factors of differentiation

14.3 Landscape disruption

Overview on factors of disruption

14.4 Industry risks

Impact of key risks on business

15. Competitive Analysis

15.1 Companies profiled

Companies covered

15.2 Company ranking index

15.3 Market positioning of companies

Matrix on companies position and classification

15.4 Amazon.com Inc.

Amazon.com Inc. - Overview
Amazon.com Inc. - Business segments
Amazon.com Inc. - Key news
Amazon.com Inc. - Key offerings
Amazon.com Inc. - Segment focus
SWOT

15.5 Atlassian Corp.

Atlassian Corp. - Overview
Atlassian Corp. - Product / Service
Atlassian Corp. - Key news
Atlassian Corp. - Key offerings
SWOT

15.6 Elasticsearch B.V.

Elasticsearch B.V. - Overview
Elasticsearch B.V. - Product / Service
Elasticsearch B.V. - Key offerings
SWOT

15.7 Google LLC

Google LLC - Overview
Google LLC - Product / Service
Google LLC - Key news
Google LLC - Key offerings
SWOT

15.8 Guru Technologies Inc.

Guru Technologies Inc. - Overview
Guru Technologies Inc. - Product / Service
Guru Technologies Inc. - Key offerings
SWOT

15.9 IBM Corp.

IBM Corp. - Overview
IBM Corp. - Business segments
IBM Corp. - Key news
IBM Corp. - Key offerings
IBM Corp. - Segment focus
SWOT

15.10 IntraFind Software AG

IntraFind Software AG - Overview
IntraFind Software AG - Product / Service
IntraFind Software AG - Key offerings
SWOT

15.11 M Files Oy

M Files Oy - Overview
M Files Oy - Product / Service
M Files Oy - Key offerings
SWOT

15.12 Microsoft Corp.

Microsoft Corp. - Overview
Microsoft Corp. - Business segments
Microsoft Corp. - Key news
Microsoft Corp. - Key offerings
Microsoft Corp. - Segment focus
SWOT

15.13 Notion Labs Inc.

Notion Labs Inc. - Overview
Notion Labs Inc. - Product / Service
Notion Labs Inc. - Key offerings
SWOT

15.14 Open Text Corp.

Open Text Corp. - Overview
Open Text Corp. - Business segments
Open Text Corp. - Key news
Open Text Corp. - Key offerings
Open Text Corp. - Segment focus
SWOT

15.15 Oracle Corp.

Oracle Corp. - Overview
Oracle Corp. - Business segments
Oracle Corp. - Key news
Oracle Corp. - Key offerings
Oracle Corp. - Segment focus
SWOT

15.16 SAP SE

SAP SE - Overview
SAP SE - Business segments
SAP SE - Key news
SAP SE - Key offerings
SAP SE - Segment focus
SWOT

15.17 Upland Software Inc.

Upland Software Inc. - Overview
Upland Software Inc. - Product / Service
Upland Software Inc. - Key offerings
SWOT

15.18 Yext Inc.

Yext Inc. - Overview
Yext Inc. - Product / Service
Yext Inc. - Key offerings
SWOT

16. Appendix

16.1 Scope of the report

Market definition
Objectives
Notes and caveats

16.2 Inclusions and exclusions checklist

Inclusions checklist
Exclusions checklist

16.3 Currency conversion rates for US$

16.4 Research methodology

16.5 Data procurement

Information sources

16.6 Data validation

16.7 Validation techniques employed for market sizing

16.8 Data synthesis

16.9 360 degree market analysis

16.10 List of abbreviations

Research Methodology

Technavio presents a detailed picture of the market by way of study, synthesis, and summation of data from multiple sources. The analysts have presented the various facets of the market with a particular focus on identifying the key industry influencers. The data thus presented is comprehensive, reliable, and the result of extensive research, both primary and secondary.

INFORMATION SOURCES

Primary sources

  • Manufacturers and suppliers
  • Channel partners
  • Industry experts
  • Strategic decision makers

Secondary sources

  • Industry journals and periodicals
  • Government data
  • Financial reports of key industry players
  • Historical data
  • Press releases

DATA ANALYSIS

Data Synthesis

  • Collation of data
  • Estimation of key figures
  • Analysis of derived insights

Data Validation

  • Triangulation with data models
  • Reference against proprietary databases
  • Corroboration with industry experts

REPORT WRITING

Qualitative

  • Market drivers
  • Market challenges
  • Market trends
  • Five forces analysis

Quantitative

  • Market size and forecast
  • Market segmentation
  • Geographical insights
  • Competitive landscape

Interested in this report?

Get your sample now to see our research methodology and insights!

Download Now

Frequently Asked Questions

Enterprise Search market growth will increase by USD 4667.2 million during 2026-2030.

The Enterprise Search market is expected to grow at a CAGR of 10.6% during 2026-2030.

Enterprise Search market is segmented by Type (Local search, Hosted search) End-user (Large enterprises, SMEs) Deployment (Cloud-based, On-premises)

Algolia Inc., Amazon.com Inc., Atlassian Corp., Coveo Solutions Inc., Elasticsearch B.V., Glean Technologies Inc., Google LLC, Guru Technologies Inc., IBM Corp., IntraFind Software AG, Lucidworks Inc., M Files Oy, Microsoft Corp., Mindbreeze GmbH, Notion Labs Inc., Open Text Corp., Oracle Corp., SAP SE, SearchUnify, Squirro AG, Upland Software Inc., Yext Inc. are a few of the key vendors in the Enterprise Search market.

North America will register the highest growth rate of 47.3% among the other regions. Therefore, the Enterprise Search market in North America is expected to garner significant business opportunities for the vendors during the forecast period.

US, Canada, Mexico, China, Japan, India, South Korea, Australia, Indonesia, Germany, UK, France, Italy, Spain, The Netherlands, Brazil, Argentina, Chile, Saudi Arabia, UAE, South Africa, Israel, Turkey

  • Unstructured data growth and information fragmentation is the driving factor this market.

The Enterprise Search market vendors should focus on grabbing business opportunities from the Type segment as it accounted for the largest market share in the base year.
RIA - Research AI Assistant
Ask RIA