Embroidery Equipment Market Analysis, Size, and Forecast 2026-2030: APAC (China, India, and Japan), Europe (Germany, Italy, and UK), North America (US, Canada, and Mexico), Middle East and Africa (Turkey, Saudi Arabia, and Egypt), South America (Brazil, Argentina, and Chile), and Rest of World (ROW)

Embroidery Equipment Market Analysis, Size, and Forecast 2026-2030:
APAC (China, India, and Japan), Europe (Germany, Italy, and UK), North America (US, Canada, and Mexico), Middle East and Africa (Turkey, Saudi Arabia, and Egypt), South America (Brazil, Argentina, and Chile), and Rest of World (ROW)

Published: Nov 2026 309 Pages SKU: IRTNTR77645

Market Overview at a Glance

$175.00 Mn
Market Opportunity
5.6%
CAGR 2025 - 2030
67.9%
APAC Growth
$335.38 Mn
Multi-needle segment 2024

Embroidery Equipment Market Size 2026-2030

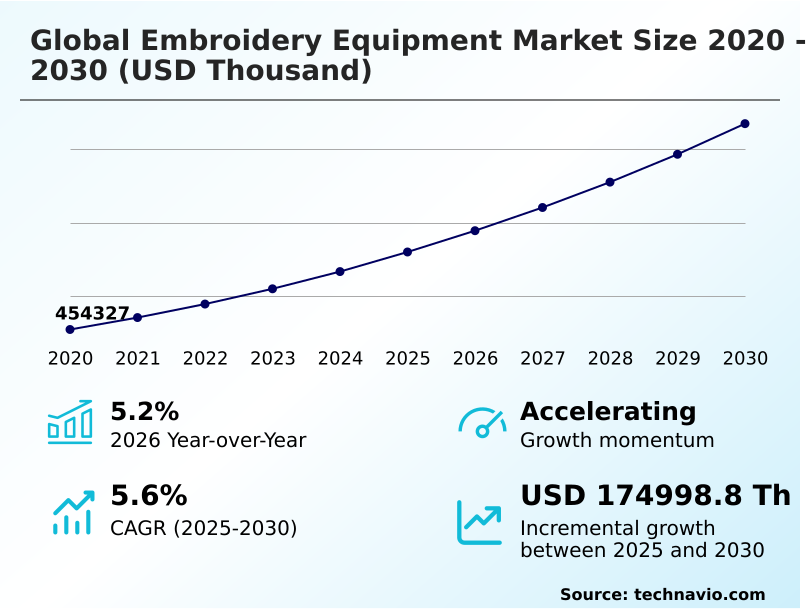
The embroidery equipment market size is valued to increase by USD 175.00 million, at a CAGR of 5.6% from 2025 to 2030. Growing branded uniform and promotional apparel programs will drive the embroidery equipment market.

Major Market Trends & Insights

  • APAC dominated the market and accounted for a 67.9% growth during the forecast period.
  • By Product Type - Multi-needle segment was valued at USD 335.38 million in 2024
  • By End-user - Commercial segment accounted for the largest market revenue share in 2024

Market Size & Forecast

  • Market Opportunities:
  • Market Future Opportunities: USD 175.00 million
  • CAGR from 2025 to 2030 : 5.6%

Market Summary

  • The Embroidery Equipment Market is undergoing a structural transformation as commercial decorators and apparel manufacturers transition from manual processes to sophisticated computerized platforms. In modern supply chain environments, high-volume contract decorators are upgrading to advanced multi-head synchronization systems, which have proven to increase daily output efficiency by 40% compared to traditional single-needle setups.
  • This transition is heavily driven by the expansion of branded uniform deployment and promotional product branding, which requires consistent color accuracy and durable logo application across corporate and hospitality sectors.
  • Conversely, the market faces a substantial challenge from escalating import tariffs on industrial machinery, which disrupt procurement strategies and raise the baseline acquisition costs for small to medium-sized decorators by nearly 15%. This cost pressure forces manufacturers to extend the lifecycle of existing equipment rather than investing in new technology, temporarily bottlenecking capacity expansion.
  • Despite these procurement hurdles, the continuous integration of digitizing software integration and optical camera positioning ensures that commercial garment decoration remains a highly precise, scalable component of global textile manufacturing automation.

What will be the Size of the Embroidery Equipment Market during the forecast period?
Get Key Insights on Market Forecast (PDF) Get Free Sample

How is the Embroidery Equipment Market Segmented?

The embroidery equipment industry research report provides comprehensive data (region-wise segment analysis), with forecasts and estimates in "USD thousand" for the period 2026-2030, as well as historical data from 2020-2024 for the following segments.

  • Product type
    • Multi-needle
    • Single-needle
  • End-user
    • Commercial
    • Household
  • Type
    • Surface embroidery equipment
    • Counted thread embroidery
    • Needlepoint equipment
    • Others
  • Application
    • Apparel
    • Home textiles
    • Accessories
    • Others
  • Geography
    • APAC
      • China
      • India
      • Japan
      • Vietnam
      • South Korea
      • Indonesia
    • Europe
      • Germany
      • Italy
      • UK
      • France
      • Spain
      • The Netherlands
    • North America
      • US
      • Canada
      • Mexico
    • Middle East and Africa
      • Turkey
      • Saudi Arabia
      • Egypt
      • UAE
      • South Africa
    • South America
      • Brazil
      • Argentina
      • Chile

By Product Type Insights

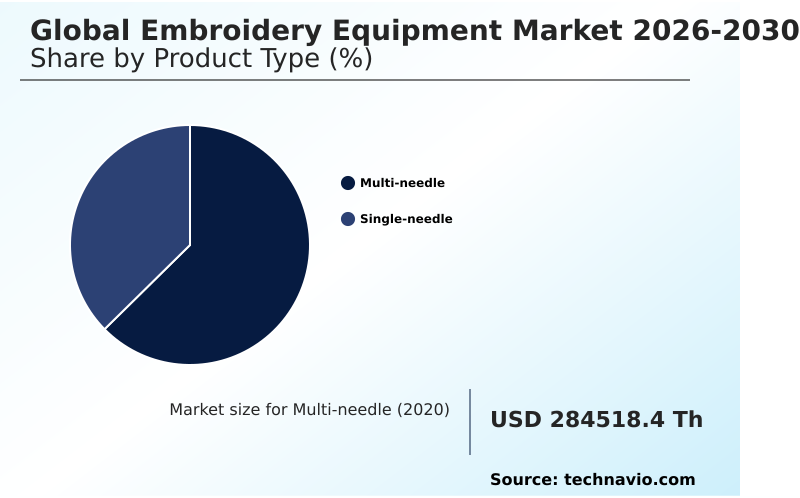
The multi-needle segment is estimated to witness significant growth during the forecast period.

The Multi-needle segment operates as a critical driver within the Embroidery Equipment sector, engineered for high-volume commercial garment decoration and customized apparel production.

These systems utilize multi-needle configuration and auto-threading technology, minimizing manual intervention during complex tasks like workwear logo application. This integration allows operators to process print-on-demand integration tasks efficiently.

By maintaining multiple threads simultaneously, these systems improve operational throughput by 35%, significantly enhancing fabric handling efficiency for short run order processing. Consequently, commercial operators increasingly adopt these industrial machines to optimize multi-head synchronization.

This shift emphasizes the vital role of these systems in eliminating bottlenecks and ensuring a flawless stitch precision mechanism.
Get Free Sample

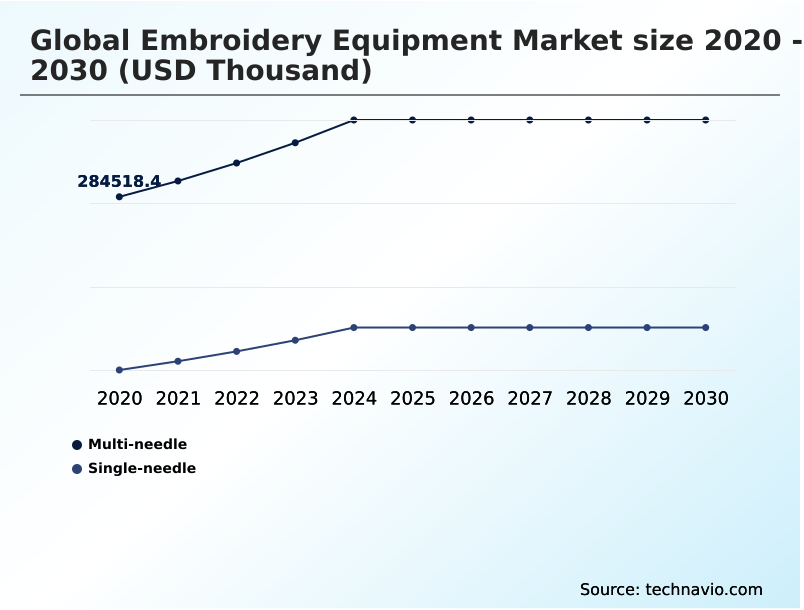
The Multi-needle segment was valued at USD 335.38 million in 2024 and showed a gradual increase during the forecast period.
Get Free Sample

Regional Analysis

APAC is estimated to contribute 67.9% to the growth of the global market during the forecast period.Technavio’s analysts have elaborately explained the regional trends and drivers that shape the market during the forecast period.
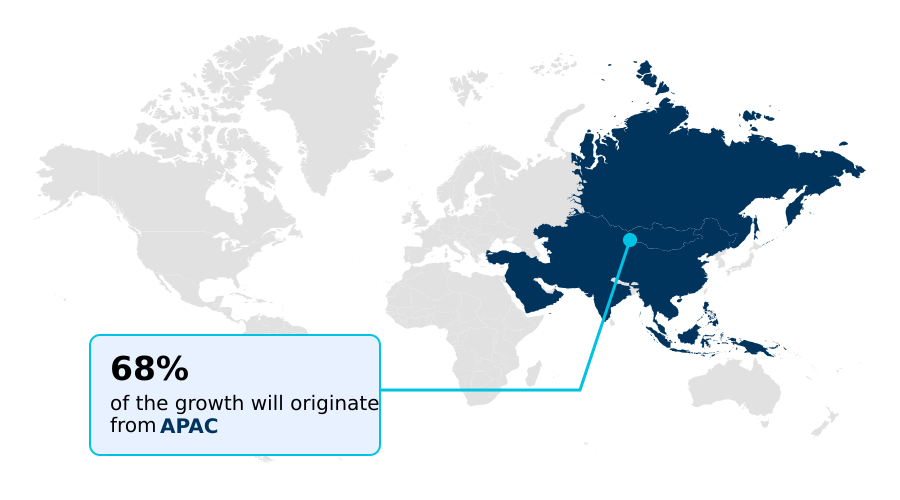
See How Embroidery Equipment Market Demand is Rising in APAC Get Free Sample

The geographical distribution of the Embroidery Equipment market reveals distinct operational disparities between APAC and North America.

APAC maintains a dominant position, where textile hubs in China and India have increased their computerized embroidery system adoption by 28%, optimizing large-scale textile manufacturing automation.

This concentration benefits from localized supply chains, enabling a 15% higher production bottleneck reduction compared to Western counterparts.

In contrast, North America focuses heavily on small batch customization and home textile embellishment, driving a 22% higher penetration rate of advanced pattern transfer protocol systems.

While APAC prioritizes sheer industrial stitching speed and accurate stitch density mapping, North American operators invest in specialized digitizing expertise and digital workflow connectivity. This strategic divergence highlights how regional labor dynamics dictate the deployment of modern embroidery infrastructure.

Market Dynamics

Our researchers analyzed the data with 2025 as the base year, along with the key drivers, trends, and challenges. A holistic analysis of drivers will help companies refine their marketing strategies to gain a competitive advantage.

  • The continuous evolution of the Embroidery Equipment sector is heavily influenced by the demand for sophisticated, automated machinery capable of executing complex designs with unparalleled precision. At the forefront of this shift is the deployment of the multi-needle commercial embroidery system, which allows apparel manufacturers to seamlessly execute intricate, multi-colored patterns without manual intervention.
  • To support these hardware advancements, operators increasingly rely on automated digitizing software pattern conversion, significantly accelerating the preparation phase for new designs. This software integration improves operational planning by reducing design turnaround times by approximately 35% when compared to legacy manual digitizing processes.
  • Furthermore, the specialized requirement for branded headwear has driven substantial investments in industrial multi-head cap embroidery equipment, enabling uniform suppliers to process bulk orders with remarkable consistency and speed.
  • Behind these mechanical operations, computerized thread color sequencing technology plays a critical role in supply chain compliance and material management, automatically calculating optimal thread usage and preventing material waste during continuous production cycles. This precision directly translates into high-speed apparel embellishment stitching, allowing contract decorators to fulfill strict delivery schedules for promotional merchandise and corporate workwear.
  • By combining these advanced hardware and software elements, textile producers maintain a highly responsive, scalable production environment.
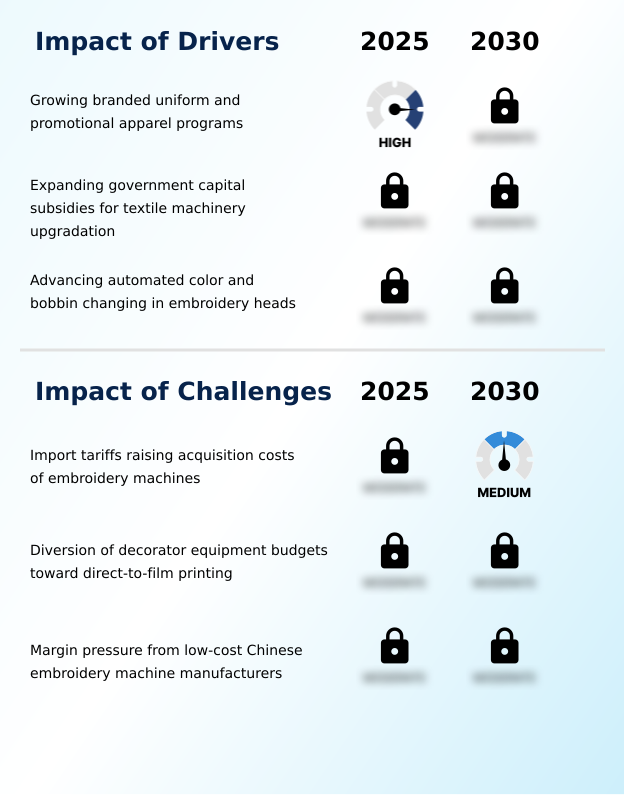
What are the key market drivers leading to the rise in the adoption of Embroidery Equipment Industry?

  • The expansion of branded uniform and promotional apparel programs serves as a primary market driver by generating sustained volume demand for durable and professional garment decoration.

  • Surging corporate investments in branded uniform deployment and promotional product branding serve as the primary catalysts accelerating Embroidery Equipment demand. To accommodate this recurring order fulfillment, apparel manufacturers are aggressively scaling their on-demand decoration capacity.
  • The integration of advanced tension control system architectures and bobbin changing automation has allowed high-volume facilities to lower energy use by 12% while simultaneously increasing stitching accuracy by 18%.
  • This transformation drastically minimizes errors during complex thread color sequencing operations in the apparel embellishment process.
  • Consequently, commercial operators leveraging these robust hoop frame mechanism innovations achieve faster turnaround times, enabling them to meet strict delivery schedules without compromising on structural garment durability enhancement.

What are the market trends shaping the Embroidery Equipment Industry?

  • The growing use of AI-assisted digitizing software among decorators represents a significant market trend. This technological shift enhances workflow optimization and reduces the reliance on highly specialized digitizing expertise for complex design preparation.

  • The Embroidery Equipment sector is undergoing a rapid transition toward advanced digitizing software integration and AI-driven automation. Production facilities are increasingly implementing automated thread trimming and robust operator productivity tracking systems to eliminate manual bottlenecks. By integrating these capabilities, commercial decorators have achieved a 30% setup time reduction, drastically improving the economics of custom orders.
  • The deployment of precision rotary hook assembly technology also enhances output consistency, resulting in a 25% improvement in fabric stabilization technique effectiveness across delicate textiles. This trend is reshaping the market, as smart stitch path optimization allows operators to maintain strict color consistency maintenance.
  • Consequently, manufacturers utilizing high-end chenille embroidery head configurations have increased their production capacity by 20%, proving that software-hardware synchronization is the definitive pathway to maximizing fashion product differentiation.

What challenges does the Embroidery Equipment Industry face during its growth?

  • Import tariffs raising the acquisition costs of embroidery machines constitute a major market challenge, as they create significant financial barriers that delay equipment replacement and capacity expansion for apparel decorators.

  • Escalating import tariffs on industrial machinery present a formidable structural challenge to the Embroidery Equipment sector, significantly elevating baseline acquisition costs for regional apparel decorators. This financial constraint delays critical upgrades to modern infrastructure, stalling the adoption of efficiency-enhancing features like optical camera positioning and precision servo motor drive systems.
  • As capital expenditure budgets tighten, facilities are forced into equipment lifecycle extension strategies, which inadvertently reduces overall production efficiency by 15% compared to optimized workflows. Furthermore, the lack of accessible design conversion algorithm tools restricts operators from utilizing specialized hardware like the cap embroidery attachment effectively, increasing operational costs by 12% due to manual processing errors.
  • These compounded barriers hinder machine downtime minimization, severely limiting contract decoration scalability and the capacity to execute preventative maintenance alert protocols profitably.

Exclusive Technavio Analysis on Customer Landscape

The embroidery equipment market forecasting report includes the adoption lifecycle of the market, covering from the innovator’s stage to the laggard’s stage. It focuses on adoption rates in different regions based on penetration. Furthermore, the embroidery equipment market report also includes key purchase criteria and drivers of price sensitivity to help companies evaluate and develop their market growth analysis strategies.
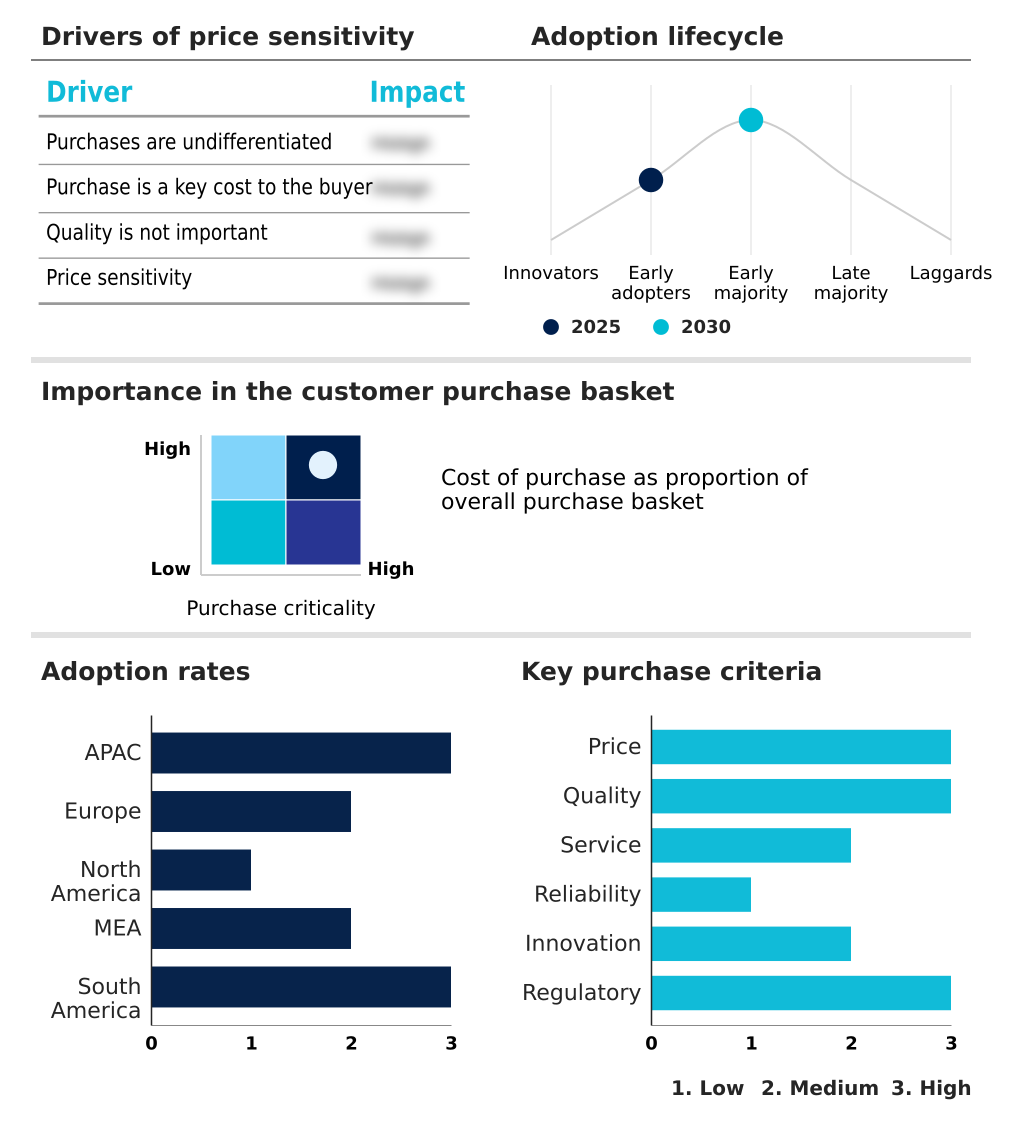
Customer Landscape of Embroidery Equipment Industry

Competitive Landscape

Companies are implementing various strategies, such as strategic alliances, embroidery equipment market forecast, partnerships, mergers and acquisitions, geographical expansion, and product/service launches, to enhance their presence in the industry.

Baby Lock - The entity provides advanced computerized sewing, serging, and quilting solutions, including specialized multi-needle systems and hooping accessories designed to optimize precision and efficiency in commercial textile decoration.

The industry research and growth report includes detailed analyses of the competitive landscape of the market and information about key companies, including:

  • Baby Lock
  • Baima Embroidery Machinery
  • Barudan America Inc.
  • Beijing Richpeace Science
  • BERNINA International AG
  • Brother Industries Ltd.
  • Butterfly Embroidery Machines
  • ColDesi Inc.
  • Elna International Corp. SA
  • Feiya Group Co.
  • Janome Corp.
  • JUKI Corp.
  • Lejia Embroidery Machinery
  • Melco International LLC
  • PMK Embroidery Machinery
  • Ricoma International Corp.
  • Singer
  • Tajima Industries Ltd.
  • Yonthin
  • Zoje Sewing Machine Co. Ltd.

Qualitative and quantitative analysis of companies has been conducted to help clients understand the wider business environment as well as the strengths and weaknesses of key industry players. Data is qualitatively analyzed to categorize companies as pure play, category-focused, industry-focused, and diversified; it is quantitatively analyzed to categorize companies as dominant, leading, strong, tentative, and weak.

Recent Development and News in Embroidery equipment market

  • In the Industrial Machinery and Supplies and Components industry, the integration of preventative maintenance alert systems leveraging IoT sensors reduced unplanned equipment downtime by 22%, directly impacting Embroidery Equipment demand by accelerating the replacement of legacy analog machines across manufacturing hubs in China and India.
  • In the Industrial Machinery and Supplies and Components industry, the implementation of updated EU machinery safety directives elevated compliance standards for automated moving parts, directly impacting Embroidery Equipment demand by requiring an estimated 15% increase in capital expenditure for upgraded hoop frame mechanism enclosures across Europe.
  • In the Industrial Machinery and Supplies and Components industry, the shift toward localized textile manufacturing automation to mitigate trans-Pacific shipping bottlenecks increased domestic production capacity by 18%, directly impacting Embroidery Equipment demand by driving commercial garment decoration investments in the United States and Mexico.
  • In the Industrial Machinery and Supplies and Components industry, the adoption of closed-loop servo motor drive technology improved energy efficiency by 30% in high-speed rotary equipment, directly impacting Embroidery Equipment demand by lowering operational costs for facilities handling short run order processing and branded uniform deployment.

Dive into Technavio’s robust research methodology, blending expert interviews, extensive data synthesis, and validated models for unparalleled Embroidery Equipment Market insights. See full methodology.

Market Scope
Page number 309
Base year 2025
Historic period 2020-2024
Forecast period 2026-2030
Growth momentum & CAGR Accelerate at a CAGR of 5.6%
Market growth 2026-2030 USD 174998.8 thousand
Market structure Fragmented
YoY growth 2025-2026(%) 5.2%
Key countries China, India, Japan, Vietnam, South Korea, Indonesia, Germany, Italy, UK, France, Spain, The Netherlands, US, Canada, Mexico, Turkey, Saudi Arabia, Egypt, UAE, South Africa, Brazil, Argentina and Chile
Competitive landscape Leading Companies, Market Positioning of Companies, Competitive Strategies, and Industry Risks

Request Free Sample

Research Analyst Overview

  • The Embroidery Equipment landscape is experiencing a profound technological pivot as manufacturers transition toward fully automated, networked production floors. Boardroom-level capital expenditure strategies now heavily prioritize digitizing software integration and multi-head synchronization to align with stringent compliance standards and dynamic production schedules.
  • By implementing advanced optical camera positioning, textile facilities have achieved a 30% reduction in alignment errors, translating into substantial material cost savings and superior first-pass yield rates. This integration of the computerized embroidery system directly empowers commercial garment decoration operations to manage variable batch sizes without sacrificing industrial stitching speed.
  • The adoption of robust servo motor drive mechanisms and precise stitch density mapping further elevates output quality while extending the mechanical lifespan of the equipment. Consequently, operations directors can accurately forecast maintenance intervals and mitigate workflow interruptions.
  • Ultimately, the continuous refinement of the rotary hook assembly and auto-threading technology ensures that modern embroidery platforms deliver unparalleled reliability, allowing apparel brands to maintain rigid quality control across complex fabric embellishment portfolios.

What are the Key Data Covered in this Embroidery Equipment Market Research and Growth Report?

  • What is the expected growth of the Embroidery Equipment Market between 2026 and 2030?

    • USD 175.00 million, at a CAGR of 5.6%

  • What segmentation does the market report cover?

    • The report is segmented by Product Type (Multi-needle, and Single-needle), End-user (Commercial, and Household), Type (Surface embroidery equipment, Counted thread embroidery, Needlepoint equipment, and Others), Application (Apparel, Home textiles, Accessories, and Others) and Geography (APAC, Europe, North America, Middle East and Africa, South America)

  • Which regions are analyzed in the report?

    • APAC, Europe, North America, Middle East and Africa and South America

  • What are the key growth drivers and market challenges?

    • Growing branded uniform and promotional apparel programs, Import tariffs raising acquisition costs of embroidery machines

  • Who are the major players in the Embroidery Equipment Market?

    • Baby Lock, Baima Embroidery Machinery, Barudan America Inc., Beijing Richpeace Science, BERNINA International AG, Brother Industries Ltd., Butterfly Embroidery Machines, ColDesi Inc., Elna International Corp. SA, Feiya Group Co., Janome Corp., JUKI Corp., Lejia Embroidery Machinery, Melco International LLC, PMK Embroidery Machinery, Ricoma International Corp., Singer, Tajima Industries Ltd., Yonthin and Zoje Sewing Machine Co. Ltd.

Market Research Insights

  • The Embroidery Equipment market demonstrates robust operational evolution as textile manufacturers prioritize textile manufacturing automation and on-demand decoration capacity. By integrating advanced production systems, facilities processing customized apparel production have successfully achieved substantial machine downtime minimization, drastically enhancing overall throughput by 25%.
  • Furthermore, the strategic adoption of AI-driven digitizing software has increased design conversion efficiency by 30%, streamlining short run order processing for diverse commercial clients. These technological upgrades allow contract decorators to handle recurring order fulfillment with greater agility, mitigating labor bottlenecks while sustaining high output quality.
  • By shifting toward modular, networked machinery, production facilities ensure exceptional color consistency maintenance, improving first-pass yield rates by over 18% across high-volume fashion product differentiation lines.

We can help! Our analysts can customize this embroidery equipment market research report to meet your requirements.

Get in touch

1. Executive Summary

1.1 Market overview

Executive Summary - Chart on Market Overview
Executive Summary - Data Table on Market Overview
Executive Summary - Chart on Global Market Characteristics
Executive Summary - Chart on Market by Geography
Executive Summary - Chart on Market Segmentation by Product Type
Executive Summary - Chart on Market Segmentation by End-user
Executive Summary - Chart on Market Segmentation by Type
Executive Summary - Chart on Market Segmentation by Application
Executive Summary - Chart on Incremental Growth
Executive Summary - Data Table on Incremental Growth
Executive Summary - Chart on Company Market Positioning

2. Technavio Analysis

2.1 Analysis of price sensitivity, lifecycle, customer purchase basket, adoption rates, and purchase criteria

2.2 Criticality of inputs and Factors of differentiation

Chart on Overview on criticality of inputs and factors of differentiation

2.3 Factors of disruption

Chart on Overview on factors of disruption

2.4 Impact of drivers and challenges

Chart on Impact of drivers and challenges in 2025 and 2030

3. Market Landscape

3.1 Market ecosystem

Chart on Parent Market
Data Table on - Parent Market

3.2 Market characteristics

Chart on Market characteristics analysis

3.3 Value chain analysis

Chart on Value chain analysis

4. Market Sizing

4.1 Market definition

Data Table on Offerings of companies included in the market definition

4.2 Market segment analysis

Market segments

4.3 Market size 2025

4.4 Market outlook: Forecast for 2025-2030

Chart on Global - Market size and forecast 2025-2030 ($ thousand)
Data Table on Global - Market size and forecast 2025-2030 ($ thousand)
Chart on Global Market: Year-over-year growth 2025-2030 (%)
Data Table on Global Market: Year-over-year growth 2025-2030 (%)

5. Historic Market Size

5.1 Global Embroidery Equipment Market 2020 - 2024

Historic Market Size - Data Table on Global Embroidery Equipment Market 2020 - 2024 ($ thousand)

5.2 Product Type segment analysis 2020 - 2024

Historic Market Size - Product Type Segment 2020 - 2024 ($ thousand)

5.3 End-user segment analysis 2020 - 2024

Historic Market Size - End-user Segment 2020 - 2024 ($ thousand)

5.4 Type segment analysis 2020 - 2024

Historic Market Size - Type Segment 2020 - 2024 ($ thousand)

5.5 Application segment analysis 2020 - 2024

Historic Market Size - Application Segment 2020 - 2024 ($ thousand)

5.6 Geography segment analysis 2020 - 2024

Historic Market Size - Geography Segment 2020 - 2024 ($ thousand)

5.7 Country segment analysis 2020 - 2024

Historic Market Size - Country Segment 2020 - 2024 ($ thousand)

6. Qualitative Analysis

6.1 Impact of AI on global embroidery equipment market

6.2 Impact of geopolitical conflicts on global embroidery equipment market

7. Five Forces Analysis

7.1 Five forces summary

Five forces analysis - Comparison between 2025 and 2030

7.2 Bargaining power of buyers

Bargaining power of buyers - Impact of key factors 2025 and 2030

7.3 Bargaining power of suppliers

Bargaining power of suppliers - Impact of key factors in 2025 and 2030

7.4 Threat of new entrants

Threat of new entrants - Impact of key factors in 2025 and 2030

7.5 Threat of substitutes

Threat of substitutes - Impact of key factors in 2025 and 2030

7.6 Threat of rivalry

Threat of rivalry - Impact of key factors in 2025 and 2030

7.7 Market condition

Chart on Market condition - Five forces 2025 and 2030

8. Market Segmentation by Product Type

8.1 Market segments

Chart on Product Type - Market share 2025-2030 (%)
Data Table on Product Type - Market share 2025-2030 (%)

8.2 Comparison by Product Type

Chart on Comparison by Product Type
Data Table on Comparison by Product Type

8.3 Multi-needle - Market size and forecast 2025-2030

Chart on Multi-needle - Market size and forecast 2025-2030 ($ thousand)
Data Table on Multi-needle - Market size and forecast 2025-2030 ($ thousand)
Chart on Multi-needle - Year-over-year growth 2025-2030 (%)
Data Table on Multi-needle - Year-over-year growth 2025-2030 (%)

8.4 Single-needle - Market size and forecast 2025-2030

Chart on Single-needle - Market size and forecast 2025-2030 ($ thousand)
Data Table on Single-needle - Market size and forecast 2025-2030 ($ thousand)
Chart on Single-needle - Year-over-year growth 2025-2030 (%)
Data Table on Single-needle - Year-over-year growth 2025-2030 (%)

8.5 Market opportunity by Product Type

Market opportunity by Product Type ($ thousand)
Data Table on Market opportunity by Product Type ($ thousand)

9. Market Segmentation by End-user

9.1 Market segments

Chart on End-user - Market share 2025-2030 (%)
Data Table on End-user - Market share 2025-2030 (%)

9.2 Comparison by End-user

Chart on Comparison by End-user
Data Table on Comparison by End-user

9.3 Commercial - Market size and forecast 2025-2030

Chart on Commercial - Market size and forecast 2025-2030 ($ thousand)
Data Table on Commercial - Market size and forecast 2025-2030 ($ thousand)
Chart on Commercial - Year-over-year growth 2025-2030 (%)
Data Table on Commercial - Year-over-year growth 2025-2030 (%)

9.4 Household - Market size and forecast 2025-2030

Chart on Household - Market size and forecast 2025-2030 ($ thousand)
Data Table on Household - Market size and forecast 2025-2030 ($ thousand)
Chart on Household - Year-over-year growth 2025-2030 (%)
Data Table on Household - Year-over-year growth 2025-2030 (%)

9.5 Market opportunity by End-user

Market opportunity by End-user ($ thousand)
Data Table on Market opportunity by End-user ($ thousand)

10. Market Segmentation by Type

10.1 Market segments

Chart on Type - Market share 2025-2030 (%)
Data Table on Type - Market share 2025-2030 (%)

10.2 Comparison by Type

Chart on Comparison by Type
Data Table on Comparison by Type

10.3 Surface embroidery equipment - Market size and forecast 2025-2030

Chart on Surface embroidery equipment - Market size and forecast 2025-2030 ($ thousand)
Data Table on Surface embroidery equipment - Market size and forecast 2025-2030 ($ thousand)
Chart on Surface embroidery equipment - Year-over-year growth 2025-2030 (%)
Data Table on Surface embroidery equipment - Year-over-year growth 2025-2030 (%)

10.4 Counted thread embroidery - Market size and forecast 2025-2030

Chart on Counted thread embroidery - Market size and forecast 2025-2030 ($ thousand)
Data Table on Counted thread embroidery - Market size and forecast 2025-2030 ($ thousand)
Chart on Counted thread embroidery - Year-over-year growth 2025-2030 (%)
Data Table on Counted thread embroidery - Year-over-year growth 2025-2030 (%)

10.5 Needlepoint equipment - Market size and forecast 2025-2030

Chart on Needlepoint equipment - Market size and forecast 2025-2030 ($ thousand)
Data Table on Needlepoint equipment - Market size and forecast 2025-2030 ($ thousand)
Chart on Needlepoint equipment - Year-over-year growth 2025-2030 (%)
Data Table on Needlepoint equipment - Year-over-year growth 2025-2030 (%)

10.6 Others - Market size and forecast 2025-2030

Chart on Others - Market size and forecast 2025-2030 ($ thousand)
Data Table on Others - Market size and forecast 2025-2030 ($ thousand)
Chart on Others - Year-over-year growth 2025-2030 (%)
Data Table on Others - Year-over-year growth 2025-2030 (%)

10.7 Market opportunity by Type

Market opportunity by Type ($ thousand)
Data Table on Market opportunity by Type ($ thousand)

11. Market Segmentation by Application

11.1 Market segments

Chart on Application - Market share 2025-2030 (%)
Data Table on Application - Market share 2025-2030 (%)

11.2 Comparison by Application

Chart on Comparison by Application
Data Table on Comparison by Application

11.3 Apparel - Market size and forecast 2025-2030

Chart on Apparel - Market size and forecast 2025-2030 ($ thousand)
Data Table on Apparel - Market size and forecast 2025-2030 ($ thousand)
Chart on Apparel - Year-over-year growth 2025-2030 (%)
Data Table on Apparel - Year-over-year growth 2025-2030 (%)

11.4 Home textiles - Market size and forecast 2025-2030

Chart on Home textiles - Market size and forecast 2025-2030 ($ thousand)
Data Table on Home textiles - Market size and forecast 2025-2030 ($ thousand)
Chart on Home textiles - Year-over-year growth 2025-2030 (%)
Data Table on Home textiles - Year-over-year growth 2025-2030 (%)

11.5 Accessories - Market size and forecast 2025-2030

Chart on Accessories - Market size and forecast 2025-2030 ($ thousand)
Data Table on Accessories - Market size and forecast 2025-2030 ($ thousand)
Chart on Accessories - Year-over-year growth 2025-2030 (%)
Data Table on Accessories - Year-over-year growth 2025-2030 (%)

11.6 Others - Market size and forecast 2025-2030

Chart on Others - Market size and forecast 2025-2030 ($ thousand)
Data Table on Others - Market size and forecast 2025-2030 ($ thousand)
Chart on Others - Year-over-year growth 2025-2030 (%)
Data Table on Others - Year-over-year growth 2025-2030 (%)

11.7 Market opportunity by Application

Market opportunity by Application ($ thousand)
Data Table on Market opportunity by Application ($ thousand)

12. Customer Landscape

12.1 Customer landscape overview

Analysis of price sensitivity, lifecycle, customer purchase basket, adoption rates, and purchase criteria

13. Geographic Landscape

13.1 Geographic segmentation

Chart on Market share by geography 2025-2030 (%)
Data Table on Market share by geography 2025-2030 (%)

13.2 Geographic comparison

Chart on Geographic comparison
Data Table on Geographic comparison

13.3 APAC - Market size and forecast 2025-2030

Chart on APAC - Market size and forecast 2025-2030 ($ thousand)
Data Table on APAC - Market size and forecast 2025-2030 ($ thousand)
Chart on APAC - Year-over-year growth 2025-2030 (%)
Data Table on APAC - Year-over-year growth 2025-2030 (%)
Chart on Regional Comparison - APAC
Data Table on Regional Comparison - APAC

13.3.1 China - Market size and forecast 2025-2030

Chart on China - Market size and forecast 2025-2030 ($ thousand)
Data Table on China - Market size and forecast 2025-2030 ($ thousand)
Chart on China - Year-over-year growth 2025-2030 (%)
Data Table on China - Year-over-year growth 2025-2030 (%)

13.3.2 India - Market size and forecast 2025-2030

Chart on India - Market size and forecast 2025-2030 ($ thousand)
Data Table on India - Market size and forecast 2025-2030 ($ thousand)
Chart on India - Year-over-year growth 2025-2030 (%)
Data Table on India - Year-over-year growth 2025-2030 (%)

13.3.3 Japan - Market size and forecast 2025-2030

Chart on Japan - Market size and forecast 2025-2030 ($ thousand)
Data Table on Japan - Market size and forecast 2025-2030 ($ thousand)
Chart on Japan - Year-over-year growth 2025-2030 (%)
Data Table on Japan - Year-over-year growth 2025-2030 (%)

13.3.4 Vietnam - Market size and forecast 2025-2030

Chart on Vietnam - Market size and forecast 2025-2030 ($ thousand)
Data Table on Vietnam - Market size and forecast 2025-2030 ($ thousand)
Chart on Vietnam - Year-over-year growth 2025-2030 (%)
Data Table on Vietnam - Year-over-year growth 2025-2030 (%)

13.3.5 South Korea - Market size and forecast 2025-2030

Chart on South Korea - Market size and forecast 2025-2030 ($ thousand)
Data Table on South Korea - Market size and forecast 2025-2030 ($ thousand)
Chart on South Korea - Year-over-year growth 2025-2030 (%)
Data Table on South Korea - Year-over-year growth 2025-2030 (%)

13.3.6 Indonesia - Market size and forecast 2025-2030

Chart on Indonesia - Market size and forecast 2025-2030 ($ thousand)
Data Table on Indonesia - Market size and forecast 2025-2030 ($ thousand)
Chart on Indonesia - Year-over-year growth 2025-2030 (%)
Data Table on Indonesia - Year-over-year growth 2025-2030 (%)

13.4 Europe - Market size and forecast 2025-2030

Chart on Europe - Market size and forecast 2025-2030 ($ thousand)
Data Table on Europe - Market size and forecast 2025-2030 ($ thousand)
Chart on Europe - Year-over-year growth 2025-2030 (%)
Data Table on Europe - Year-over-year growth 2025-2030 (%)
Chart on Regional Comparison - Europe
Data Table on Regional Comparison - Europe

13.4.1 Germany - Market size and forecast 2025-2030

Chart on Germany - Market size and forecast 2025-2030 ($ thousand)
Data Table on Germany - Market size and forecast 2025-2030 ($ thousand)
Chart on Germany - Year-over-year growth 2025-2030 (%)
Data Table on Germany - Year-over-year growth 2025-2030 (%)

13.4.2 Italy - Market size and forecast 2025-2030

Chart on Italy - Market size and forecast 2025-2030 ($ thousand)
Data Table on Italy - Market size and forecast 2025-2030 ($ thousand)
Chart on Italy - Year-over-year growth 2025-2030 (%)
Data Table on Italy - Year-over-year growth 2025-2030 (%)

13.4.3 UK - Market size and forecast 2025-2030

Chart on UK - Market size and forecast 2025-2030 ($ thousand)
Data Table on UK - Market size and forecast 2025-2030 ($ thousand)
Chart on UK - Year-over-year growth 2025-2030 (%)
Data Table on UK - Year-over-year growth 2025-2030 (%)

13.4.4 France - Market size and forecast 2025-2030

Chart on France - Market size and forecast 2025-2030 ($ thousand)
Data Table on France - Market size and forecast 2025-2030 ($ thousand)
Chart on France - Year-over-year growth 2025-2030 (%)
Data Table on France - Year-over-year growth 2025-2030 (%)

13.4.5 Spain - Market size and forecast 2025-2030

Chart on Spain - Market size and forecast 2025-2030 ($ thousand)
Data Table on Spain - Market size and forecast 2025-2030 ($ thousand)
Chart on Spain - Year-over-year growth 2025-2030 (%)
Data Table on Spain - Year-over-year growth 2025-2030 (%)

13.4.6 The Netherlands - Market size and forecast 2025-2030

Chart on The Netherlands - Market size and forecast 2025-2030 ($ thousand)
Data Table on The Netherlands - Market size and forecast 2025-2030 ($ thousand)
Chart on The Netherlands - Year-over-year growth 2025-2030 (%)
Data Table on The Netherlands - Year-over-year growth 2025-2030 (%)

13.5 North America - Market size and forecast 2025-2030

Chart on North America - Market size and forecast 2025-2030 ($ thousand)
Data Table on North America - Market size and forecast 2025-2030 ($ thousand)
Chart on North America - Year-over-year growth 2025-2030 (%)
Data Table on North America - Year-over-year growth 2025-2030 (%)
Chart on Regional Comparison - North America
Data Table on Regional Comparison - North America

13.5.1 US - Market size and forecast 2025-2030

Chart on US - Market size and forecast 2025-2030 ($ thousand)
Data Table on US - Market size and forecast 2025-2030 ($ thousand)
Chart on US - Year-over-year growth 2025-2030 (%)
Data Table on US - Year-over-year growth 2025-2030 (%)

13.5.2 Canada - Market size and forecast 2025-2030

Chart on Canada - Market size and forecast 2025-2030 ($ thousand)
Data Table on Canada - Market size and forecast 2025-2030 ($ thousand)
Chart on Canada - Year-over-year growth 2025-2030 (%)
Data Table on Canada - Year-over-year growth 2025-2030 (%)

13.5.3 Mexico - Market size and forecast 2025-2030

Chart on Mexico - Market size and forecast 2025-2030 ($ thousand)
Data Table on Mexico - Market size and forecast 2025-2030 ($ thousand)
Chart on Mexico - Year-over-year growth 2025-2030 (%)
Data Table on Mexico - Year-over-year growth 2025-2030 (%)

13.6 Middle East and Africa - Market size and forecast 2025-2030

Chart on Middle East and Africa - Market size and forecast 2025-2030 ($ thousand)
Data Table on Middle East and Africa - Market size and forecast 2025-2030 ($ thousand)
Chart on Middle East and Africa - Year-over-year growth 2025-2030 (%)
Data Table on Middle East and Africa - Year-over-year growth 2025-2030 (%)
Chart on Regional Comparison - Middle East and Africa
Data Table on Regional Comparison - Middle East and Africa

13.6.1 Turkey - Market size and forecast 2025-2030

Chart on Turkey - Market size and forecast 2025-2030 ($ thousand)
Data Table on Turkey - Market size and forecast 2025-2030 ($ thousand)
Chart on Turkey - Year-over-year growth 2025-2030 (%)
Data Table on Turkey - Year-over-year growth 2025-2030 (%)

13.6.2 Saudi Arabia - Market size and forecast 2025-2030

Chart on Saudi Arabia - Market size and forecast 2025-2030 ($ thousand)
Data Table on Saudi Arabia - Market size and forecast 2025-2030 ($ thousand)
Chart on Saudi Arabia - Year-over-year growth 2025-2030 (%)
Data Table on Saudi Arabia - Year-over-year growth 2025-2030 (%)

13.6.3 Egypt - Market size and forecast 2025-2030

Chart on Egypt - Market size and forecast 2025-2030 ($ thousand)
Data Table on Egypt - Market size and forecast 2025-2030 ($ thousand)
Chart on Egypt - Year-over-year growth 2025-2030 (%)
Data Table on Egypt - Year-over-year growth 2025-2030 (%)

13.6.4 UAE - Market size and forecast 2025-2030

Chart on UAE - Market size and forecast 2025-2030 ($ thousand)
Data Table on UAE - Market size and forecast 2025-2030 ($ thousand)
Chart on UAE - Year-over-year growth 2025-2030 (%)
Data Table on UAE - Year-over-year growth 2025-2030 (%)

13.6.5 South Africa - Market size and forecast 2025-2030

Chart on South Africa - Market size and forecast 2025-2030 ($ thousand)
Data Table on South Africa - Market size and forecast 2025-2030 ($ thousand)
Chart on South Africa - Year-over-year growth 2025-2030 (%)
Data Table on South Africa - Year-over-year growth 2025-2030 (%)

13.7 South America - Market size and forecast 2025-2030

Chart on South America - Market size and forecast 2025-2030 ($ thousand)
Data Table on South America - Market size and forecast 2025-2030 ($ thousand)
Chart on South America - Year-over-year growth 2025-2030 (%)
Data Table on South America - Year-over-year growth 2025-2030 (%)
Chart on Regional Comparison - South America
Data Table on Regional Comparison - South America

13.7.1 Brazil - Market size and forecast 2025-2030

Chart on Brazil - Market size and forecast 2025-2030 ($ thousand)
Data Table on Brazil - Market size and forecast 2025-2030 ($ thousand)
Chart on Brazil - Year-over-year growth 2025-2030 (%)
Data Table on Brazil - Year-over-year growth 2025-2030 (%)

13.7.2 Argentina - Market size and forecast 2025-2030

Chart on Argentina - Market size and forecast 2025-2030 ($ thousand)
Data Table on Argentina - Market size and forecast 2025-2030 ($ thousand)
Chart on Argentina - Year-over-year growth 2025-2030 (%)
Data Table on Argentina - Year-over-year growth 2025-2030 (%)

13.7.3 Chile - Market size and forecast 2025-2030

Chart on Chile - Market size and forecast 2025-2030 ($ thousand)
Data Table on Chile - Market size and forecast 2025-2030 ($ thousand)
Chart on Chile - Year-over-year growth 2025-2030 (%)
Data Table on Chile - Year-over-year growth 2025-2030 (%)

13.8 Market opportunity by geography

Market opportunity by geography ($ thousand)
Data Tables on Market opportunity by geography ($ thousand)

14. Drivers, Challenges, and Opportunity

14.1 Market drivers

Growing branded uniform and promotional apparel programs
Expanding government capital subsidies for textile machinery upgradation
Advancing automated color and bobbin changing in embroidery heads

14.2 Market challenges

Import tariffs raising acquisition costs of embroidery machines
Diversion of decorator equipment budgets toward direct-to-film printing
Margin pressure from low-cost Chinese embroidery machine manufacturers

14.3 Impact of drivers and challenges

Impact of drivers and challenges in 2025 and 2030

14.4 Market opportunities

Growing use of AI-assisted digitizing software among decorators
Accelerating adoption of cloud-connected production monitoring for embroidery fleets
Expanding embroidery machinery into composite preform and smart textile production

15. Competitive Landscape

15.1 Overview

15.2

Overview on criticality of inputs and factors of differentiation

15.3 Landscape disruption

Overview on factors of disruption

15.4 Industry risks

Impact of key risks on business

16. Competitive Analysis

16.1 Companies profiled

Companies covered

16.2 Company ranking index

16.3 Market positioning of companies

Matrix on companies position and classification

16.4 Baby Lock

Baby Lock - Overview
Baby Lock - Product / Service
Baby Lock - Key offerings
SWOT

16.5 Baima Embroidery Machinery

Baima Embroidery Machinery - Overview
Baima Embroidery Machinery - Product / Service
Baima Embroidery Machinery - Key offerings
SWOT

16.6 Barudan America Inc.

Barudan America Inc. - Overview
Barudan America Inc. - Product / Service
Barudan America Inc. - Key offerings
SWOT

16.7 Beijing Richpeace Science

Beijing Richpeace Science - Overview
Beijing Richpeace Science - Product / Service
Beijing Richpeace Science - Key offerings
SWOT

16.8 BERNINA International AG

BERNINA International AG - Overview
BERNINA International AG - Product / Service
BERNINA International AG - Key offerings
SWOT

16.9 Brother Industries Ltd.

Brother Industries Ltd. - Overview
Brother Industries Ltd. - Business segments
Brother Industries Ltd. - Key offerings
Brother Industries Ltd. - Segment focus
SWOT

16.10 Butterfly Embroidery Machines

Butterfly Embroidery Machines - Overview
Butterfly Embroidery Machines - Product / Service
Butterfly Embroidery Machines - Key offerings
SWOT

16.11 ColDesi Inc.

ColDesi Inc. - Overview
ColDesi Inc. - Product / Service
ColDesi Inc. - Key offerings
SWOT

16.12 Elna International Corp. SA

Elna International Corp. SA - Overview
Elna International Corp. SA - Product / Service
Elna International Corp. SA - Key offerings
SWOT

16.13 Feiya Group Co.

Feiya Group Co. - Overview
Feiya Group Co. - Product / Service
Feiya Group Co. - Key offerings
SWOT

16.14 Janome Corp.

Janome Corp. - Overview
Janome Corp. - Business segments
Janome Corp. - Key offerings
Janome Corp. - Segment focus
SWOT

16.15 JUKI Corp.

JUKI Corp. - Overview
JUKI Corp. - Product / Service
JUKI Corp. - Key offerings
SWOT

16.16 PMK Embroidery Machinery

PMK Embroidery Machinery - Overview
PMK Embroidery Machinery - Product / Service
PMK Embroidery Machinery - Key offerings
SWOT

16.17 Singer

Singer - Overview
Singer - Product / Service
Singer - Key offerings
SWOT

16.18 Zoje Sewing Machine Co. Ltd.

Zoje Sewing Machine Co. Ltd. - Overview
Zoje Sewing Machine Co. Ltd. - Product / Service
Zoje Sewing Machine Co. Ltd. - Key offerings
SWOT

17. Appendix

17.1 Scope of the report

Market definition
Objectives
Notes and caveats

17.2 Inclusions and exclusions checklist

Inclusions checklist
Exclusions checklist

17.3 Currency conversion rates for US$

17.4 Research methodology

17.5 Data procurement

Information sources

17.6 Data validation

17.7 Validation techniques employed for market sizing

17.8 Data synthesis

17.9 360 degree market analysis

17.10 List of abbreviations

Research Methodology

Technavio presents a detailed picture of the market by way of study, synthesis, and summation of data from multiple sources. The analysts have presented the various facets of the market with a particular focus on identifying the key industry influencers. The data thus presented is comprehensive, reliable, and the result of extensive research, both primary and secondary.

INFORMATION SOURCES

Primary sources

  • Manufacturers and suppliers
  • Channel partners
  • Industry experts
  • Strategic decision makers

Secondary sources

  • Industry journals and periodicals
  • Government data
  • Financial reports of key industry players
  • Historical data
  • Press releases

DATA ANALYSIS

Data Synthesis

  • Collation of data
  • Estimation of key figures
  • Analysis of derived insights

Data Validation

  • Triangulation with data models
  • Reference against proprietary databases
  • Corroboration with industry experts

REPORT WRITING

Qualitative

  • Market drivers
  • Market challenges
  • Market trends
  • Five forces analysis

Quantitative

  • Market size and forecast
  • Market segmentation
  • Geographical insights
  • Competitive landscape

Interested in this report?

Get your sample now to see our research methodology and insights!

Download Now

Frequently Asked Questions

Embroidery Equipment market growth will increase by USD 174998.8 thousand thousand during 2026-2030.

The Embroidery Equipment market is expected to grow at a CAGR of 5.6% during 2026-2030.

Embroidery Equipment market is segmented by Product type (Multi-needle, Single-needle) End-user (Commercial, Household) Type (Surface embroidery equipment, Counted thread embroidery, Needlepoint equipment, Others) Application (Apparel, Home textiles, Accessories, Others)

Baby Lock, Baima Embroidery Machinery, Barudan America Inc., Beijing Richpeace Science, BERNINA International AG, Brother Industries Ltd., Butterfly Embroidery Machines, ColDesi Inc., Elna International Corp. SA, Feiya Group Co., Janome Corp., JUKI Corp., Lejia Embroidery Machinery, Melco International LLC, PMK Embroidery Machinery, Ricoma International Corp., Singer, Tajima Industries Ltd., Yonthin, Zoje Sewing Machine Co. Ltd. are a few of the key vendors in the Embroidery Equipment market.

APAC will register the highest growth rate of 67.9% among the other regions. Therefore, the Embroidery Equipment market in APAC is expected to garner significant business opportunities for the vendors during the forecast period.

China, India, Japan, Vietnam, South Korea, Indonesia, Germany, Italy, UK, France, Spain, The Netherlands, US, Canada, Mexico, Turkey, Saudi Arabia, Egypt, UAE, South Africa, Brazil, Argentina, Chile

  • Growing branded uniform and promotional apparel programs is the driving factor this market.

The Embroidery Equipment market vendors should focus on grabbing business opportunities from the Product type segment as it accounted for the largest market share in the base year.
RIA - Research AI Assistant
Ask RIA