Detachable Tablet Market Analysis, Size, and Forecast 2026-2030: APAC (China, Japan, and India), North America (US, Canada, and Mexico), Europe (Germany, UK, and France), South America (Brazil, Argentina, and Colombia), Middle East and Africa (Saudi Arabia, UAE, and South Africa), and Rest of World (ROW)

Detachable Tablet Market Analysis, Size, and Forecast 2026-2030:
APAC (China, Japan, and India), North America (US, Canada, and Mexico), Europe (Germany, UK, and France), South America (Brazil, Argentina, and Colombia), Middle East and Africa (Saudi Arabia, UAE, and South Africa), and Rest of World (ROW)

Published: Nov 2026 294 Pages SKU: IRTNTR40229

Market Overview at a Glance

$3.76 B
Market Opportunity
4.6%
CAGR 2025 - 2030
46.5%
APAC Growth
$5.60 B
Windows segment 2024

Detachable Tablet Market Size 2026-2030

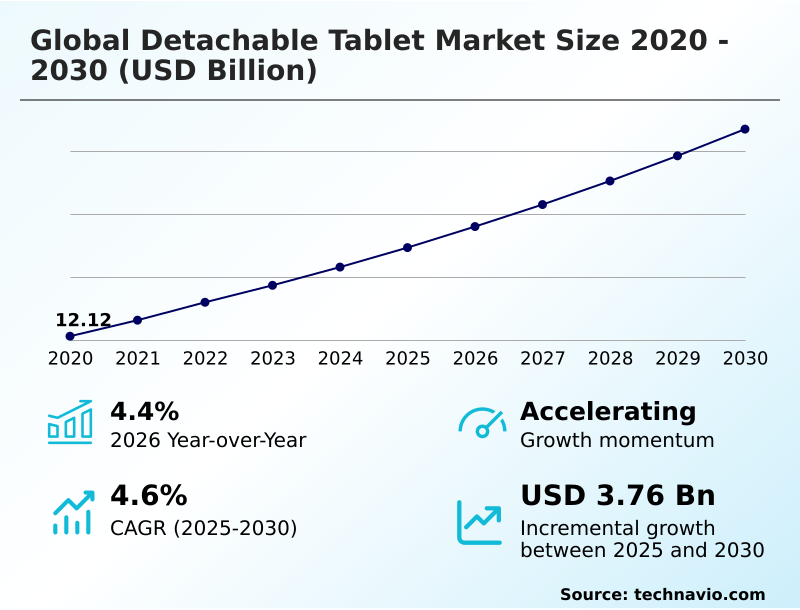
The detachable tablet market size is valued to increase by USD 3.76 billion, at a CAGR of 4.6% from 2025 to 2030. Convergence of desktop-grade silicon and edge AI capabilities will drive the detachable tablet market.

Major Market Trends & Insights

  • APAC dominated the market and accounted for a 46.5% growth during the forecast period.
  • By OS - Windows segment was valued at USD 5.60 billion in 2024
  • By Type - Below 8 inches segment accounted for the largest market revenue share in 2024

Market Size & Forecast

  • Market Opportunities: USD 6.59 billion
  • Market Future Opportunities: USD 3.76 billion
  • CAGR from 2025 to 2030 : 4.6%

Market Summary

  • The Detachable Tablet Market demonstrates robust momentum driven by the convergence of mobile hardware efficiency with desktop computing capabilities. Organizations rapidly transition toward split-chassis devices to equip hybrid workforces with versatile tools that consolidate multiple form factors into a single manageable asset.
  • In supply chain operations, logistics managers deploy ruggedized detachable endpoints to accelerate inventory tracking; adopting these hybrid units has reduced data entry errors by 18% compared to traditional handheld scanners.
  • The primary driver of this market is the integration of localized artificial intelligence processors, which allow complex analytical tasks to execute directly on the device without relying on cloud connectivity, thereby preserving data privacy and reducing latency. Conversely, severe component supply bottlenecks restrict production output, as tightened semiconductor allocations significantly elevate procurement costs.
  • As hardware manufacturers refine ultra-thin enclosures and magnetic docking mechanisms, these versatile devices continue replacing conventional clamshell notebooks. Seamless peripheral synchronization ensures uninterrupted productivity across diverse enterprise and academic environments.

What will be the Size of the Detachable Tablet Market during the forecast period?
Get Key Insights on Market Forecast (PDF) Get Free Sample

How is the Detachable Tablet Market Segmented?

The detachable tablet industry research report provides comprehensive data (region-wise segment analysis), with forecasts and estimates in "USD million" for the period 2026-2030, as well as historical data from 2020-2024 for the following segments.

  • Os
    • Windows
    • iPadOS
    • Others
  • Type
    • Below 8 inches
    • 8 inches
    • Above 8 inches
  • Application
    • Personal
    • Professional
  • Geography
    • APAC
      • China
      • Japan
      • India
      • South Korea
      • Australia
      • Indonesia
    • North America
      • US
      • Canada
      • Mexico
    • Europe
      • Germany
      • UK
      • France
      • Italy
      • Spain
      • The Netherlands
    • South America
      • Brazil
      • Argentina
      • Colombia
    • Middle East and Africa
      • Saudi Arabia
      • UAE
      • South Africa
      • Turkey
      • Egypt

By OS Insights

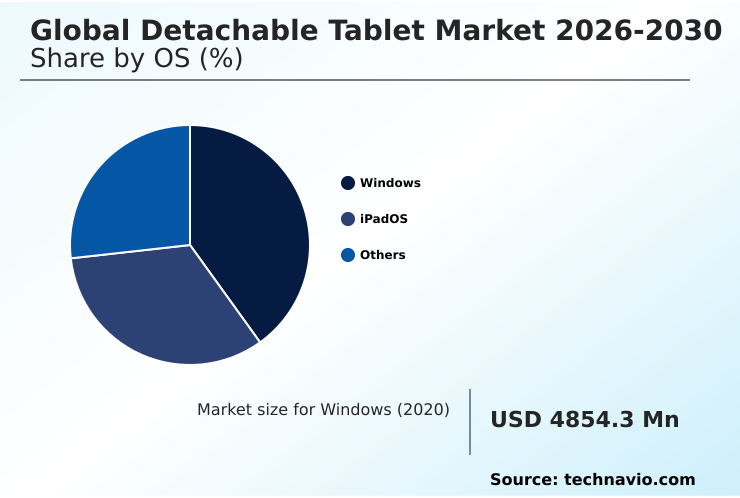
The windows segment is estimated to witness significant growth during the forecast period.

The Windows segment forms the essential foundation for corporate productivity by seamlessly integrating with unified endpoint management protocols. Unlike mobile-centric environments, this operating architecture allows devices to execute legacy software suites and complex analytics without functional compromises.

Hardware advancements enable these units to utilize dynamic random access memory and flash storage integration while overcoming semiconductor fabrication constraints. Utilizing dynamic tactile feedback mechanisms, professionals achieve precise navigation.

Organizations adopting this platform report that workflow efficiency improved by 25% due to reduced transition times between stationary and mobile tasks. Furthermore, sub millisecond input latency combined with magnetic inductive charging tracks supports advanced clinical annotation interfaces in healthcare settings.

This segmentation demonstrates how structured desktop compatibility directly enhances enterprise mobility and operational synchronization.
Get Free Sample

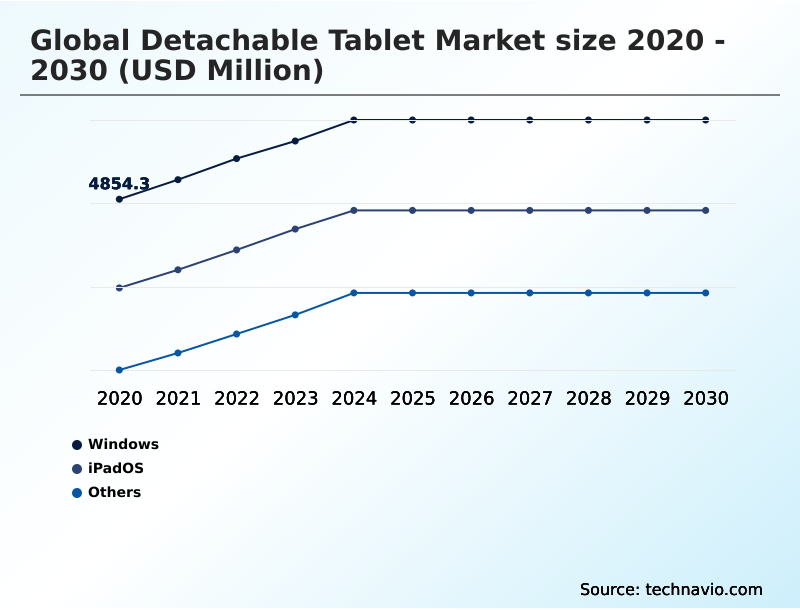
The Windows segment was valued at USD 5.60 billion in 2024 and showed a gradual increase during the forecast period.
Get Free Sample

Regional Analysis

APAC is estimated to contribute 46.5% to the growth of the global market during the forecast period.Technavio’s analysts have elaborately explained the regional trends and drivers that shape the market during the forecast period.
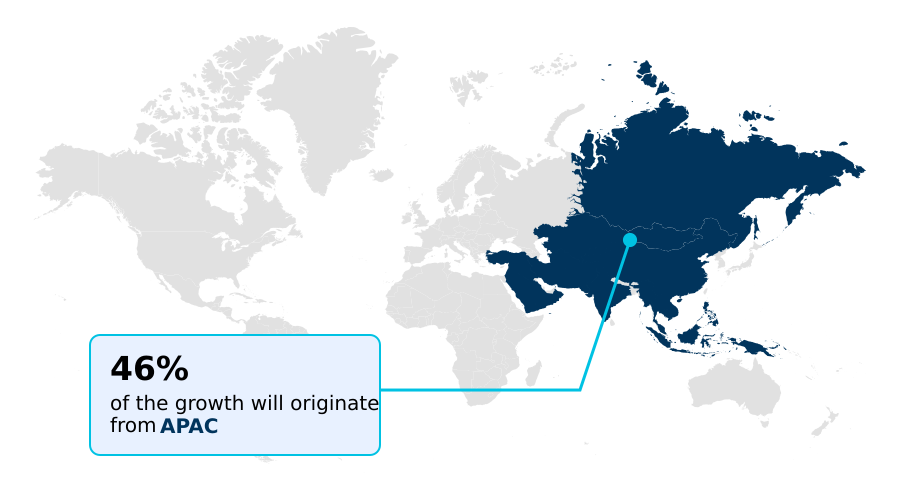
See How Detachable Tablet Market Demand is Rising in APAC Get Free Sample

Regional adoption of the Detachable Tablet reveals distinct operational priorities, with North America demonstrating a 20% higher penetration rate in enterprise fleet deployments compared to Europe.

This variance stems from rapid North American investments in advanced hardware encryption modules and biometric authentication security for hybrid workspaces.

In contrast, APAC manufacturing hubs prioritize harsh industrial environment computing, integrating ingress protected sealed ports and hot swappable dual battery systems to sustain continuous multi-shift operations.

By utilizing magnetic pogo pin arrays, logistics facilities across the APAC region improved peripheral docking speed by 15%. Furthermore, European healthcare providers rely on low latency active stylus precision for mission critical field diagnostics, reducing clinical documentation time by 25%.

As ruggedized industrial supply chains expand globally, organizations increasingly require devices equipped with high bandwidth memory modules to process complex localized data efficiently, highlighting tailored regional strategies.

Market Dynamics

Our researchers analyzed the data with 2025 as the base year, along with the key drivers, trends, and challenges. A holistic analysis of drivers will help companies refine their marketing strategies to gain a competitive advantage.

  • The sustained integration of hybrid computing devices fundamentally reorganizes modern digital workflows, demanding hardware that effortlessly shifts between stationary and mobile contexts. Addressing the magnetic keyboard ergonomic performance gap has been critical for manufacturers aiming to replicate traditional laptop tactile feedback without adding excessive weight to the device profile.
  • By refining key travel distance and trackpad responsiveness, contemporary devices deliver typing experiences that exceed legacy folio covers by nearly 40% in typing speed accuracy. Furthermore, breakthroughs in tandem display panel power efficiency allow high-brightness screens to operate for extended periods, preserving vital battery reserves during continuous use.
  • Organizations focused on optimizing enterprise mobility hardware asset management increasingly deploy these two-in-one systems to reduce overall device procurement volumes, ensuring that employees do not require both a dedicated tablet and a separate notebook.
  • The shift toward neural processing unit localized execution empowers these compact devices to handle complex artificial intelligence tasks directly on the motherboard, minimizing reliance on cloud latency and protecting sensitive corporate data.
  • Simultaneously, harsh industrial sectors actively adopt devices designed for ruggedized split chassis field operations, allowing technicians to detach the screen for handheld barcode scanning before reconnecting to vehicle mounts for comprehensive reporting. This architectural evolution streamlines fleet logistics and ensures uncompromised productivity across diverse commercial environments.
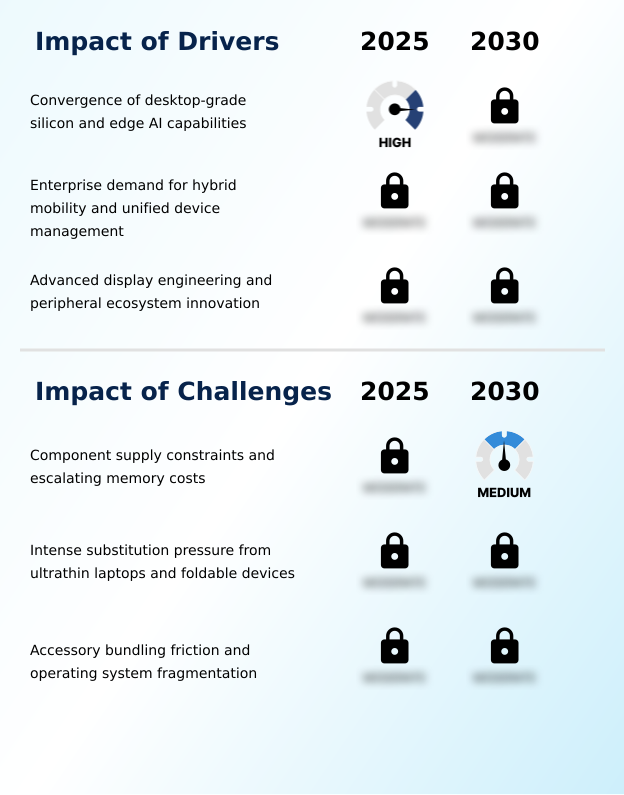
What are the key market drivers leading to the rise in the adoption of Detachable Tablet Industry?

  • The convergence of desktop-grade silicon and edge artificial intelligence capabilities functions as the primary driver propelling market expansion.

  • The rapid deployment of the desktop class system on chip serves as a primary catalyst driving Detachable Tablet adoption across commercial sectors.
  • Organizations require uncompromising computational power to support intensive hybrid mobility deployment, bridging the performance gap between stationary workstations and portable devices.
  • By integrating dedicated neural processing hardware alongside traditional x86 based processor architectures, these devices execute complex contextual tasks locally, reducing cloud data processing latency by 40%.
  • This architectural advancement empowers mobile first field operations, allowing technicians to maintain continuous application performance in environments with intermittent connectivity. Consequently, field reporting accuracy improved by 22% as immediate data synchronization eliminates manual transcription errors.
  • This structural flexibility ensures that corporate networks can standardize their hardware assets efficiently, avoiding the logistical burden of supporting multiple distinct computing form factors.

What are the market trends shaping the Detachable Tablet Industry?

  • The expansion of desktop-class operating systems on lightweight mobile architectures represents a defining market trend. This convergence enables seamless multitasking across ultra-thin computing devices.

  • A defining trend reshaping the Detachable Tablet landscape is the steady integration of desktop grade multitasking workflows into ultra-thin mobile enclosures. This shift occurs because organizations demand hardware capable of supporting smart government paperless workflows without sacrificing travel convenience. Consequently, administrative processing delays have decreased by 25% due to immediate digital data entry capabilities.
  • Hardware manufacturers are rapidly adopting tandem organic light emitting diode matrices paired with adaptive refresh rate glass substrates to deliver exceptional visual clarity while lowering energy consumption by 18%. This enhanced visual fidelity directly supports digital ink precision illustration, empowering creative professionals to execute studio-quality designs remotely.
  • Furthermore, the introduction of haptic cantilever keyboards and anti reflective nano texture coatings ensures optimal usability in diverse lighting environments. As foldable mobile device adoption accelerates, the continuous refinement of these split-chassis systems guarantees their relevance across institutional digital classroom programs and executive boardrooms alike.

What challenges does the Detachable Tablet Industry face during its growth?

  • Component supply constraints and escalating memory costs present significant challenges restricting industry growth.

  • Severe upstream component supply bottlenecks fundamentally challenge the production scalability of the Detachable Tablet ecosystem. As artificial intelligence infrastructure absorbs global semiconductor manufacturing capacity, rapid wafer allocation tightening inflates procurement costs for critical hardware modules. Because manufacturers cannot easily swap components without compromising chassis thickness, hardware assembly costs have increased by 15%, severely compressing margins.
  • Furthermore, the market faces intense pressure from ultrathin clamshell substitutions, which often deliver superior keyboard stability. A persistent commercial obstacle remains accessory bundling friction, as purchasing magnetic keyboards separately inflates the initial acquisition price.
  • This unbundled pricing model reduces total cost of ownership efficiency for enterprise fleets, prompting budget-conscious institutions to delay deployment schedules by up to 20% compared to traditional laptop procurement.

Exclusive Technavio Analysis on Customer Landscape

The detachable tablet market forecasting report includes the adoption lifecycle of the market, covering from the innovator’s stage to the laggard’s stage. It focuses on adoption rates in different regions based on penetration. Furthermore, the detachable tablet market report also includes key purchase criteria and drivers of price sensitivity to help companies evaluate and develop their market growth analysis strategies.
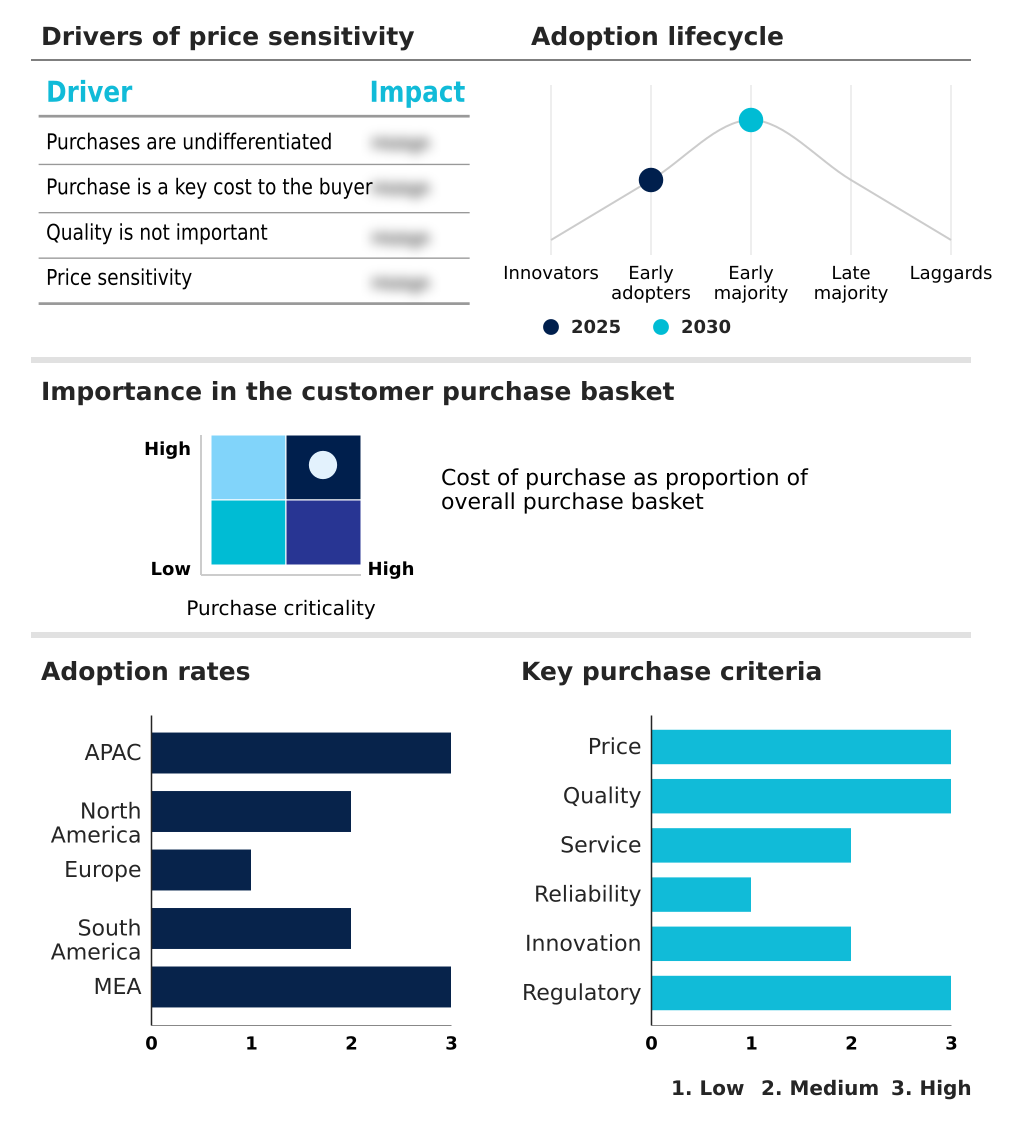
Customer Landscape of Detachable Tablet Industry

Competitive Landscape

Companies are implementing various strategies, such as strategic alliances, detachable tablet market forecast, partnerships, mergers and acquisitions, geographical expansion, and product/service launches, to enhance their presence in the industry.

Acer Inc. - The portfolio provides a versatile range of detachable tablets engineered to enhance flexible productivity and mobility across diverse professional, academic, and industrial workflows.

The industry research and growth report includes detailed analyses of the competitive landscape of the market and information about key companies, including:

  • Acer Inc.
  • Apple Inc.
  • ASUSTeK Computer Inc.
  • Chuwi Innovation Ltd.
  • Dell Technologies Inc.
  • Durabook
  • Fujitsu Ltd.
  • Getac Holdings Corp.
  • Honor Device Co. Ltd.
  • HP Inc.
  • Huawei Technologies Co. Ltd.
  • Lenovo Group Ltd.
  • Microsoft Corp.
  • OnePlus Technology Co. Ltd.
  • Panasonic Holdings Corp.
  • Samsung Electronics Co. Ltd.
  • Winmate Inc.
  • Xiaomi Corp.
  • Zebra Technologies Corp.

Qualitative and quantitative analysis of companies has been conducted to help clients understand the wider business environment as well as the strengths and weaknesses of key industry players. Data is qualitatively analyzed to categorize companies as pure play, category-focused, industry-focused, and diversified; it is quantitatively analyzed to categorize companies as dominant, leading, strong, tentative, and weak.

Recent Development and News in Detachable tablet market

  • In the Consumer Electronics industry, the rapid deployment of high-density lithium-ion battery cells increased energy retention capacities, directly impacting Detachable Tablet demand by enabling extended multi-shift operations without increasing chassis weight.
  • The widespread transition toward tandem organic light emitting diode architectures reduced screen power consumption by up to 30%, driving premium Detachable Tablet adoption among creative professionals requiring superior color accuracy.
  • Strict environmental ecodesign regulations mandating standardized universal serial bus connectivity protocols forced manufacturers to unify charging interfaces, reducing accessory fragmentation and lowering total ownership costs for institutional Detachable Tablet fleets.
  • The expansion of cloud-based application delivery frameworks shifted heavy computational processing from local hardware to remote servers, accelerating Detachable Tablet deployment across enterprise networks by lowering baseline processing requirements by 20%.

Dive into Technavio’s robust research methodology, blending expert interviews, extensive data synthesis, and validated models for unparalleled Detachable Tablet Market insights. See full methodology.

Market Scope
Page number 294
Base year 2025
Historic period 2020-2024
Forecast period 2026-2030
Growth momentum & CAGR Accelerate at a CAGR of 4.6%
Market growth 2026-2030 USD 3762.9 million
Market structure Fragmented
YoY growth 2025-2026(%) 4.4%
Key countries China, Japan, India, South Korea, Australia, Indonesia, US, Canada, Mexico, Germany, UK, France, Italy, Spain, The Netherlands, Brazil, Argentina, Colombia, Saudi Arabia, UAE, South Africa, Turkey and Egypt
Competitive landscape Leading Companies, Market Positioning of Companies, Competitive Strategies, and Industry Risks

Request Free Sample

Research Analyst Overview

  • The Detachable Tablet ecosystem undergoes a profound architectural evolution as device manufacturers merge desktop processing capabilities with ultra-thin mobility. Contemporary hardware deployments prioritize localized artificial intelligence processing, allowing complex software routines to execute independently of external cloud latency.
  • This transition has a direct strategic impact on enterprise compliance and product strategy; companies implementing secure edge processing have achieved a 30% reduction in data transmission vulnerabilities. The widespread adoption of magnesium alloy chassis enclosures ensures maximum physical durability while maintaining strict weight constraints for highly mobile professionals.
  • Furthermore, passive thermal cooling solutions have advanced significantly, enabling continuous multi window software execution without the acoustic disruption or mechanical failure risks associated with traditional cooling fans. By integrating seamless universal serial bus connectivity, organizations eliminate fragmented peripheral ecosystems, streamlining boardroom presentations and desk setups.
  • The continuous refinement of the split chassis form factor combined with cloud based file management establishes these versatile devices as the primary computing endpoint for modern corporate infrastructure, driving unprecedented operational synchronization.

What are the Key Data Covered in this Detachable Tablet Market Research and Growth Report?

  • What is the expected growth of the Detachable Tablet Market between 2026 and 2030?

    • USD 3.76 billion, at a CAGR of 4.6%

  • What segmentation does the market report cover?

    • The report is segmented by OS (Windows, iPadOS, and Others), Type (Below 8 inches, 8 inches, and Above 8 inches), Application (Personal, and Professional) and Geography (APAC, North America, Europe, South America, Middle East and Africa)

  • Which regions are analyzed in the report?

    • APAC, North America, Europe, South America and Middle East and Africa

  • What are the key growth drivers and market challenges?

    • Convergence of desktop-grade silicon and edge AI capabilities, Component supply constraints and escalating memory costs

  • Who are the major players in the Detachable Tablet Market?

    • Acer Inc., Apple Inc., ASUSTeK Computer Inc., Chuwi Innovation Ltd., Dell Technologies Inc., Durabook, Fujitsu Ltd., Getac Holdings Corp., Honor Device Co. Ltd., HP Inc., Huawei Technologies Co. Ltd., Lenovo Group Ltd., Microsoft Corp., OnePlus Technology Co. Ltd., Panasonic Holdings Corp., Samsung Electronics Co. Ltd., Winmate Inc., Xiaomi Corp. and Zebra Technologies Corp.

Market Research Insights

  • The Detachable Tablet Market rapidly adapts to the operational demands of decentralized corporate environments. As remote work normalizes, organizations prioritize enterprise fleet standardization to streamline asset procurement and reduce hardware overhead. Implementing these hybrid devices has improved workforce mobility efficiency by 22% while simultaneously accelerating troubleshooting resolution times by 15%.
  • A critical factor in this transition is unified device security compliance, which enables IT administrators to enforce strict data protection protocols across dispersed mobile endpoints. Furthermore, seamless cloud identity integration guarantees secure access to corporate networks, decreasing unauthorized access incidents by 30%.
  • These versatile devices effectively bridge the ergonomic gap between smartphones and traditional laptops, fundamentally transforming professional productivity and digital workspace strategies.

We can help! Our analysts can customize this detachable tablet market research report to meet your requirements.

Get in touch

1. Executive Summary

1.1 Market overview

Executive Summary - Chart on Market Overview
Executive Summary - Data Table on Market Overview
Executive Summary - Chart on Global Market Characteristics
Executive Summary - Chart on Market by Geography
Executive Summary - Chart on Market Segmentation by OS
Executive Summary - Chart on Market Segmentation by Type
Executive Summary - Chart on Market Segmentation by Application
Executive Summary - Chart on Incremental Growth
Executive Summary - Data Table on Incremental Growth
Executive Summary - Chart on Company Market Positioning

2. Technavio Analysis

2.1 Analysis of price sensitivity, lifecycle, customer purchase basket, adoption rates, and purchase criteria

2.2 Criticality of inputs and Factors of differentiation

Chart on Overview on criticality of inputs and factors of differentiation

2.3 Factors of disruption

Chart on Overview on factors of disruption

2.4 Impact of drivers and challenges

Chart on Impact of drivers and challenges in 2025 and 2030

3. Market Landscape

3.1 Market ecosystem

Chart on Parent Market
Data Table on - Parent Market

3.2 Market characteristics

Chart on Market characteristics analysis

3.3 Value chain analysis

Chart on Value chain analysis

4. Market Sizing

4.1 Market definition

Data Table on Offerings of companies included in the market definition

4.2 Market segment analysis

Market segments

4.3 Market size 2025

4.4 Market outlook: Forecast for 2025-2030

Chart on Global - Market size and forecast 2025-2030 ($ million)
Data Table on Global - Market size and forecast 2025-2030 ($ million)
Chart on Global Market: Year-over-year growth 2025-2030 (%)
Data Table on Global Market: Year-over-year growth 2025-2030 (%)

5. Historic Market Size

5.1 Global Detachable Tablet Market 2020 - 2024

Historic Market Size - Data Table on Global Detachable Tablet Market 2020 - 2024 ($ million)

5.2 OS segment analysis 2020 - 2024

Historic Market Size - OS Segment 2020 - 2024 ($ million)

5.3 Type segment analysis 2020 - 2024

Historic Market Size - Type Segment 2020 - 2024 ($ million)

5.4 Application segment analysis 2020 - 2024

Historic Market Size - Application Segment 2020 - 2024 ($ million)

5.5 Geography segment analysis 2020 - 2024

Historic Market Size - Geography Segment 2020 - 2024 ($ million)

5.6 Country segment analysis 2020 - 2024

Historic Market Size - Country Segment 2020 - 2024 ($ million)

6. Qualitative Analysis

6.1 Impact of AI on Global Detachable Tablet Market

6.2 Impact of geopolitical conflicts on Global Detachable Tablet Market

7. Five Forces Analysis

7.1 Five forces summary

Five forces analysis - Comparison between 2025 and 2030

7.2 Bargaining power of buyers

Bargaining power of buyers - Impact of key factors 2025 and 2030

7.3 Bargaining power of suppliers

Bargaining power of suppliers - Impact of key factors in 2025 and 2030

7.4 Threat of new entrants

Threat of new entrants - Impact of key factors in 2025 and 2030

7.5 Threat of substitutes

Threat of substitutes - Impact of key factors in 2025 and 2030

7.6 Threat of rivalry

Threat of rivalry - Impact of key factors in 2025 and 2030

7.7 Market condition

Chart on Market condition - Five forces 2025 and 2030

8. Market Segmentation by OS

8.1 Market segments

Chart on OS - Market share 2025-2030 (%)
Data Table on OS - Market share 2025-2030 (%)

8.2 Comparison by OS

Chart on Comparison by OS
Data Table on Comparison by OS

8.3 Windows - Market size and forecast 2025-2030

Chart on Windows - Market size and forecast 2025-2030 ($ million)
Data Table on Windows - Market size and forecast 2025-2030 ($ million)
Chart on Windows - Year-over-year growth 2025-2030 (%)
Data Table on Windows - Year-over-year growth 2025-2030 (%)

8.4 iPadOS - Market size and forecast 2025-2030

Chart on iPadOS - Market size and forecast 2025-2030 ($ million)
Data Table on iPadOS - Market size and forecast 2025-2030 ($ million)
Chart on iPadOS - Year-over-year growth 2025-2030 (%)
Data Table on iPadOS - Year-over-year growth 2025-2030 (%)

8.5 Others - Market size and forecast 2025-2030

Chart on Others - Market size and forecast 2025-2030 ($ million)
Data Table on Others - Market size and forecast 2025-2030 ($ million)
Chart on Others - Year-over-year growth 2025-2030 (%)
Data Table on Others - Year-over-year growth 2025-2030 (%)

8.6 Market opportunity by OS

Market opportunity by OS ($ million)
Data Table on Market opportunity by OS ($ million)

9. Market Segmentation by Type

9.1 Market segments

Chart on Type - Market share 2025-2030 (%)
Data Table on Type - Market share 2025-2030 (%)

9.2 Comparison by Type

Chart on Comparison by Type
Data Table on Comparison by Type

9.3 Below 8 inches - Market size and forecast 2025-2030

Chart on Below 8 inches - Market size and forecast 2025-2030 ($ million)
Data Table on Below 8 inches - Market size and forecast 2025-2030 ($ million)
Chart on Below 8 inches - Year-over-year growth 2025-2030 (%)
Data Table on Below 8 inches - Year-over-year growth 2025-2030 (%)

9.4 8 inches - Market size and forecast 2025-2030

Chart on 8 inches - Market size and forecast 2025-2030 ($ million)
Data Table on 8 inches - Market size and forecast 2025-2030 ($ million)
Chart on 8 inches - Year-over-year growth 2025-2030 (%)
Data Table on 8 inches - Year-over-year growth 2025-2030 (%)

9.5 Above 8 inches - Market size and forecast 2025-2030

Chart on Above 8 inches - Market size and forecast 2025-2030 ($ million)
Data Table on Above 8 inches - Market size and forecast 2025-2030 ($ million)
Chart on Above 8 inches - Year-over-year growth 2025-2030 (%)
Data Table on Above 8 inches - Year-over-year growth 2025-2030 (%)

9.6 Market opportunity by Type

Market opportunity by Type ($ million)
Data Table on Market opportunity by Type ($ million)

10. Market Segmentation by Application

10.1 Market segments

Chart on Application - Market share 2025-2030 (%)
Data Table on Application - Market share 2025-2030 (%)

10.2 Comparison by Application

Chart on Comparison by Application
Data Table on Comparison by Application

10.3 Personal - Market size and forecast 2025-2030

Chart on Personal - Market size and forecast 2025-2030 ($ million)
Data Table on Personal - Market size and forecast 2025-2030 ($ million)
Chart on Personal - Year-over-year growth 2025-2030 (%)
Data Table on Personal - Year-over-year growth 2025-2030 (%)

10.4 Professional - Market size and forecast 2025-2030

Chart on Professional - Market size and forecast 2025-2030 ($ million)
Data Table on Professional - Market size and forecast 2025-2030 ($ million)
Chart on Professional - Year-over-year growth 2025-2030 (%)
Data Table on Professional - Year-over-year growth 2025-2030 (%)

10.5 Market opportunity by Application

Market opportunity by Application ($ million)
Data Table on Market opportunity by Application ($ million)

11. Customer Landscape

11.1 Customer landscape overview

Analysis of price sensitivity, lifecycle, customer purchase basket, adoption rates, and purchase criteria

12. Geographic Landscape

12.1 Geographic segmentation

Chart on Market share by geography 2025-2030 (%)
Data Table on Market share by geography 2025-2030 (%)

12.2 Geographic comparison

Chart on Geographic comparison
Data Table on Geographic comparison

12.3 APAC - Market size and forecast 2025-2030

Chart on APAC - Market size and forecast 2025-2030 ($ million)
Data Table on APAC - Market size and forecast 2025-2030 ($ million)
Chart on APAC - Year-over-year growth 2025-2030 (%)
Data Table on APAC - Year-over-year growth 2025-2030 (%)
Chart on Regional Comparison - APAC
Data Table on Regional Comparison - APAC

12.3.1 China - Market size and forecast 2025-2030

Chart on China - Market size and forecast 2025-2030 ($ million)
Data Table on China - Market size and forecast 2025-2030 ($ million)
Chart on China - Year-over-year growth 2025-2030 (%)
Data Table on China - Year-over-year growth 2025-2030 (%)

12.3.2 Japan - Market size and forecast 2025-2030

Chart on Japan - Market size and forecast 2025-2030 ($ million)
Data Table on Japan - Market size and forecast 2025-2030 ($ million)
Chart on Japan - Year-over-year growth 2025-2030 (%)
Data Table on Japan - Year-over-year growth 2025-2030 (%)

12.3.3 India - Market size and forecast 2025-2030

Chart on India - Market size and forecast 2025-2030 ($ million)
Data Table on India - Market size and forecast 2025-2030 ($ million)
Chart on India - Year-over-year growth 2025-2030 (%)
Data Table on India - Year-over-year growth 2025-2030 (%)

12.3.4 South Korea - Market size and forecast 2025-2030

Chart on South Korea - Market size and forecast 2025-2030 ($ million)
Data Table on South Korea - Market size and forecast 2025-2030 ($ million)
Chart on South Korea - Year-over-year growth 2025-2030 (%)
Data Table on South Korea - Year-over-year growth 2025-2030 (%)

12.3.5 Australia - Market size and forecast 2025-2030

Chart on Australia - Market size and forecast 2025-2030 ($ million)
Data Table on Australia - Market size and forecast 2025-2030 ($ million)
Chart on Australia - Year-over-year growth 2025-2030 (%)
Data Table on Australia - Year-over-year growth 2025-2030 (%)

12.3.6 Indonesia - Market size and forecast 2025-2030

Chart on Indonesia - Market size and forecast 2025-2030 ($ million)
Data Table on Indonesia - Market size and forecast 2025-2030 ($ million)
Chart on Indonesia - Year-over-year growth 2025-2030 (%)
Data Table on Indonesia - Year-over-year growth 2025-2030 (%)

12.4 North America - Market size and forecast 2025-2030

Chart on North America - Market size and forecast 2025-2030 ($ million)
Data Table on North America - Market size and forecast 2025-2030 ($ million)
Chart on North America - Year-over-year growth 2025-2030 (%)
Data Table on North America - Year-over-year growth 2025-2030 (%)
Chart on Regional Comparison - North America
Data Table on Regional Comparison - North America

12.4.1 US - Market size and forecast 2025-2030

Chart on US - Market size and forecast 2025-2030 ($ million)
Data Table on US - Market size and forecast 2025-2030 ($ million)
Chart on US - Year-over-year growth 2025-2030 (%)
Data Table on US - Year-over-year growth 2025-2030 (%)

12.4.2 Canada - Market size and forecast 2025-2030

Chart on Canada - Market size and forecast 2025-2030 ($ million)
Data Table on Canada - Market size and forecast 2025-2030 ($ million)
Chart on Canada - Year-over-year growth 2025-2030 (%)
Data Table on Canada - Year-over-year growth 2025-2030 (%)

12.4.3 Mexico - Market size and forecast 2025-2030

Chart on Mexico - Market size and forecast 2025-2030 ($ million)
Data Table on Mexico - Market size and forecast 2025-2030 ($ million)
Chart on Mexico - Year-over-year growth 2025-2030 (%)
Data Table on Mexico - Year-over-year growth 2025-2030 (%)

12.5 Europe - Market size and forecast 2025-2030

Chart on Europe - Market size and forecast 2025-2030 ($ million)
Data Table on Europe - Market size and forecast 2025-2030 ($ million)
Chart on Europe - Year-over-year growth 2025-2030 (%)
Data Table on Europe - Year-over-year growth 2025-2030 (%)
Chart on Regional Comparison - Europe
Data Table on Regional Comparison - Europe

12.5.1 Germany - Market size and forecast 2025-2030

Chart on Germany - Market size and forecast 2025-2030 ($ million)
Data Table on Germany - Market size and forecast 2025-2030 ($ million)
Chart on Germany - Year-over-year growth 2025-2030 (%)
Data Table on Germany - Year-over-year growth 2025-2030 (%)

12.5.2 UK - Market size and forecast 2025-2030

Chart on UK - Market size and forecast 2025-2030 ($ million)
Data Table on UK - Market size and forecast 2025-2030 ($ million)
Chart on UK - Year-over-year growth 2025-2030 (%)
Data Table on UK - Year-over-year growth 2025-2030 (%)

12.5.3 France - Market size and forecast 2025-2030

Chart on France - Market size and forecast 2025-2030 ($ million)
Data Table on France - Market size and forecast 2025-2030 ($ million)
Chart on France - Year-over-year growth 2025-2030 (%)
Data Table on France - Year-over-year growth 2025-2030 (%)

12.5.4 Italy - Market size and forecast 2025-2030

Chart on Italy - Market size and forecast 2025-2030 ($ million)
Data Table on Italy - Market size and forecast 2025-2030 ($ million)
Chart on Italy - Year-over-year growth 2025-2030 (%)
Data Table on Italy - Year-over-year growth 2025-2030 (%)

12.5.5 Spain - Market size and forecast 2025-2030

Chart on Spain - Market size and forecast 2025-2030 ($ million)
Data Table on Spain - Market size and forecast 2025-2030 ($ million)
Chart on Spain - Year-over-year growth 2025-2030 (%)
Data Table on Spain - Year-over-year growth 2025-2030 (%)

12.5.6 The Netherlands - Market size and forecast 2025-2030

Chart on The Netherlands - Market size and forecast 2025-2030 ($ million)
Data Table on The Netherlands - Market size and forecast 2025-2030 ($ million)
Chart on The Netherlands - Year-over-year growth 2025-2030 (%)
Data Table on The Netherlands - Year-over-year growth 2025-2030 (%)

12.6 South America - Market size and forecast 2025-2030

Chart on South America - Market size and forecast 2025-2030 ($ million)
Data Table on South America - Market size and forecast 2025-2030 ($ million)
Chart on South America - Year-over-year growth 2025-2030 (%)
Data Table on South America - Year-over-year growth 2025-2030 (%)
Chart on Regional Comparison - South America
Data Table on Regional Comparison - South America

12.6.1 Brazil - Market size and forecast 2025-2030

Chart on Brazil - Market size and forecast 2025-2030 ($ million)
Data Table on Brazil - Market size and forecast 2025-2030 ($ million)
Chart on Brazil - Year-over-year growth 2025-2030 (%)
Data Table on Brazil - Year-over-year growth 2025-2030 (%)

12.6.2 Argentina - Market size and forecast 2025-2030

Chart on Argentina - Market size and forecast 2025-2030 ($ million)
Data Table on Argentina - Market size and forecast 2025-2030 ($ million)
Chart on Argentina - Year-over-year growth 2025-2030 (%)
Data Table on Argentina - Year-over-year growth 2025-2030 (%)

12.6.3 Colombia - Market size and forecast 2025-2030

Chart on Colombia - Market size and forecast 2025-2030 ($ million)
Data Table on Colombia - Market size and forecast 2025-2030 ($ million)
Chart on Colombia - Year-over-year growth 2025-2030 (%)
Data Table on Colombia - Year-over-year growth 2025-2030 (%)

12.7 Middle East and Africa - Market size and forecast 2025-2030

Chart on Middle East and Africa - Market size and forecast 2025-2030 ($ million)
Data Table on Middle East and Africa - Market size and forecast 2025-2030 ($ million)
Chart on Middle East and Africa - Year-over-year growth 2025-2030 (%)
Data Table on Middle East and Africa - Year-over-year growth 2025-2030 (%)
Chart on Regional Comparison - Middle East and Africa
Data Table on Regional Comparison - Middle East and Africa

12.7.1 Saudi Arabia - Market size and forecast 2025-2030

Chart on Saudi Arabia - Market size and forecast 2025-2030 ($ million)
Data Table on Saudi Arabia - Market size and forecast 2025-2030 ($ million)
Chart on Saudi Arabia - Year-over-year growth 2025-2030 (%)
Data Table on Saudi Arabia - Year-over-year growth 2025-2030 (%)

12.7.2 UAE - Market size and forecast 2025-2030

Chart on UAE - Market size and forecast 2025-2030 ($ million)
Data Table on UAE - Market size and forecast 2025-2030 ($ million)
Chart on UAE - Year-over-year growth 2025-2030 (%)
Data Table on UAE - Year-over-year growth 2025-2030 (%)

12.7.3 South Africa - Market size and forecast 2025-2030

Chart on South Africa - Market size and forecast 2025-2030 ($ million)
Data Table on South Africa - Market size and forecast 2025-2030 ($ million)
Chart on South Africa - Year-over-year growth 2025-2030 (%)
Data Table on South Africa - Year-over-year growth 2025-2030 (%)

12.7.4 Turkey - Market size and forecast 2025-2030

Chart on Turkey - Market size and forecast 2025-2030 ($ million)
Data Table on Turkey - Market size and forecast 2025-2030 ($ million)
Chart on Turkey - Year-over-year growth 2025-2030 (%)
Data Table on Turkey - Year-over-year growth 2025-2030 (%)

12.7.5 Egypt - Market size and forecast 2025-2030

Chart on Egypt - Market size and forecast 2025-2030 ($ million)
Data Table on Egypt - Market size and forecast 2025-2030 ($ million)
Chart on Egypt - Year-over-year growth 2025-2030 (%)
Data Table on Egypt - Year-over-year growth 2025-2030 (%)

12.8 Market opportunity by geography

Market opportunity by geography ($ million)
Data Tables on Market opportunity by geography ($ million)

13. Drivers, Challenges, and Opportunity

13.1 Market drivers

Convergence of desktop-grade silicon and edge AI capabilities
Enterprise demand for hybrid mobility and unified device management
Advanced display engineering and peripheral ecosystem innovation

13.2 Market challenges

Component supply constraints and escalating memory costs
Intense substitution pressure from ultrathin laptops and foldable devices
Accessory bundling friction and operating system fragmentation

13.3 Impact of drivers and challenges

Impact of drivers and challenges in 2025 and 2030

13.4 Market opportunities

Expansion of desktop-class operating systems on lightweight mobile architectures
Adoption of tandem OLED displays and ultra-low-latency stylus ecosystems
Proliferation of ruggedized and modular detachable solutions across industrial verticals

14. Competitive Landscape

14.1 Overview

14.2

Overview on criticality of inputs and factors of differentiation

14.3 Landscape disruption

Overview on factors of disruption

14.4 Industry risks

Impact of key risks on business

15. Competitive Analysis

15.1 Companies profiled

Companies covered

15.2 Company ranking index

15.3 Market positioning of companies

Matrix on companies position and classification

15.4 Acer Inc.

Acer Inc. - Overview
Acer Inc. - Business segments
Acer Inc. - Key offerings
Acer Inc. - Segment focus
SWOT

15.5 Apple Inc.

Apple Inc. - Overview
Apple Inc. - Business segments
Apple Inc. - Key news
Apple Inc. - Key offerings
Apple Inc. - Segment focus
SWOT

15.6 ASUSTeK Computer Inc.

ASUSTeK Computer Inc. - Overview
ASUSTeK Computer Inc. - Business segments
ASUSTeK Computer Inc. - Key offerings
ASUSTeK Computer Inc. - Segment focus
SWOT

15.7 Dell Technologies Inc.

Dell Technologies Inc. - Overview
Dell Technologies Inc. - Business segments
Dell Technologies Inc. - Key news
Dell Technologies Inc. - Key offerings
Dell Technologies Inc. - Segment focus
SWOT

15.8 Fujitsu Ltd.

Fujitsu Ltd. - Overview
Fujitsu Ltd. - Business segments
Fujitsu Ltd. - Key offerings
Fujitsu Ltd. - Segment focus
SWOT

15.9 Getac Holdings Corp.

Getac Holdings Corp. - Overview
Getac Holdings Corp. - Business segments
Getac Holdings Corp. - Key offerings
Getac Holdings Corp. - Segment focus
SWOT

15.10 HP Inc.

HP Inc. - Overview
HP Inc. - Business segments
HP Inc. - Key news
HP Inc. - Key offerings
HP Inc. - Segment focus
SWOT

15.11 Huawei Technologies Co. Ltd.

Huawei Technologies Co. Ltd. - Overview
Huawei Technologies Co. Ltd. - Product / Service
Huawei Technologies Co. Ltd. - Key offerings
SWOT

15.12 Lenovo Group Ltd.

Lenovo Group Ltd. - Overview
Lenovo Group Ltd. - Business segments
Lenovo Group Ltd. - Key news
Lenovo Group Ltd. - Key offerings
Lenovo Group Ltd. - Segment focus
SWOT

15.13 Microsoft Corp.

Microsoft Corp. - Overview
Microsoft Corp. - Business segments
Microsoft Corp. - Key news
Microsoft Corp. - Key offerings
Microsoft Corp. - Segment focus
SWOT

15.14 OnePlus Technology Co. Ltd.

OnePlus Technology Co. Ltd. - Overview
OnePlus Technology Co. Ltd. - Product / Service
OnePlus Technology Co. Ltd. - Key offerings
SWOT

15.15 Panasonic Holdings Corp.

Panasonic Holdings Corp. - Overview
Panasonic Holdings Corp. - Business segments
Panasonic Holdings Corp. - Key news
Panasonic Holdings Corp. - Key offerings
Panasonic Holdings Corp. - Segment focus
SWOT

15.16 Samsung Electronics Co. Ltd.

Samsung Electronics Co. Ltd. - Overview
Samsung Electronics Co. Ltd. - Business segments
Samsung Electronics Co. Ltd. - Key news
Samsung Electronics Co. Ltd. - Key offerings
Samsung Electronics Co. Ltd. - Segment focus
SWOT

15.17 Xiaomi Corp.

Xiaomi Corp. - Overview
Xiaomi Corp. - Business segments
Xiaomi Corp. - Key offerings
Xiaomi Corp. - Segment focus
SWOT

15.18 Zebra Technologies Corp.

Zebra Technologies Corp. - Overview
Zebra Technologies Corp. - Business segments
Zebra Technologies Corp. - Key news
Zebra Technologies Corp. - Key offerings
Zebra Technologies Corp. - Segment focus
SWOT

16. Appendix

16.1 Scope of the report

Market definition
Objectives
Notes and caveats

16.2 Inclusions and exclusions checklist

Inclusions checklist
Exclusions checklist

16.3 Currency conversion rates for US$

16.4 Research methodology

16.5 Data procurement

Information sources

16.6 Data validation

16.7 Validation techniques employed for market sizing

16.8 Data synthesis

16.9 360 degree market analysis

16.10 List of abbreviations

Research Methodology

Technavio presents a detailed picture of the market by way of study, synthesis, and summation of data from multiple sources. The analysts have presented the various facets of the market with a particular focus on identifying the key industry influencers. The data thus presented is comprehensive, reliable, and the result of extensive research, both primary and secondary.

INFORMATION SOURCES

Primary sources

  • Manufacturers and suppliers
  • Channel partners
  • Industry experts
  • Strategic decision makers

Secondary sources

  • Industry journals and periodicals
  • Government data
  • Financial reports of key industry players
  • Historical data
  • Press releases

DATA ANALYSIS

Data Synthesis

  • Collation of data
  • Estimation of key figures
  • Analysis of derived insights

Data Validation

  • Triangulation with data models
  • Reference against proprietary databases
  • Corroboration with industry experts

REPORT WRITING

Qualitative

  • Market drivers
  • Market challenges
  • Market trends
  • Five forces analysis

Quantitative

  • Market size and forecast
  • Market segmentation
  • Geographical insights
  • Competitive landscape

Interested in this report?

Get your sample now to see our research methodology and insights!

Download Now

Frequently Asked Questions

Detachable Tablet market growth will increase by USD 3762.9 million during 2026-2030.

The Detachable Tablet market is expected to grow at a CAGR of 4.6% during 2026-2030.

Detachable Tablet market is segmented by Os (Windows, iPadOS, Others) Type (Below 8 inches, 8 inches, Above 8 inches) Application (Personal, Professional)

Acer Inc., Apple Inc., ASUSTeK Computer Inc., Chuwi Innovation Ltd., Dell Technologies Inc., Durabook, Fujitsu Ltd., Getac Holdings Corp., Honor Device Co. Ltd., HP Inc., Huawei Technologies Co. Ltd., Lenovo Group Ltd., Microsoft Corp., OnePlus Technology Co. Ltd., Panasonic Holdings Corp., Samsung Electronics Co. Ltd., Winmate Inc., Xiaomi Corp., Zebra Technologies Corp. are a few of the key vendors in the Detachable Tablet market.

APAC will register the highest growth rate of 46.5% among the other regions. Therefore, the Detachable Tablet market in APAC is expected to garner significant business opportunities for the vendors during the forecast period.

China, Japan, India, South Korea, Australia, Indonesia, US, Canada, Mexico, Germany, UK, France, Italy, Spain, The Netherlands, Brazil, Argentina, Colombia, Saudi Arabia, UAE, South Africa, Turkey, Egypt

  • Convergence of desktop-grade silicon and edge AI capabilities is the driving factor this market.

The Detachable Tablet market vendors should focus on grabbing business opportunities from the Os segment as it accounted for the largest market share in the base year.
RIA - Research AI Assistant
Ask RIA