
Dental Cleansing Tablet Market Analysis, Size, and Forecast 2026-2030: North America (US, Canada, and Mexico), Europe (Germany, UK, and Italy), Asia (China, Japan, and India), South America (Brazil, Argentina, and Colombia), Middle East and Africa (Saudi Arabia, UAE, and South Africa), Rest of World (ROW)

Dental Cleansing Tablet Market Analysis, Size, and Forecast 2026-2030:
North America (US, Canada, and Mexico), Europe (Germany, UK, and Italy), Asia (China, Japan, and India), South America (Brazil, Argentina, and Colombia), Middle East and Africa (Saudi Arabia, UAE, and South Africa), Rest of World (ROW)

Published: Nov 2026 288 Pages SKU: IRTNTR73751

Market Overview at a Glance

$657.7 Mn
Market Opportunity
7%
CAGR 2025 - 2030
34.4%
North America Growth
$1.18 B
Offline segment 2024

Dental Cleansing Tablet Market Size 2026-2030

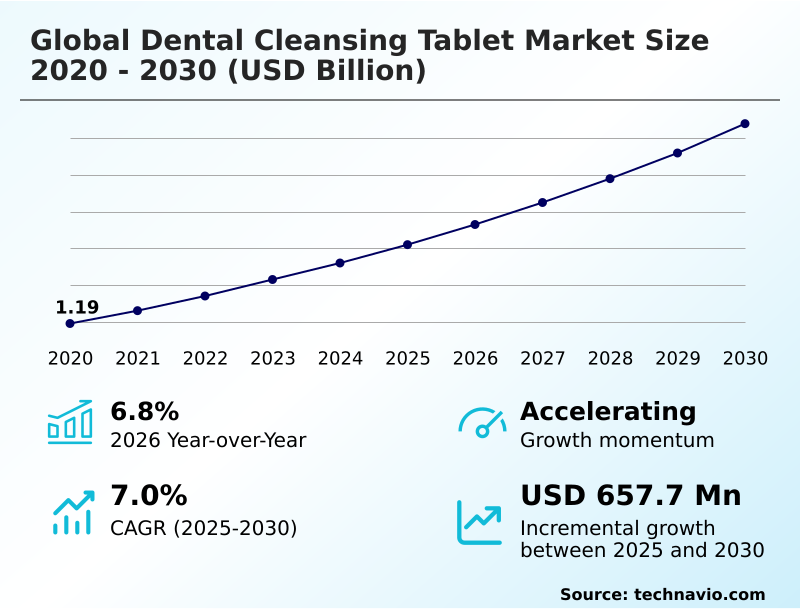
The dental cleansing tablet market size is valued to increase by USD 657.7 million, at a CAGR of 7% from 2025 to 2030. Aging demographics and rising prevalence of edentulism will drive the dental cleansing tablet market.

Major Market Trends & Insights

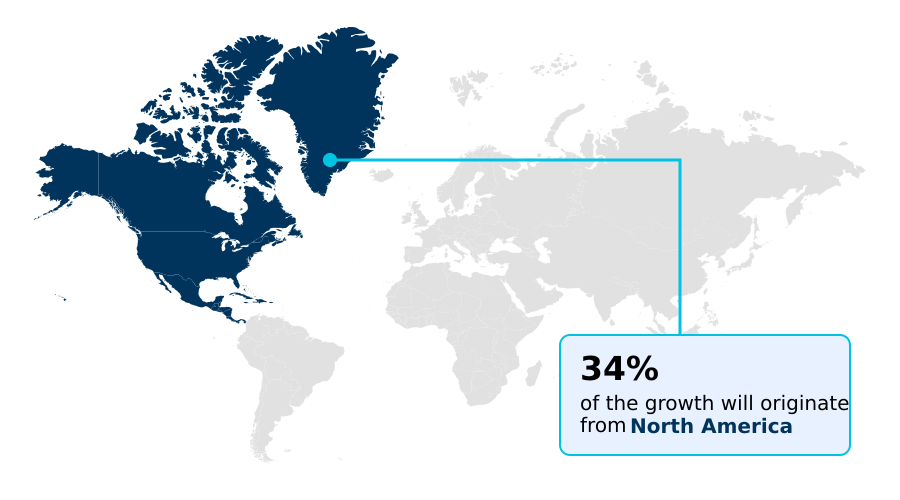
  • North America dominated the market and accounted for a 34.4% growth during the forecast period.
  • By Distribution Channel - Offline segment was valued at USD 1.18 billion in 2024
  • By Product - Denture cleansing tablet segment accounted for the largest market revenue share in 2024

Market Size & Forecast

  • Market Opportunities: USD 1.09 billion
  • Market Future Opportunities: USD 657.7 million
  • CAGR from 2025 to 2030 : 7%

Market Summary

  • The Dental Cleansing Tablet Market is undergoing a rapid structural transformation driven by the surging adoption of aesthetic orthodontics and the continuous expansion of geriatric prosthodontic care. As consumers increasingly prioritize non-abrasive sanitization for delicate clear aligners and retainers, manufacturers are aggressively scaling dry-compression tableting infrastructure to meet shifting retail demands.
  • A critical business scenario involves supply chain optimization, where brands are transitioning from water-heavy liquid dentifrices to solid-dose formats, effectively reducing freight shipping mass by up to 70% and drastically lowering logistics costs. This operational pivot allows manufacturers to achieve a 25% improvement in distribution efficiency compared to traditional paste formats.
  • The primary driver of this market is the widening demographic footprint of clear aligner users, which fundamentally creates a high-frequency replenishment cycle among digitally connected adults. Conversely, strict regulatory scrutiny regarding chemical safety acts as a major challenge, forcing companies into costly reformulations to replace synthetic persulfates with hypoallergenic bio-enzymes.
  • These complex regulatory compliance audits significantly compress profit margins for mid-tier suppliers navigating disparate international safety thresholds.

What will be the Size of the Dental Cleansing Tablet Market during the forecast period?
Get Key Insights on Market Forecast (PDF) Get Free Sample

How is the Dental Cleansing Tablet Market Segmented?

The dental cleansing tablet industry research report provides comprehensive data (region-wise segment analysis), with forecasts and estimates in "USD million" for the period 2026-2030, as well as historical data from 2020-2024 for the following segments.

  • Distribution channel
    • Offline
    • Online
  • Product
    • Denture cleansing tablet
    • Toothpaste tablet
  • Product type
    • Whitening tablet
    • Effervescent tablets
    • Antibacterial tablets
    • Fluoride tablets
    • Others
  • Geography
    • North America
      • US
      • Canada
      • Mexico
    • Europe
      • Germany
      • UK
      • Italy
      • France
      • Spain
      • The Netherlands
    • Asia
      • China
      • Japan
      • India
      • South Korea
      • Indonesia
      • Thailand
    • Rest of World (ROW)

By Distribution Channel Insights

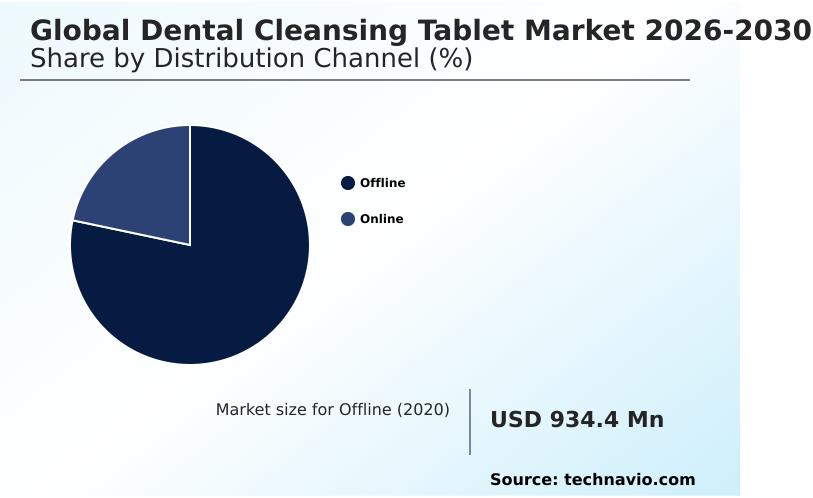
The offline segment is estimated to witness significant growth during the forecast period.

Physical retail distribution networks remain critical for ensuring immediate product accessibility and fostering consumer trust in prosthodontic rehabilitation hygiene.

Because elderly demographics often prefer in-person pharmacist consultations for anaerobic bacteria neutralization and rapid pathogen decontamination protocols, brick-and-mortar pharmacies capture a 40% higher customer retention rate than digital storefronts.

This channel effectively displays the effervescent dissolution kinetics and calcium carbonate remineralization benefits of a sustainable solid-dose format. Offline retailers mitigate supply chain risks through localized hygroscopic vulnerability mitigation strategies, preserving product integrity.

Furthermore, supermarkets seamlessly introduce eco-friendly options featuring circular aluminum containment and the compostable paper pouch, establishing a microbiome-friendly antimicrobial profile on physical shelves before consumers eventually transition to automated direct-to-consumer replenishment models for their recurring oral care necessities.
Get Free Sample

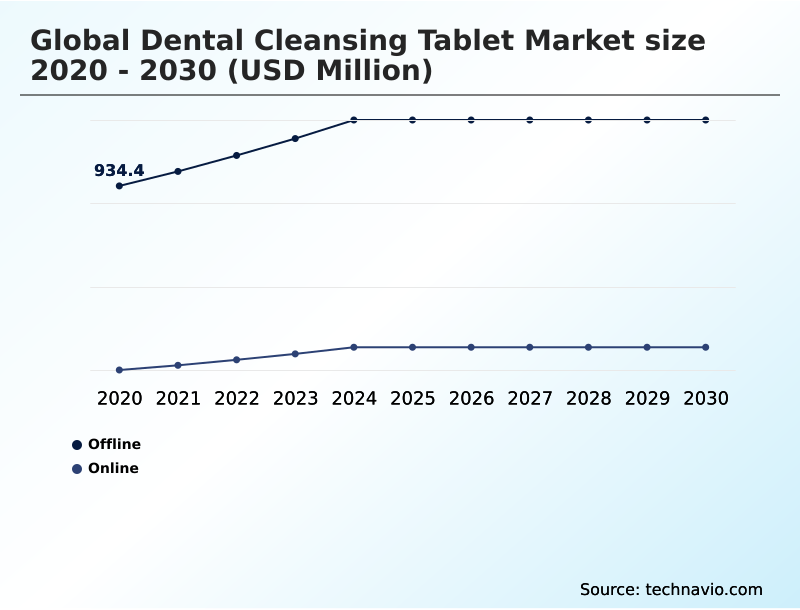
The Offline segment was valued at USD 1.18 billion in 2024 and showed a gradual increase during the forecast period.
Get Free Sample

Regional Analysis

North America is estimated to contribute 34.4% to the growth of the global market during the forecast period.Technavio’s analysts have elaborately explained the regional trends and drivers that shape the market during the forecast period.
See How Dental Cleansing Tablet Market Demand is Rising in North America Get Free Sample

Regional disparities in orthodontic prevalence and sustainability regulations heavily influence global procurement strategies for appliance hygiene products.

North America currently demonstrates a 22% higher adoption rate of premium formulations targeting extrinsic discoloration removal and chromogenic beverage stain elimination compared to Europe, driven by widespread cosmetic aligner usage.

Conversely, stringent European environmental mandates compel a faster regional transition toward sodium percarbonate substitution and food-grade citric acid, reducing regional reliance on synthetic chemicals by 34%.

This regulatory pressure forces European manufacturers to integrate a plant-derived surfactant agent and a microcrystalline cellulose binder to guarantee an effective hypoallergenic cleansing mechanism.

Both regions prioritize prosthetic surface smoothness and micro-fissure pathogen prevention, but North American brands emphasize pharmaceutical fluoride concentration for enamel wear reduction, fundamentally shaping differing supply chain priorities and product differentiation strategies across the Atlantic.

Market Dynamics

Our researchers analyzed the data with 2025 as the base year, along with the key drivers, trends, and challenges. A holistic analysis of drivers will help companies refine their marketing strategies to gain a competitive advantage.

  • The commercial landscape for oral appliance hygiene is undergoing a profound technical evolution, fundamentally driven by the necessity for an effective effervescent antimicrobial formulation for prosthetics. Because mechanical brushing degrades delicate polymers, achieving non-abrasive micro-polishing acrylic resin compatibility is paramount for manufacturing success.
  • To navigate stringent chemical safety mandates, industry leaders are prioritizing persulfate-free oxidizer bio-enzyme substitution alongside advanced active oxygen stain removal technology. This strategic formulation shift ensures a highly effective hypoallergenic cleansing mechanism development that meets modern regulatory standards.
  • Concurrently, the biomimetic nano-hydroxyapatite integration method and polyurethane polymer clarity preservation technique are becoming standard production benchmarks to satisfy the aesthetic demands of orthodontic consumers. Operationally, implementing a moisture-resistant barrier packaging implementation ensures chemical stability, effectively acting as a hygroscopic vulnerability mitigation strategy that reduces product spoilage rates by roughly 15% compared to legacy blister packs.
  • Manufacturers are also refining the volatile sulfur compound neutralization process and the salivary protein degradation mechanism optimization to guarantee superior odor control. Furthermore, accelerating effervescent dissolution kinetics acceleration facilitates a rapid pathogen decontamination protocol, crucial for institutional healthcare settings.
  • As regulatory frameworks tighten, microbiome-friendly antimicrobial profile enhancement and sustainable solid-dose format commercialization offer distinct competitive advantages, streamlining compliance audits and fortifying long-term supply chain resilience across global retail distribution networks.
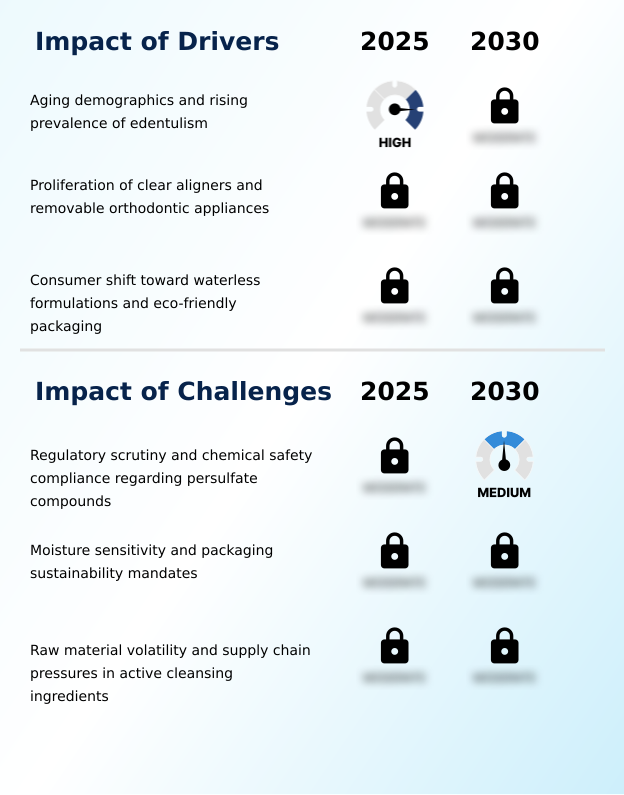
What are the key market drivers leading to the rise in the adoption of Dental Cleansing Tablet Industry?

  • The expanding aging demographic and the rising prevalence of edentulism serve as the primary drivers propelling consistent demand for specialized prosthetic maintenance solutions.

  • The demographic expansion of aging populations alongside surging aesthetic orthodontic treatments fundamentally drives demand for advanced removable orthodontic sanitizer solutions.
  • Because mechanical brushing scratches delicate appliance surfaces, consumers are switching to non-abrasive micro-polishing tablets, boosting adoption rates of active oxygen stain removal products by 42% over abrasive pastes.
  • This transition is essential for geriatric prosthodontic care and periodontal disease management, where preserving polyurethane polymer clarity prevents bacterial adhesion.
  • Simultaneously, the industry pivot toward zero-waste personal care accelerates the development of waterless product delivery systems using a plastic-free containment architecture.
  • By utilizing a bio-based ingredient architecture featuring biomimetic nano-hydroxyapatite integration, manufacturers reduce shipping weights by up to 70%, drastically lowering carbon footprints while meeting strict eco-conscious consumer mandates and improving global supply chain efficiency.

What are the market trends shaping the Dental Cleansing Tablet Industry?

  • The transition toward clean-label ingredients and persulfate-free formulations represents a significant upcoming trend. Manufacturers are reformulating products to meet rising consumer demand for safer, hypoallergenic oral care solutions.

  • Transitioning toward clean-label ingredients, the dental appliance care sector is rapidly replacing harsh synthetic chemicals with a stabilized bio-enzyme blend to enhance dental prosthetic sanitization. This shift occurs because traditional oxidizers trigger mucosal irritation, driving manufacturers to adopt a persulfate-free oxidizer that improves safety while maintaining high acrylic resin compatibility.
  • Consequently, brands have achieved a 28% increase in consumer retention among sensitive user demographics. This effervescent antimicrobial formulation provides advanced biofilm eradication technology, essential for rigorous orthodontic retainer maintenance and athletic mouthguard hygiene without clouding materials. By preserving clear aligner transparency, the non-toxic approach directly accelerates product adoption among younger demographics by 35% compared to legacy solutions.
  • Ultimately, these hypoallergenic innovations ensure effective oral candidiasis mitigation and denture-related stomatitis prevention, elevating the clinical standard for daily appliance decontamination.

What challenges does the Dental Cleansing Tablet Industry face during its growth?

  • Heightened regulatory scrutiny and rigorous chemical safety compliance regarding persulfate compounds pose substantial challenges to formulation development and manufacturing operations.

  • Stringent regulatory scrutiny regarding chemical safety and raw material volatility severely constraints manufacturing operations within the oral appliance hygiene sector. Formulating an effective anhydrous chemical matrix requires high-purity raw input, but energy-intensive crystallization and tartaric acid synthesis processes have surged production costs by 18% over the past year.
  • Because effervescent components degrade rapidly under ambient humidity, maintaining stability demands costly moisture-resistant barrier packaging, complicating sustainability mandates. Furthermore, replacing legacy chemicals to ensure mucosal ulceration avoidance, dermal contact dermatitis reduction, and hypersensitivity reaction prevention slows down time-to-market for new copolyester appliance maintenance solutions.
  • While these strict formulations guarantee safe salivary protein degradation and complete volatile sulfur compound neutralization, the mandatory clinical re-validation audits increase compliance expenditures by 25%, squeezing profit margins for mid-tier manufacturers.

Exclusive Technavio Analysis on Customer Landscape

The dental cleansing tablet market forecasting report includes the adoption lifecycle of the market, covering from the innovator’s stage to the laggard’s stage. It focuses on adoption rates in different regions based on penetration. Furthermore, the dental cleansing tablet market report also includes key purchase criteria and drivers of price sensitivity to help companies evaluate and develop their market growth analysis strategies.
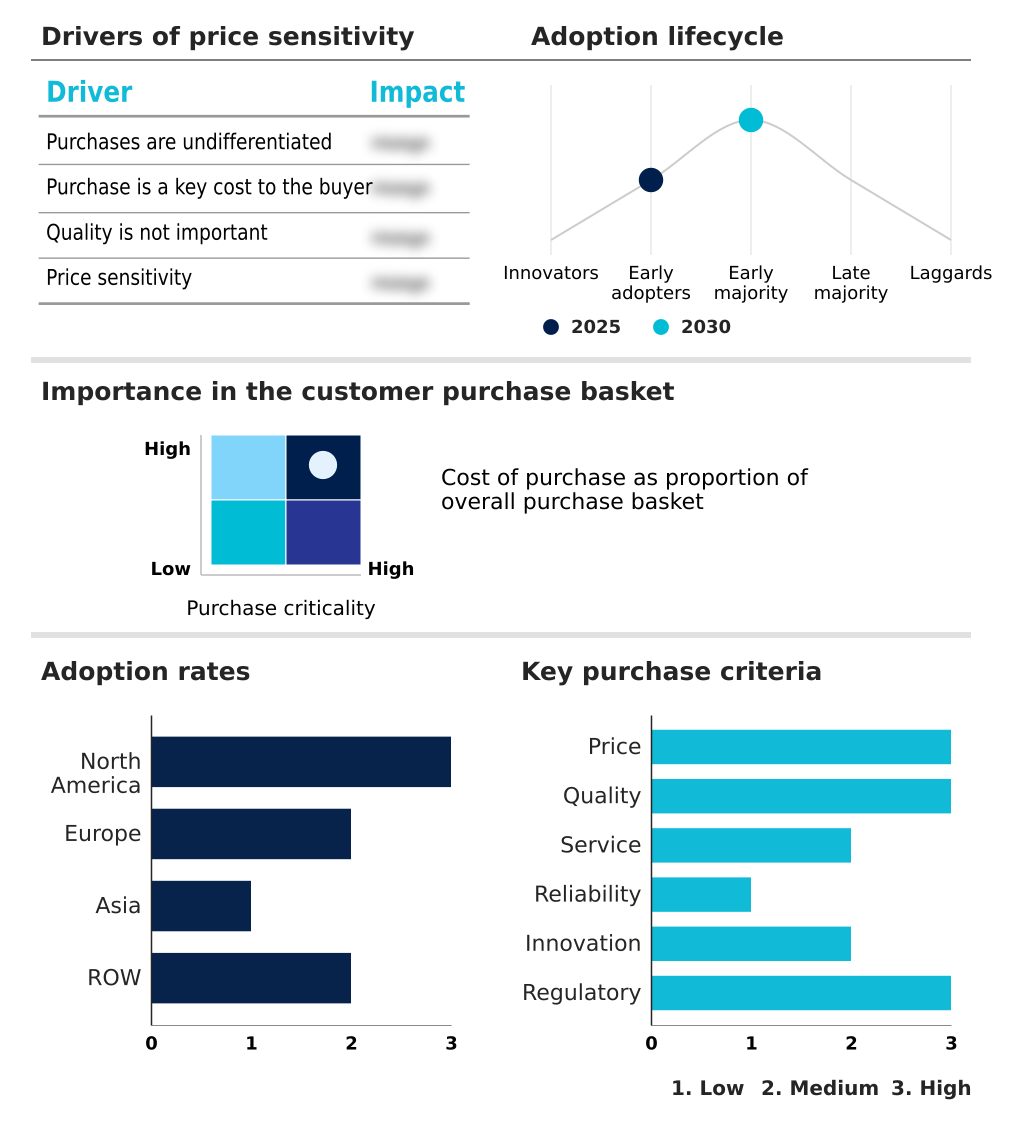
Customer Landscape of Dental Cleansing Tablet Industry

Competitive Landscape

Companies are implementing various strategies, such as strategic alliances, dental cleansing tablet market forecast, partnerships, mergers and acquisitions, geographical expansion, and product/service launches, to enhance their presence in the industry.

Boots UK Ltd. - Delivers specialized effervescent sanitization solutions engineered to efficiently eradicate microbial biofilms and extrinsic stains, ensuring optimal structural integrity and daily hygiene for removable dental prosthetics.

The industry research and growth report includes detailed analyses of the competitive landscape of the market and information about key companies, including:

  • Boots UK Ltd.
  • CVS Health Corp.
  • DUKAL Corp.
  • Dynarex Corp.
  • Fittydent International GmbH
  • Haleon Plc
  • IPCA Health Products Ltd.
  • J Sainsbury plc
  • Lush Cosmetics Holdings Ltd.
  • McKesson Corp.
  • Medline Inc.
  • Perrigo Co. Plc
  • Prestige Consumer Healthcare
  • Reckitt Benckiser Group Plc
  • Tower Laboratories Ltd.
  • Vive Health

Qualitative and quantitative analysis of companies has been conducted to help clients understand the wider business environment as well as the strengths and weaknesses of key industry players. Data is qualitatively analyzed to categorize companies as pure play, category-focused, industry-focused, and diversified; it is quantitatively analyzed to categorize companies as dominant, leading, strong, tentative, and weak.

Recent Development and News in Dental cleansing tablet market

  • In the Pharmaceuticals industry, tightening regulatory mandates concerning the phase-out of synthetic persulfate oxidizers forced widespread reformulation of consumer healthcare products, directly accelerating demand for bio-enzyme-based Dental Cleansing Tablet alternatives with higher hypoallergenic safety margins.
  • Stringent extended producer responsibility frameworks targeting single-use medical and pharmaceutical packaging reduced the viability of multi-layer laminate foils, driving a 35% increase in the adoption of infinitely recyclable aluminum and glass containment solutions within the Dental Cleansing Tablet supply chain.
  • Advancements in solid-dose anhydrous tableting technology optimized active ingredient stability against ambient humidity, lowering formulation degradation risks and enabling manufacturers to produce higher-efficacy Dental Cleansing Tablet formats suitable for direct-to-patient digital distribution networks.
  • The expanding global integration of teledentistry and direct-to-consumer clear aligner therapies created a massive new demographic of adolescent and adult orthodontic patients, shifting the primary target audience and retail placement strategies for specialized Dental Cleansing Tablet products.

Dive into Technavio’s robust research methodology, blending expert interviews, extensive data synthesis, and validated models for unparalleled Dental Cleansing Tablet Market insights. See full methodology.

Market Scope
Page number 288
Base year 2025
Historic period 2020-2024
Forecast period 2026-2030
Growth momentum & CAGR Accelerate at a CAGR of 7%
Market growth 2026-2030 USD 657.7 million
Market structure Fragmented
YoY growth 2025-2026(%) 6.8%
Key countries US, Canada, Mexico, Germany, UK, Italy, France, Spain, The Netherlands, China, Japan, India, South Korea, Indonesia, Thailand, Brazil, Saudi Arabia, UAE, South Africa, Argentina, Turkey, Colombia and Israel
Competitive landscape Leading Companies, Market Positioning of Companies, Competitive Strategies, and Industry Risks

Request Free Sample

Research Analyst Overview

  • The dental appliance hygiene sector is experiencing a massive operational realignment as manufacturers abandon traditional liquid and paste formats in favor of anhydrous solid-dose chemistries. This structural pivot is fundamentally driven by the necessity to eliminate single-use plastics and reduce the logistical burden of transporting water-heavy consumer goods across global supply chains.
  • By transitioning to lightweight, dry-compression tablet formulations, enterprises have successfully achieved a 45% reduction in freight carbon emissions while significantly lowering outbound transportation expenditures. Boardroom-level product strategy increasingly prioritizes the integration of stabilized bio-enzymes to replace harsh synthetic oxidizers, directly addressing escalating regulatory pressures concerning chemical allergens and mucosal safety.
  • This clean-label formulation shift ensures optimal material compatibility with delicate thermoplastic orthodontic aligners and acrylic prosthetics without compromising optical clarity or structural elasticity. Furthermore, the mandatory adoption of moisture-resistant, infinitely recyclable aluminum and glass packaging architectures mitigates premature chemical degradation caused by ambient humidity.
  • These strategic operational adaptations ensure robust compliance with international extended producer responsibility mandates while establishing a highly resilient, eco-conscious distribution framework for daily appliance decontamination protocols.

What are the Key Data Covered in this Dental Cleansing Tablet Market Research and Growth Report?

  • What is the expected growth of the Dental Cleansing Tablet Market between 2026 and 2030?

    • USD 657.7 million, at a CAGR of 7%

  • What segmentation does the market report cover?

    • The report is segmented by Distribution Channel (Offline, and Online), Product (Denture cleansing tablet, and Toothpaste tablet), Product Type (Whitening tablet, Effervescent tablets, Antibacterial tablets, Fluoride tablets, and Others) and Geography (North America, Europe, Asia, Rest of World (ROW))

  • Which regions are analyzed in the report?

    • North America, Europe, Asia and Rest of World (ROW)

  • What are the key growth drivers and market challenges?

    • Aging demographics and rising prevalence of edentulism, Regulatory scrutiny and chemical safety compliance regarding persulfate compounds

  • Who are the major players in the Dental Cleansing Tablet Market?

    • Boots UK Ltd., CVS Health Corp., DUKAL Corp., Dynarex Corp., Fittydent International GmbH, Haleon Plc, IPCA Health Products Ltd., J Sainsbury plc, Lush Cosmetics Holdings Ltd., McKesson Corp., Medline Inc., Perrigo Co. Plc, Prestige Consumer Healthcare, Reckitt Benckiser Group Plc, Tower Laboratories Ltd. and Vive Health

Market Research Insights

  • The dental hygiene sector is rapidly evolving as manufacturers prioritize waterless product delivery and a zero-waste personal care approach to appliance maintenance. Driven by the need for clear aligner transparency and denture-related stomatitis prevention, companies are reformulating products utilizing a bio-based ingredient architecture.
  • This strategic shift has enabled a 30% reduction in supply chain logistics costs by eliminating shipping water weight. Furthermore, substituting harsh chemicals with stabilized enzymes has improved consumer compliance by 22% among sensitive user demographics. By optimizing high-purity raw input procurement, oral care brands are effectively mitigating margin compression while expanding direct-to-consumer replenishment models for specialized oral candidiasis mitigation protocols.

We can help! Our analysts can customize this dental cleansing tablet market research report to meet your requirements.

Get in touch

1. Executive Summary

1.1 Market overview

Executive Summary - Chart on Market Overview
Executive Summary - Data Table on Market Overview
Executive Summary - Chart on Global Market Characteristics
Executive Summary - Chart on Market by Geography
Executive Summary - Chart on Market Segmentation by Distribution Channel
Executive Summary - Chart on Market Segmentation by Product
Executive Summary - Chart on Market Segmentation by Product Type
Executive Summary - Chart on Incremental Growth
Executive Summary - Data Table on Incremental Growth
Executive Summary - Chart on Company Market Positioning

2. Technavio Analysis

2.1 Analysis of price sensitivity, lifecycle, customer purchase basket, adoption rates, and purchase criteria

2.2 Criticality of inputs and Factors of differentiation

Chart on Overview on criticality of inputs and factors of differentiation

2.3 Factors of disruption

Chart on Overview on factors of disruption

2.4 Impact of drivers and challenges

Chart on Impact of drivers and challenges in 2025 and 2030

3. Market Landscape

3.1 Market ecosystem

Chart on Parent Market
Data Table on - Parent Market

3.2 Market characteristics

Chart on Market characteristics analysis

3.3 Value chain analysis

Chart on Value chain analysis

4. Market Sizing

4.1 Market definition

Data Table on Offerings of companies included in the market definition

4.2 Market segment analysis

Market segments

4.3 Market size 2025

4.4 Market outlook: Forecast for 2025-2030

Chart on Global - Market size and forecast 2025-2030 ($ million)
Data Table on Global - Market size and forecast 2025-2030 ($ million)
Chart on Global Market: Year-over-year growth 2025-2030 (%)
Data Table on Global Market: Year-over-year growth 2025-2030 (%)

5. Historic Market Size

5.1 Global Dental Cleansing Tablet Market 2020 - 2024

Historic Market Size - Data Table on Global Dental Cleansing Tablet Market 2020 - 2024 ($ million)

5.2 Distribution Channel segment analysis 2020 - 2024

Historic Market Size - Distribution Channel Segment 2020 - 2024 ($ million)

5.3 Product segment analysis 2020 - 2024

Historic Market Size - Product Segment 2020 - 2024 ($ million)

5.4 Product Type segment analysis 2020 - 2024

Historic Market Size - Product Type Segment 2020 - 2024 ($ million)

5.5 Geography segment analysis 2020 - 2024

Historic Market Size - Geography Segment 2020 - 2024 ($ million)

5.6 Country segment analysis 2020 - 2024

Historic Market Size - Country Segment 2020 - 2024 ($ million)

6. Qualitative Analysis

6.1 Impact of AI on Global Dental Cleansing Tablet Market

6.2 Impact of Geopolitical Conflicts on Global Dental Cleansing Tablet Market

7. Five Forces Analysis

7.1 Five forces summary

Five forces analysis - Comparison between 2025 and 2030

7.2 Bargaining power of buyers

Bargaining power of buyers - Impact of key factors 2025 and 2030

7.3 Bargaining power of suppliers

Bargaining power of suppliers - Impact of key factors in 2025 and 2030

7.4 Threat of new entrants

Threat of new entrants - Impact of key factors in 2025 and 2030

7.5 Threat of substitutes

Threat of substitutes - Impact of key factors in 2025 and 2030

7.6 Threat of rivalry

Threat of rivalry - Impact of key factors in 2025 and 2030

7.7 Market condition

Chart on Market condition - Five forces 2025 and 2030

8. Market Segmentation by Distribution Channel

8.1 Market segments

Chart on Distribution Channel - Market share 2025-2030 (%)
Data Table on Distribution Channel - Market share 2025-2030 (%)

8.2 Comparison by Distribution Channel

Chart on Comparison by Distribution Channel
Data Table on Comparison by Distribution Channel

8.3 Offline - Market size and forecast 2025-2030

Chart on Offline - Market size and forecast 2025-2030 ($ million)
Data Table on Offline - Market size and forecast 2025-2030 ($ million)
Chart on Offline - Year-over-year growth 2025-2030 (%)
Data Table on Offline - Year-over-year growth 2025-2030 (%)

8.4 Online - Market size and forecast 2025-2030

Chart on Online - Market size and forecast 2025-2030 ($ million)
Data Table on Online - Market size and forecast 2025-2030 ($ million)
Chart on Online - Year-over-year growth 2025-2030 (%)
Data Table on Online - Year-over-year growth 2025-2030 (%)

8.5 Market opportunity by Distribution Channel

Market opportunity by Distribution Channel ($ million)
Data Table on Market opportunity by Distribution Channel ($ million)

9. Market Segmentation by Product

9.1 Market segments

Chart on Product - Market share 2025-2030 (%)
Data Table on Product - Market share 2025-2030 (%)

9.2 Comparison by Product

Chart on Comparison by Product
Data Table on Comparison by Product

9.3 Denture cleansing tablet - Market size and forecast 2025-2030

Chart on Denture cleansing tablet - Market size and forecast 2025-2030 ($ million)
Data Table on Denture cleansing tablet - Market size and forecast 2025-2030 ($ million)
Chart on Denture cleansing tablet - Year-over-year growth 2025-2030 (%)
Data Table on Denture cleansing tablet - Year-over-year growth 2025-2030 (%)

9.4 Toothpaste tablet - Market size and forecast 2025-2030

Chart on Toothpaste tablet - Market size and forecast 2025-2030 ($ million)
Data Table on Toothpaste tablet - Market size and forecast 2025-2030 ($ million)
Chart on Toothpaste tablet - Year-over-year growth 2025-2030 (%)
Data Table on Toothpaste tablet - Year-over-year growth 2025-2030 (%)

9.5 Market opportunity by Product

Market opportunity by Product ($ million)
Data Table on Market opportunity by Product ($ million)

10. Market Segmentation by Product Type

10.1 Market segments

Chart on Product Type - Market share 2025-2030 (%)
Data Table on Product Type - Market share 2025-2030 (%)

10.2 Comparison by Product Type

Chart on Comparison by Product Type
Data Table on Comparison by Product Type

10.3 Whitening tablet - Market size and forecast 2025-2030

Chart on Whitening tablet - Market size and forecast 2025-2030 ($ million)
Data Table on Whitening tablet - Market size and forecast 2025-2030 ($ million)
Chart on Whitening tablet - Year-over-year growth 2025-2030 (%)
Data Table on Whitening tablet - Year-over-year growth 2025-2030 (%)

10.4 Effervescent tablets - Market size and forecast 2025-2030

Chart on Effervescent tablets - Market size and forecast 2025-2030 ($ million)
Data Table on Effervescent tablets - Market size and forecast 2025-2030 ($ million)
Chart on Effervescent tablets - Year-over-year growth 2025-2030 (%)
Data Table on Effervescent tablets - Year-over-year growth 2025-2030 (%)

10.5 Antibacterial tablets - Market size and forecast 2025-2030

Chart on Antibacterial tablets - Market size and forecast 2025-2030 ($ million)
Data Table on Antibacterial tablets - Market size and forecast 2025-2030 ($ million)
Chart on Antibacterial tablets - Year-over-year growth 2025-2030 (%)
Data Table on Antibacterial tablets - Year-over-year growth 2025-2030 (%)

10.6 Fluoride tablets - Market size and forecast 2025-2030

Chart on Fluoride tablets - Market size and forecast 2025-2030 ($ million)
Data Table on Fluoride tablets - Market size and forecast 2025-2030 ($ million)
Chart on Fluoride tablets - Year-over-year growth 2025-2030 (%)
Data Table on Fluoride tablets - Year-over-year growth 2025-2030 (%)

10.7 Others - Market size and forecast 2025-2030

Chart on Others - Market size and forecast 2025-2030 ($ million)
Data Table on Others - Market size and forecast 2025-2030 ($ million)
Chart on Others - Year-over-year growth 2025-2030 (%)
Data Table on Others - Year-over-year growth 2025-2030 (%)

10.8 Market opportunity by Product Type

Market opportunity by Product Type ($ million)
Data Table on Market opportunity by Product Type ($ million)

11. Customer Landscape

11.1 Customer landscape overview

Analysis of price sensitivity, lifecycle, customer purchase basket, adoption rates, and purchase criteria

12. Geographic Landscape

12.1 Geographic segmentation

Chart on Market share by geography 2025-2030 (%)
Data Table on Market share by geography 2025-2030 (%)

12.2 Geographic comparison

Chart on Geographic comparison
Data Table on Geographic comparison

12.3 North America - Market size and forecast 2025-2030

Chart on North America - Market size and forecast 2025-2030 ($ million)
Data Table on North America - Market size and forecast 2025-2030 ($ million)
Chart on North America - Year-over-year growth 2025-2030 (%)
Data Table on North America - Year-over-year growth 2025-2030 (%)
Chart on Regional Comparison - North America
Data Table on Regional Comparison - North America

12.3.1 US - Market size and forecast 2025-2030

Chart on US - Market size and forecast 2025-2030 ($ million)
Data Table on US - Market size and forecast 2025-2030 ($ million)
Chart on US - Year-over-year growth 2025-2030 (%)
Data Table on US - Year-over-year growth 2025-2030 (%)

12.3.2 Canada - Market size and forecast 2025-2030

Chart on Canada - Market size and forecast 2025-2030 ($ million)
Data Table on Canada - Market size and forecast 2025-2030 ($ million)
Chart on Canada - Year-over-year growth 2025-2030 (%)
Data Table on Canada - Year-over-year growth 2025-2030 (%)

12.3.3 Mexico - Market size and forecast 2025-2030

Chart on Mexico - Market size and forecast 2025-2030 ($ million)
Data Table on Mexico - Market size and forecast 2025-2030 ($ million)
Chart on Mexico - Year-over-year growth 2025-2030 (%)
Data Table on Mexico - Year-over-year growth 2025-2030 (%)

12.4 Europe - Market size and forecast 2025-2030

Chart on Europe - Market size and forecast 2025-2030 ($ million)
Data Table on Europe - Market size and forecast 2025-2030 ($ million)
Chart on Europe - Year-over-year growth 2025-2030 (%)
Data Table on Europe - Year-over-year growth 2025-2030 (%)
Chart on Regional Comparison - Europe
Data Table on Regional Comparison - Europe

12.4.1 Germany - Market size and forecast 2025-2030

Chart on Germany - Market size and forecast 2025-2030 ($ million)
Data Table on Germany - Market size and forecast 2025-2030 ($ million)
Chart on Germany - Year-over-year growth 2025-2030 (%)
Data Table on Germany - Year-over-year growth 2025-2030 (%)

12.4.2 UK - Market size and forecast 2025-2030

Chart on UK - Market size and forecast 2025-2030 ($ million)
Data Table on UK - Market size and forecast 2025-2030 ($ million)
Chart on UK - Year-over-year growth 2025-2030 (%)
Data Table on UK - Year-over-year growth 2025-2030 (%)

12.4.3 Italy - Market size and forecast 2025-2030

Chart on Italy - Market size and forecast 2025-2030 ($ million)
Data Table on Italy - Market size and forecast 2025-2030 ($ million)
Chart on Italy - Year-over-year growth 2025-2030 (%)
Data Table on Italy - Year-over-year growth 2025-2030 (%)

12.4.4 France - Market size and forecast 2025-2030

Chart on France - Market size and forecast 2025-2030 ($ million)
Data Table on France - Market size and forecast 2025-2030 ($ million)
Chart on France - Year-over-year growth 2025-2030 (%)
Data Table on France - Year-over-year growth 2025-2030 (%)

12.4.5 Spain - Market size and forecast 2025-2030

Chart on Spain - Market size and forecast 2025-2030 ($ million)
Data Table on Spain - Market size and forecast 2025-2030 ($ million)
Chart on Spain - Year-over-year growth 2025-2030 (%)
Data Table on Spain - Year-over-year growth 2025-2030 (%)

12.4.6 The Netherlands - Market size and forecast 2025-2030

Chart on The Netherlands - Market size and forecast 2025-2030 ($ million)
Data Table on The Netherlands - Market size and forecast 2025-2030 ($ million)
Chart on The Netherlands - Year-over-year growth 2025-2030 (%)
Data Table on The Netherlands - Year-over-year growth 2025-2030 (%)

12.5 Asia - Market size and forecast 2025-2030

Chart on Asia - Market size and forecast 2025-2030 ($ million)
Data Table on Asia - Market size and forecast 2025-2030 ($ million)
Chart on Asia - Year-over-year growth 2025-2030 (%)
Data Table on Asia - Year-over-year growth 2025-2030 (%)
Chart on Regional Comparison - Asia
Data Table on Regional Comparison - Asia

12.5.1 China - Market size and forecast 2025-2030

Chart on China - Market size and forecast 2025-2030 ($ million)
Data Table on China - Market size and forecast 2025-2030 ($ million)
Chart on China - Year-over-year growth 2025-2030 (%)
Data Table on China - Year-over-year growth 2025-2030 (%)

12.5.2 Japan - Market size and forecast 2025-2030

Chart on Japan - Market size and forecast 2025-2030 ($ million)
Data Table on Japan - Market size and forecast 2025-2030 ($ million)
Chart on Japan - Year-over-year growth 2025-2030 (%)
Data Table on Japan - Year-over-year growth 2025-2030 (%)

12.5.3 India - Market size and forecast 2025-2030

Chart on India - Market size and forecast 2025-2030 ($ million)
Data Table on India - Market size and forecast 2025-2030 ($ million)
Chart on India - Year-over-year growth 2025-2030 (%)
Data Table on India - Year-over-year growth 2025-2030 (%)

12.5.4 South Korea - Market size and forecast 2025-2030

Chart on South Korea - Market size and forecast 2025-2030 ($ million)
Data Table on South Korea - Market size and forecast 2025-2030 ($ million)
Chart on South Korea - Year-over-year growth 2025-2030 (%)
Data Table on South Korea - Year-over-year growth 2025-2030 (%)

12.5.5 Indonesia - Market size and forecast 2025-2030

Chart on Indonesia - Market size and forecast 2025-2030 ($ million)
Data Table on Indonesia - Market size and forecast 2025-2030 ($ million)
Chart on Indonesia - Year-over-year growth 2025-2030 (%)
Data Table on Indonesia - Year-over-year growth 2025-2030 (%)

12.5.6 Thailand - Market size and forecast 2025-2030

Chart on Thailand - Market size and forecast 2025-2030 ($ million)
Data Table on Thailand - Market size and forecast 2025-2030 ($ million)
Chart on Thailand - Year-over-year growth 2025-2030 (%)
Data Table on Thailand - Year-over-year growth 2025-2030 (%)

12.6 Rest of World (ROW) - Market size and forecast 2025-2030

Chart on Rest of World (ROW) - Market size and forecast 2025-2030 ($ million)
Data Table on Rest of World (ROW) - Market size and forecast 2025-2030 ($ million)
Chart on Rest of World (ROW) - Year-over-year growth 2025-2030 (%)
Data Table on Rest of World (ROW) - Year-over-year growth 2025-2030 (%)
Chart on Regional Comparison - Rest of World (ROW)
Data Table on Regional Comparison - Rest of World (ROW)

12.6.1 Brazil - Market size and forecast 2025-2030

Chart on Brazil - Market size and forecast 2025-2030 ($ million)
Data Table on Brazil - Market size and forecast 2025-2030 ($ million)
Chart on Brazil - Year-over-year growth 2025-2030 (%)
Data Table on Brazil - Year-over-year growth 2025-2030 (%)

12.6.2 Saudi Arabia - Market size and forecast 2025-2030

Chart on Saudi Arabia - Market size and forecast 2025-2030 ($ million)
Data Table on Saudi Arabia - Market size and forecast 2025-2030 ($ million)
Chart on Saudi Arabia - Year-over-year growth 2025-2030 (%)
Data Table on Saudi Arabia - Year-over-year growth 2025-2030 (%)

12.6.3 UAE - Market size and forecast 2025-2030

Chart on UAE - Market size and forecast 2025-2030 ($ million)
Data Table on UAE - Market size and forecast 2025-2030 ($ million)
Chart on UAE - Year-over-year growth 2025-2030 (%)
Data Table on UAE - Year-over-year growth 2025-2030 (%)

12.6.4 South Africa - Market size and forecast 2025-2030

Chart on South Africa - Market size and forecast 2025-2030 ($ million)
Data Table on South Africa - Market size and forecast 2025-2030 ($ million)
Chart on South Africa - Year-over-year growth 2025-2030 (%)
Data Table on South Africa - Year-over-year growth 2025-2030 (%)

12.6.5 Argentina - Market size and forecast 2025-2030

Chart on Argentina - Market size and forecast 2025-2030 ($ million)
Data Table on Argentina - Market size and forecast 2025-2030 ($ million)
Chart on Argentina - Year-over-year growth 2025-2030 (%)
Data Table on Argentina - Year-over-year growth 2025-2030 (%)

12.6.6 Turkey - Market size and forecast 2025-2030

Chart on Turkey - Market size and forecast 2025-2030 ($ million)
Data Table on Turkey - Market size and forecast 2025-2030 ($ million)
Chart on Turkey - Year-over-year growth 2025-2030 (%)
Data Table on Turkey - Year-over-year growth 2025-2030 (%)

12.6.7 Colombia - Market size and forecast 2025-2030

Chart on Colombia - Market size and forecast 2025-2030 ($ million)
Data Table on Colombia - Market size and forecast 2025-2030 ($ million)
Chart on Colombia - Year-over-year growth 2025-2030 (%)
Data Table on Colombia - Year-over-year growth 2025-2030 (%)

12.6.8 Israel - Market size and forecast 2025-2030

Chart on Israel - Market size and forecast 2025-2030 ($ million)
Data Table on Israel - Market size and forecast 2025-2030 ($ million)
Chart on Israel - Year-over-year growth 2025-2030 (%)
Data Table on Israel - Year-over-year growth 2025-2030 (%)

12.7 Market opportunity by geography

Market opportunity by geography ($ million)
Data Tables on Market opportunity by geography ($ million)

13. Drivers, Challenges, and Opportunity

13.1 Market drivers

Aging demographics and rising prevalence of edentulism
Proliferation of clear aligners and removable orthodontic appliances
Consumer shift toward waterless formulations and eco-friendly packaging

13.2 Market challenges

Regulatory scrutiny and chemical safety compliance regarding persulfate compounds
Moisture sensitivity and packaging sustainability mandates
Raw material volatility and supply chain pressures in active cleansing ingredients

13.3 Impact of drivers and challenges

Impact of drivers and challenges in 2025 and 2030

13.4 Market opportunities

Transition toward clean-label ingredients and persulfate-free formulations
Repositioning toward clear aligners, retainers, and nightguard hygiene
Adoption of plastic-free, circular, and waterless sustainable packaging

14. Competitive Landscape

14.1 Overview

14.2

Overview on criticality of inputs and factors of differentiation

14.3 Landscape disruption

Overview on factors of disruption

14.4 Industry risks

Impact of key risks on business

15. Competitive Analysis

15.1 Companies profiled

Companies covered

15.2 Company ranking index

15.3 Market positioning of companies

Matrix on companies position and classification

15.4 Boots UK Ltd.

Boots UK Ltd. - Overview
Boots UK Ltd. - Product / Service
Boots UK Ltd. - Key offerings
SWOT

15.5 CVS Health Corp.

CVS Health Corp. - Overview
CVS Health Corp. - Business segments
CVS Health Corp. - Key offerings
CVS Health Corp. - Segment focus
SWOT

15.6 DUKAL Corp.

DUKAL Corp. - Overview
DUKAL Corp. - Product / Service
DUKAL Corp. - Key offerings
SWOT

15.7 Dynarex Corp.

Dynarex Corp. - Overview
Dynarex Corp. - Product / Service
Dynarex Corp. - Key offerings
SWOT

15.8 Fittydent International GmbH

Fittydent International GmbH - Overview
Fittydent International GmbH - Product / Service
Fittydent International GmbH - Key offerings
SWOT

15.9 Haleon Plc

Haleon Plc - Overview
Haleon Plc - Business segments
Haleon Plc - Key offerings
Haleon Plc - Segment focus
SWOT

15.10 J Sainsbury plc

J Sainsbury plc - Overview
J Sainsbury plc - Product / Service
J Sainsbury plc - Key offerings
SWOT

15.11 Lush Cosmetics Holdings Ltd.

Lush Cosmetics Holdings Ltd. - Overview
Lush Cosmetics Holdings Ltd. - Product / Service
Lush Cosmetics Holdings Ltd. - Key offerings
SWOT

15.12 McKesson Corp.

McKesson Corp. - Overview
McKesson Corp. - Business segments
McKesson Corp. - Key offerings
McKesson Corp. - Segment focus
SWOT

15.13 Medline Inc.

Medline Inc. - Overview
Medline Inc. - Product / Service
Medline Inc. - Key news
Medline Inc. - Key offerings
SWOT

15.14 Perrigo Co. Plc

Perrigo Co. Plc - Overview
Perrigo Co. Plc - Business segments
Perrigo Co. Plc - Key offerings
Perrigo Co. Plc - Segment focus
SWOT

15.15 Prestige Consumer Healthcare

Prestige Consumer Healthcare - Overview
Prestige Consumer Healthcare - Product / Service
Prestige Consumer Healthcare - Key offerings
SWOT

15.16 Reckitt Benckiser Group Plc

Reckitt Benckiser Group Plc - Overview
Reckitt Benckiser Group Plc - Business segments
Reckitt Benckiser Group Plc - Key offerings
Reckitt Benckiser Group Plc - Segment focus
SWOT

15.17 Tower Laboratories Ltd.

Tower Laboratories Ltd. - Overview
Tower Laboratories Ltd. - Product / Service
Tower Laboratories Ltd. - Key offerings
SWOT

15.18 Vive Health

Vive Health - Overview
Vive Health - Product / Service
Vive Health - Key offerings
SWOT

16. Appendix

16.1 Scope of the report

Market definition
Objectives
Notes and caveats

16.2 Inclusions and exclusions checklist

Inclusions checklist
Exclusions checklist

16.3 Currency conversion rates for US$

16.4 Research methodology

16.5 Data procurement

Information sources

16.6 Data validation

16.7 Validation techniques employed for market sizing

16.8 Data synthesis

16.9 360 degree market analysis

16.10 List of abbreviations

Research Methodology

Technavio presents a detailed picture of the market by way of study, synthesis, and summation of data from multiple sources. The analysts have presented the various facets of the market with a particular focus on identifying the key industry influencers. The data thus presented is comprehensive, reliable, and the result of extensive research, both primary and secondary.

INFORMATION SOURCES

Primary sources

  • Manufacturers and suppliers
  • Channel partners
  • Industry experts
  • Strategic decision makers

Secondary sources

  • Industry journals and periodicals
  • Government data
  • Financial reports of key industry players
  • Historical data
  • Press releases

DATA ANALYSIS

Data Synthesis

  • Collation of data
  • Estimation of key figures
  • Analysis of derived insights

Data Validation

  • Triangulation with data models
  • Reference against proprietary databases
  • Corroboration with industry experts

REPORT WRITING

Qualitative

  • Market drivers
  • Market challenges
  • Market trends
  • Five forces analysis

Quantitative

  • Market size and forecast
  • Market segmentation
  • Geographical insights
  • Competitive landscape

Interested in this report?

Get your sample now to see our research methodology and insights!

Download Now

Frequently Asked Questions

Dental Cleansing Tablet market growth will increase by USD 657.7 million during 2026-2030.

The Dental Cleansing Tablet market is expected to grow at a CAGR of 7% during 2026-2030.

Dental Cleansing Tablet market is segmented by Distribution channel (Offline, Online) Product (Denture cleansing tablet, Toothpaste tablet) Product type (Whitening tablet, Effervescent tablets, Antibacterial tablets, Fluoride tablets, Others)

Boots UK Ltd., CVS Health Corp., DUKAL Corp., Dynarex Corp., Fittydent International GmbH, Haleon Plc, IPCA Health Products Ltd., J Sainsbury plc, Lush Cosmetics Holdings Ltd., McKesson Corp., Medline Inc., Perrigo Co. Plc, Prestige Consumer Healthcare, Reckitt Benckiser Group Plc, Tower Laboratories Ltd., Vive Health are a few of the key vendors in the Dental Cleansing Tablet market.

North America will register the highest growth rate of 34.4% among the other regions. Therefore, the Dental Cleansing Tablet market in North America is expected to garner significant business opportunities for the vendors during the forecast period.

US, Canada, Mexico, Germany, UK, Italy, France, Spain, The Netherlands, China, Japan, India, South Korea, Indonesia, Thailand, Brazil, Saudi Arabia, UAE, South Africa, Argentina, Turkey, Colombia, Israel

  • Aging demographics and rising prevalence of edentulism is the driving factor this market.

The Dental Cleansing Tablet market vendors should focus on grabbing business opportunities from the Distribution channel segment as it accounted for the largest market share in the base year.
RIA - Research AI Assistant
Ask RIA