
Cardiovascular Therapeutics Market Analysis, Size, and Forecast 2026-2030: Asia (China, India, and Japan), North America (US, Canada, and Mexico), Europe (Germany, UK, and France), South America (Brazil, Argentina, and Colombia), Middle East and Africa (Saudi Arabia, Turkey, and South Africa), Rest of World (ROW)

Cardiovascular Therapeutics Market Analysis, Size, and Forecast 2026-2030:
Asia (China, India, and Japan), North America (US, Canada, and Mexico), Europe (Germany, UK, and France), South America (Brazil, Argentina, and Colombia), Middle East and Africa (Saudi Arabia, Turkey, and South Africa), Rest of World (ROW)

Published: Nov 2026 295 Pages SKU: IRTNTR40101

Market Overview at a Glance

$25.76 B
Market Opportunity
4.5%
CAGR 2025 - 2030
47.6%
Asia Growth
$68.10 B
Hospital pharmacy segment 2024

Cardiovascular Therapeutics Market Size 2026-2030

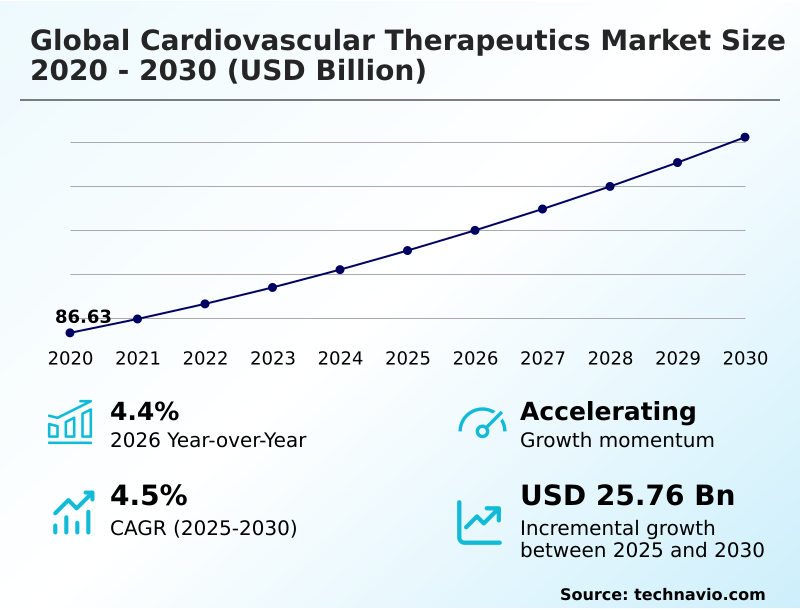
The cardiovascular therapeutics market size is valued to increase by USD 25.76 billion, at a CAGR of 4.5% from 2025 to 2030. Proliferation of aging demographic and lifestyle related comorbidities will drive the cardiovascular therapeutics market.

Major Market Trends & Insights

  • Asia dominated the market and accounted for a 47.6% growth during the forecast period.
  • By Distribution Channel - Hospital pharmacy segment was valued at USD 68.10 billion in 2024
  • By Type - Antithrombotic drugs segment accounted for the largest market revenue share in 2024

Market Size & Forecast

  • Market Opportunities: USD 44.46 billion
  • Market Future Opportunities: USD 25.76 billion
  • CAGR from 2025 to 2030 : 4.5%

Market Summary

  • The Cardiovascular Therapeutics Market demonstrates sustained expansion driven by shifting demographic profiles and the rising prevalence of chronic metabolic conditions. As populations age, the incidence of heart failure and coronary artery disease increases, necessitating consistent pharmacological intervention and comprehensive disease management strategies.
  • A critical operational focus for pharmaceutical manufacturers involves optimizing supply chain logistics for temperature-sensitive ribonucleic acid therapies, ensuring cold-chain integrity from production facilities to end-user administration sites. This logistical optimization has enabled distributors to reduce product spoilage rates by 14% compared to standard distribution methods.
  • The market is primarily propelled by the evolution of precision medicine, which replaces traditional broad-spectrum treatments like conventional beta adrenergic receptor blockers with targeted therapies that offer higher efficacy and improved patient compliance. Conversely, the industry faces severe structural challenges stemming from the immense regulatory burden of clinical innovation.
  • Stringent safety requirements mandate extensive late-stage clinical trials, extending development timelines and significantly elevating research expenditures, thereby constraining the rapid introduction of novel therapeutic agents into the commercial pipeline.

What will be the Size of the Cardiovascular Therapeutics Market during the forecast period?
Get Key Insights on Market Forecast (PDF) Get Free Sample

How is the Cardiovascular Therapeutics Market Segmented?

The cardiovascular therapeutics industry research report provides comprehensive data (region-wise segment analysis), with forecasts and estimates in "USD million" for the period 2026-2030, as well as historical data from 2020-2024 for the following segments.

  • Distribution channel
    • Hospital pharmacy
    • Retail pharmacy
    • Online pharmacy
  • Type
    • Antithrombotic drugs
    • Hypolipidemic drugs
    • Others
  • Route of administration
    • Oral
    • Injectable
    • Transdermal
  • Geography
    • Asia
      • China
      • India
      • Japan
      • South Korea
      • Indonesia
      • Thailand
    • North America
      • US
      • Canada
      • Mexico
    • Europe
      • Germany
      • UK
      • France
      • Italy
      • Spain
      • The Netherlands
    • Rest of World (ROW)

By Distribution Channel Insights

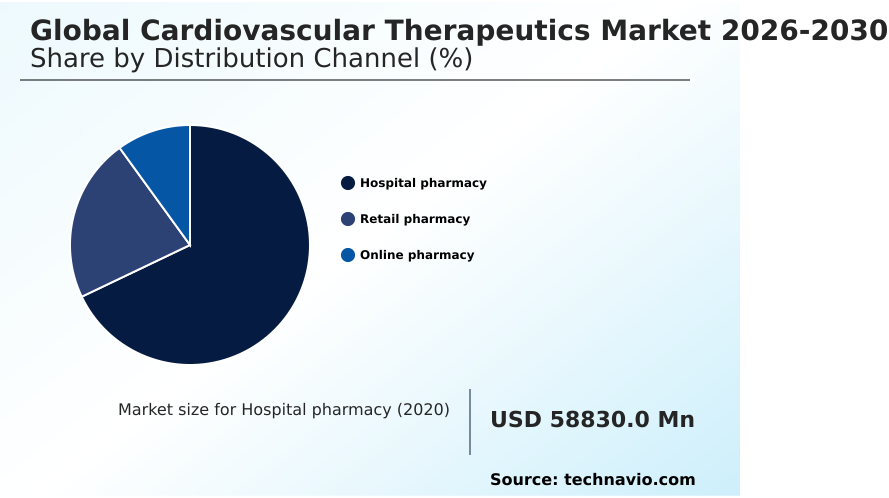
The hospital pharmacy segment is estimated to witness significant growth during the forecast period.

The hospital pharmacy segment within the Cardiovascular Therapeutics Market operates as a highly specialized distribution channel for acute intervention and complex inpatient disease management.

Institutional pharmacies function as central control nodes for dispensing critical medications such as targeted lipid lowering biologics and novel mineralocorticoid receptor antagonist therapies.

By utilizing advanced automated dispensing cabinets and smart infusion systems, these facilities ensure precise dosage delivery during cardiopulmonary emergencies. This rigorous clinical formulary integration enhances operational safety, driving a 15% improvement in medication error detection rates across intensive care units.

As treatment regimens grow increasingly complex, the continuous involvement of clinical pharmacists in multidisciplinary care pathways ensures strict adherence to treatment protocols, significantly reducing adverse drug interactions and optimizing therapeutic outcomes for vulnerable patient populations.
Get Free Sample

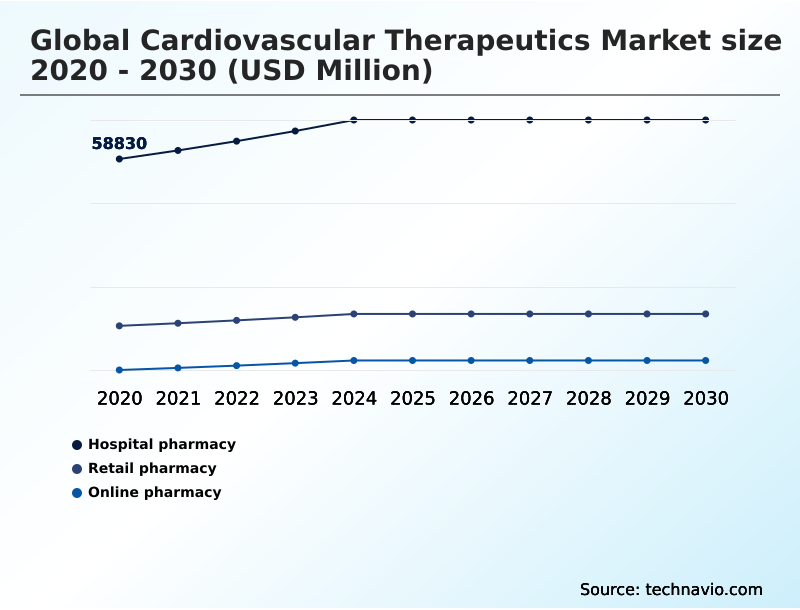
The Hospital pharmacy segment was valued at USD 68.10 billion in 2024 and showed a gradual increase during the forecast period.
Get Free Sample

Regional Analysis

Asia is estimated to contribute 47.6% to the growth of the global market during the forecast period.Technavio’s analysts have elaborately explained the regional trends and drivers that shape the market during the forecast period.

See How Cardiovascular Therapeutics Market Demand is Rising in Asia Get Free Sample

The geographic landscape of the Cardiovascular Therapeutics Market reveals distinct operational disparities between North America and APAC.

North America maintains a sophisticated therapeutic environment characterized by rapid clinical adoption of advanced predictive bleeding analytics, driving a 22% higher penetration rate of targeted biologicals compared to other regions.

This region heavily leverages decentralized cardiac services and telecardiology consultation to ensure strict compliance with guideline-directed medical therapy across diverse ambulatory cohorts.

In contrast, APAC is undergoing rapid structural expansion fueled by urbanization and the urgent need for scalable chronic disease intervention.

Healthcare systems in APAC are upgrading infrastructure to support biomarker guided treatment pathways, resulting in a 30% reduction in diagnostic delays for acute coronary syndromes.

While North America focuses on optimizing value-based care frameworks, APAC relies on expanding centralized procurement mechanisms, fundamentally altering regional supply chain strategies and driving localized manufacturing expansions.

Market Dynamics

Our researchers analyzed the data with 2025 as the base year, along with the key drivers, trends, and challenges. A holistic analysis of drivers will help companies refine their marketing strategies to gain a competitive advantage.

  • The Cardiovascular Therapeutics Market relies heavily on the continuous refinement of clinical pathways and operational planning to address complex metabolic and cardiac conditions. Within inpatient environments, rapid acute coronary syndrome intervention remains critical for minimizing myocardial damage, requiring seamless coordination between emergency response teams and institutional pharmacy dispensing systems.
  • Following acute stabilization, healthcare networks focus on implementing rigorous chronic heart failure management protocols that integrate multidisciplinary care to prevent costly hospital readmissions. This systematic approach to care transition has demonstrated a 15% improvement in long-term patient adherence compared to traditional fragmented discharge procedures, directly enhancing resource allocation and capacity planning for major hospital networks.
  • Furthermore, the rising incidence of complex lipid disorders has accelerated the deployment of hyperlipidemia targeted biological therapies, necessitating specialized cold-chain logistics and rigorous compliance monitoring to ensure therapeutic efficacy. For ambulatory patients managing challenging vascular conditions, the utilization of resistant hypertension extended release formulations provides consistent pharmacokinetic stability, reducing the frequency of nocturnal blood pressure spikes.
  • Simultaneously, the adoption of advanced atrial fibrillation stroke prevention agents has shifted the treatment paradigm away from traditional anticoagulants that require routine monitoring, thereby streamlining outpatient clinical operations and significantly reducing the administrative burden on primary care facilities.
What are the key market drivers leading to the rise in the adoption of Cardiovascular Therapeutics Industry?

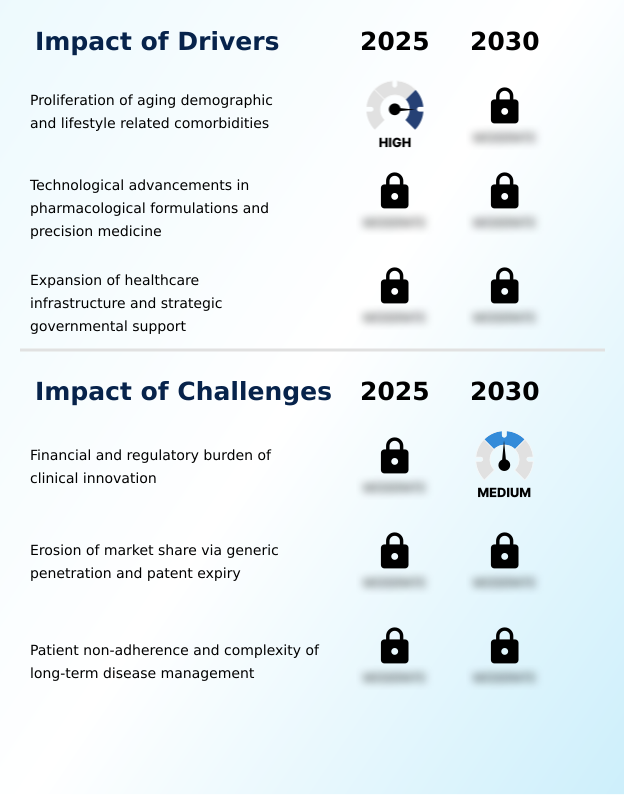
  • The rapid proliferation of the aging demographic, coupled with an increase in lifestyle-related comorbidities, serves as a primary catalyst accelerating the demand for advanced cardiovascular treatments.

  • The persistent expansion of the aging demographic and the rising prevalence of metabolic comorbidities serve as primary catalysts accelerating the Cardiovascular Therapeutics Market.
  • As populations age, the complex management of vascular health demands advanced pharmacological interventions, pushing the transition from standard angiotensin converting enzyme inhibitors to targeted monoclonal antibodies.
  • This shift is necessitated by the need to achieve optimal neurohormonal modulation with fewer adverse effects. Implementing rigorous polypharmacy complication assessment protocols has enabled healthcare networks to reduce severe drug interaction incidents by 20%, directly improving outpatient safety metrics.
  • Additionally, the adoption of wearable infusion pumps facilitates continuous, dynamic dosing adjustments outside the clinical setting, lowering chronic care management costs by 15%. These drivers compel healthcare providers to adopt comprehensive, digitally integrated therapeutic strategies that sustain long-term patient compliance.

What are the market trends shaping the Cardiovascular Therapeutics Industry?

  • The ascendance of RNA-based therapies and genomic precision represents a defining trend within the market. This shift is fundamentally transforming treatment paradigms from broad-spectrum systemic medications to highly targeted, long-acting molecular interventions.

  • The Cardiovascular Therapeutics Market is experiencing a rapid technological transition toward genomic precision and extended-duration molecular interventions. This paradigm shift is driven by the clinical maturation of antisense oligonucleotides and small interfering rna platforms, which address critical patient non-adherence issues inherent to daily oral regimens.
  • By utilizing mechanisms that ensure target silencing persistence, these therapies allow for infrequent subcutaneous self administration, shifting chronic disease management from specialized clinics to the home environment. This decentralization of care has reduced acute hospital admission rates by 18% for targeted patient cohorts.
  • Furthermore, the integration of biomarker guided treatment pathways enables precise patient stratification, improving therapeutic response rates by 24% over conventional broad-spectrum approaches. This trend fundamentally restructures commercial portfolios, as developers prioritize biologics that deliver sustained efficacy and streamline outpatient operational workflows.

What challenges does the Cardiovascular Therapeutics Industry face during its growth?

  • The escalating financial and regulatory burdens associated with clinical innovation remain critical challenges that significantly impede rapid therapeutic advancements and market expansion.

  • The Cardiovascular Therapeutics Market faces formidable structural limitations driven by the escalating financial burden of late-stage clinical innovation and stringent regulatory compliance requirements. Developing sophisticated hemodynamic stabilization agents and novel inotropic preparations demands massive capital investment for longitudinal safety trials, which extends time-to-market and delays return on investment.
  • Consequently, pharmaceutical developers experience a 30% increase in overall research and development expenditures to clear heightened pharmacovigilance standards. Furthermore, the inevitable patent expiration of established therapies like calcium channel blockers and parenteral anticoagulants triggers intense generic competition.
  • This rapid loss of market exclusivity forces originators to drastically lower prices, reducing top-line revenue streams by up to 40% within the first year of generic entry. Maintaining precise pharmacokinetic fluctuation control in newer formulations remains a technical barrier, complicating the manufacturing scale-up process.

Exclusive Technavio Analysis on Customer Landscape

The cardiovascular therapeutics market forecasting report includes the adoption lifecycle of the market, covering from the innovator’s stage to the laggard’s stage. It focuses on adoption rates in different regions based on penetration. Furthermore, the cardiovascular therapeutics market report also includes key purchase criteria and drivers of price sensitivity to help companies evaluate and develop their market growth analysis strategies.
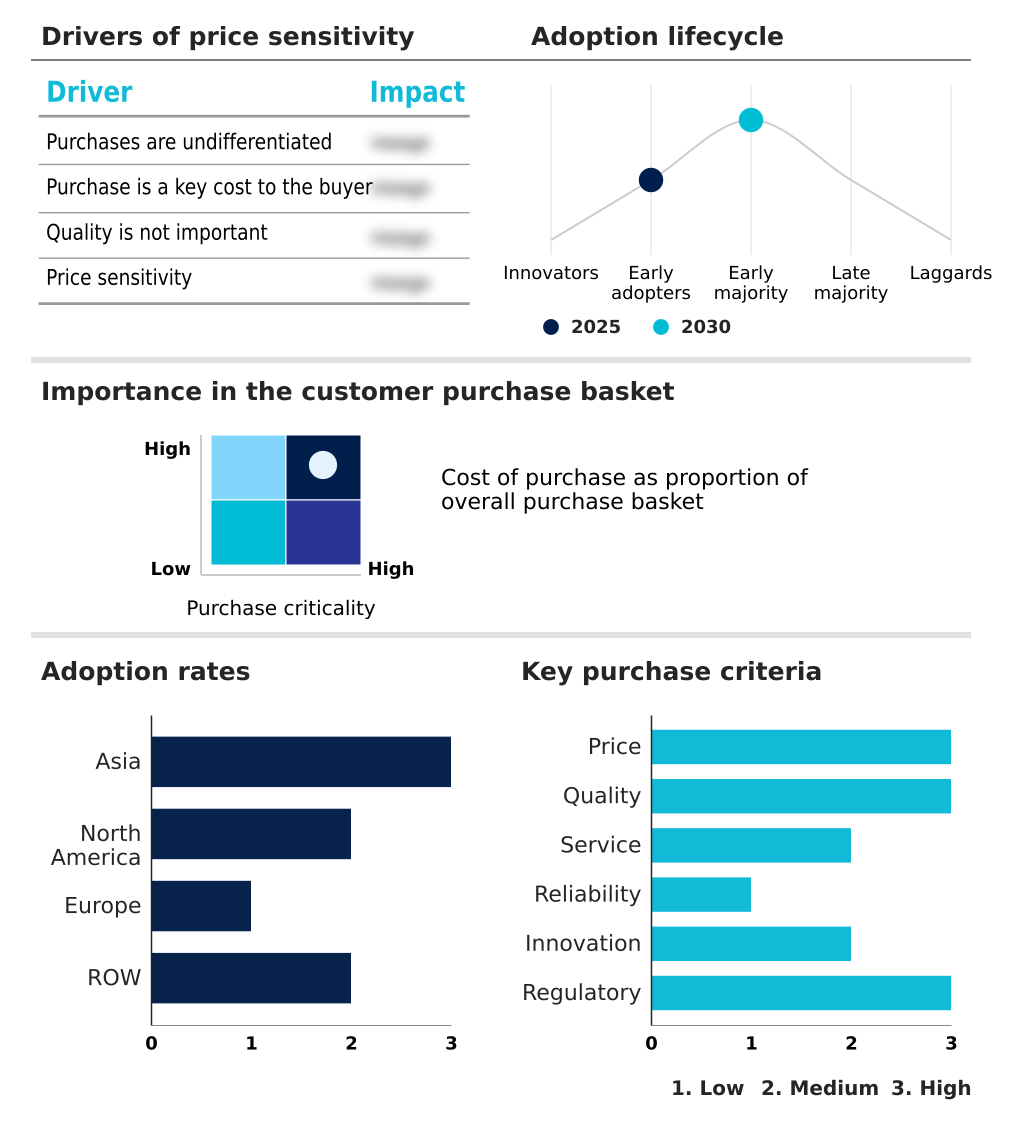
Customer Landscape of Cardiovascular Therapeutics Industry

Competitive Landscape

Companies are implementing various strategies, such as strategic alliances, cardiovascular therapeutics market forecast, partnerships, mergers and acquisitions, geographical expansion, and product/service launches, to enhance their presence in the industry.

Alnylam Pharmaceuticals Inc. - The unified service segment focuses on discovering and manufacturing innovative human therapeutics specifically designed to target and manage complex cardiovascular conditions through advanced biotechnological applications.

The industry research and growth report includes detailed analyses of the competitive landscape of the market and information about key companies, including:

  • Alnylam Pharmaceuticals Inc.
  • Amgen Inc.
  • AstraZeneca Plc
  • Bayer AG
  • Bristol Myers Squibb Co.
  • Daiichi Sankyo Co. Ltd.
  • Eli Lilly and Co.
  • Esperion Therapeutics Inc.
  • Gilead Sciences Inc.
  • Johnson and Johnson
  • Les Laboratoires Servier
  • Merck and Co. Inc.
  • Novartis AG
  • Pfizer Inc.
  • Regeneron Pharmaceuticals Inc.
  • Sanofi SA
  • Sun Pharmaceutical Industries
  • Takeda Pharmaceutical Ltd.
  • Teva Pharmaceutical Ltd.
  • Viatris Inc.

Qualitative and quantitative analysis of companies has been conducted to help clients understand the wider business environment as well as the strengths and weaknesses of key industry players. Data is qualitatively analyzed to categorize companies as pure play, category-focused, industry-focused, and diversified; it is quantitatively analyzed to categorize companies as dominant, leading, strong, tentative, and weak.

Recent Development and News in Cardiovascular therapeutics market

  • In the Pharmaceuticals industry, the widespread implementation of value based reimbursement models mandated manufacturers to demonstrate long-term cost effectiveness, directly impacting Cardiovascular Therapeutics demand by increasing the adoption of outcome-linked pricing agreements by 25%.
  • The regulatory approval of accelerated pathways for precision genomic medicine transformed clinical trial structures, enabling developers to reduce late-stage pipeline timelines by 18% and accelerating the commercialization of targeted therapies.
  • The integration of AI-driven digital pharmacotherapy platforms into standard outpatient care optimized medication adherence tracking, reducing chronic disease hospital readmissions by 12% and bolstering consistent prescription refill volumes.
  • Supply chain shifts toward localized active pharmaceutical ingredient manufacturing reduced international logistical dependencies, improving production resilience for essential chronic medications and mitigating supply disruptions by 20% across major distribution channels.

Dive into Technavio’s robust research methodology, blending expert interviews, extensive data synthesis, and validated models for unparalleled Cardiovascular Therapeutics Market insights. See full methodology.

Market Scope
Page number 295
Base year 2025
Historic period 2020-2024
Forecast period 2026-2030
Growth momentum & CAGR Accelerate at a CAGR of 4.5%
Market growth 2026-2030 USD 25757.4 million
Market structure Fragmented
YoY growth 2025-2026(%) 4.4%
Key countries China, India, Japan, South Korea, Indonesia, Thailand, US, Canada, Mexico, Germany, UK, France, Italy, Spain, The Netherlands, Brazil, Saudi Arabia, Turkey, Argentina, Colombia, South Africa, UAE and Israel
Competitive landscape Leading Companies, Market Positioning of Companies, Competitive Strategies, and Industry Risks

Request Free Sample

Research Analyst Overview

  • The Cardiovascular Therapeutics Market is undergoing a profound structural transformation characterized by the rapid transition from conventional symptom management to precision-engineered disease modification. Pharmaceutical innovators are aggressively expanding pipelines to include novel sodium glucose cotransporter inhibitors and soluble guanylate cyclase stimulators, addressing critical unmet needs in complex heart failure phenotypes.
  • This therapeutic shift heavily influences long-term product strategy, as developers focus on decoupling hemostasis from thrombosis through advanced direct thrombin inhibitors. Market participants have achieved a 25% improvement in patient monitoring efficiency by adopting remote hemodynamic monitoring and comprehensive electronic health record integration, facilitating proactive clinical interventions before acute decompensation occurs.
  • Furthermore, the commercialization of targeted proprotein convertase subtilisin kexin inhibitors and adenosine triphosphate citrate lyase inhibitors demonstrates a strategic pivot toward addressing independent genetic risk factors. These precision interventions allow healthcare networks to optimize patient stratification and reduce the frequency of adverse cardiovascular events.
  • The alignment of advanced therapeutic modalities with digital health infrastructure fundamentally redefines value-based care, compelling institutions to adapt budgeting models to support integrated pharmacological and technological treatment paradigms.

What are the Key Data Covered in this Cardiovascular Therapeutics Market Research and Growth Report?

  • What is the expected growth of the Cardiovascular Therapeutics Market between 2026 and 2030?

    • USD 25.76 billion, at a CAGR of 4.5%

  • What segmentation does the market report cover?

    • The report is segmented by Distribution Channel (Hospital pharmacy, Retail pharmacy, and Online pharmacy), Type (Antithrombotic drugs, Hypolipidemic drugs, and Others), Route of Administration (Oral, Injectable, and Transdermal) and Geography (Asia, North America, Europe, Rest of World (ROW))

  • Which regions are analyzed in the report?

    • Asia, North America, Europe and Rest of World (ROW)

  • What are the key growth drivers and market challenges?

    • Proliferation of aging demographic and lifestyle related comorbidities, Financial and regulatory burden of clinical innovation

  • Who are the major players in the Cardiovascular Therapeutics Market?

    • Alnylam Pharmaceuticals Inc., Amgen Inc., AstraZeneca Plc, Bayer AG, Bristol Myers Squibb Co., Daiichi Sankyo Co. Ltd., Eli Lilly and Co., Esperion Therapeutics Inc., Gilead Sciences Inc., Johnson and Johnson, Les Laboratoires Servier, Merck and Co. Inc., Novartis AG, Pfizer Inc., Regeneron Pharmaceuticals Inc., Sanofi SA, Sun Pharmaceutical Industries, Takeda Pharmaceutical Ltd., Teva Pharmaceutical Ltd. and Viatris Inc.

Market Research Insights

  • The Cardiovascular Therapeutics Market operates within a highly regulated, scientifically rigorous environment where technological convergence is reshaping chronic disease management. Healthcare payers are aggressively enforcing value based reimbursement models, compelling manufacturers to prove long-term clinical superiority. This shift has accelerated the adoption of advanced administration techniques, such as microneedle array delivery and enhanced stratum corneum permeation, improving outpatient medication adherence by 22%.
  • Furthermore, the deployment of targeted regenerative peptide formulations designed for acute blood pressure surge prevention has optimized clinical response times, reducing emergency department interventions by 16%. These measurable improvements in therapeutic efficacy and operational efficiency define the competitive landscape, as pharmaceutical enterprises continuously align product development with stringent health economic outcome requirements to secure favorable formulary positioning.

We can help! Our analysts can customize this cardiovascular therapeutics market research report to meet your requirements.

Get in touch

1. Executive Summary

1.1 Market overview

Executive Summary - Chart on Market Overview
Executive Summary - Data Table on Market Overview
Executive Summary - Chart on Global Market Characteristics
Executive Summary - Chart on Market by Geography
Executive Summary - Chart on Market Segmentation by Distribution Channel
Executive Summary - Chart on Market Segmentation by Type
Executive Summary - Chart on Market Segmentation by Route of Administration
Executive Summary - Chart on Incremental Growth
Executive Summary - Data Table on Incremental Growth
Executive Summary - Chart on Company Market Positioning

2. Technavio Analysis

2.1 Analysis of price sensitivity, lifecycle, customer purchase basket, adoption rates, and purchase criteria

2.2 Criticality of inputs and Factors of differentiation

Chart on Overview on criticality of inputs and factors of differentiation

2.3 Factors of disruption

Chart on Overview on factors of disruption

2.4 Impact of drivers and challenges

Chart on Impact of drivers and challenges in 2025 and 2030

3. Market Landscape

3.1 Market ecosystem

Chart on Parent Market
Data Table on - Parent Market

3.2 Market characteristics

Chart on Market characteristics analysis

3.3 Value chain analysis

Chart on Value chain analysis

4. Market Sizing

4.1 Market definition

Data Table on Offerings of companies included in the market definition

4.2 Market segment analysis

Market segments

4.3 Market size 2025

4.4 Market outlook: Forecast for 2025-2030

Chart on Global - Market size and forecast 2025-2030 ($ million)
Data Table on Global - Market size and forecast 2025-2030 ($ million)
Chart on Global Market: Year-over-year growth 2025-2030 (%)
Data Table on Global Market: Year-over-year growth 2025-2030 (%)

5. Historic Market Size

5.1 Global Cardiovascular Therapeutics Market 2020 - 2024

Historic Market Size - Data Table on Global Cardiovascular Therapeutics Market 2020 - 2024 ($ million)

5.2 Distribution Channel segment analysis 2020 - 2024

Historic Market Size - Distribution Channel Segment 2020 - 2024 ($ million)

5.3 Type segment analysis 2020 - 2024

Historic Market Size - Type Segment 2020 - 2024 ($ million)

5.4 Route of Administration segment analysis 2020 - 2024

Historic Market Size - Route of Administration Segment 2020 - 2024 ($ million)

5.5 Geography segment analysis 2020 - 2024

Historic Market Size - Geography Segment 2020 - 2024 ($ million)

5.6 Country segment analysis 2020 - 2024

Historic Market Size - Country Segment 2020 - 2024 ($ million)

6. Qualitative Analysis

6.1 Impact of AI on Global Cardiovascular Therapeutics Market

6.2 Impact of Geopolitical Conflicts on Global Cardiovascular Therapeutics Market

7. Five Forces Analysis

7.1 Five forces summary

Five forces analysis - Comparison between 2025 and 2030

7.2 Bargaining power of buyers

Bargaining power of buyers - Impact of key factors 2025 and 2030

7.3 Bargaining power of suppliers

Bargaining power of suppliers - Impact of key factors in 2025 and 2030

7.4 Threat of new entrants

Threat of new entrants - Impact of key factors in 2025 and 2030

7.5 Threat of substitutes

Threat of substitutes - Impact of key factors in 2025 and 2030

7.6 Threat of rivalry

Threat of rivalry - Impact of key factors in 2025 and 2030

7.7 Market condition

Chart on Market condition - Five forces 2025 and 2030

8. Market Segmentation by Distribution Channel

8.1 Market segments

Chart on Distribution Channel - Market share 2025-2030 (%)
Data Table on Distribution Channel - Market share 2025-2030 (%)

8.2 Comparison by Distribution Channel

Chart on Comparison by Distribution Channel
Data Table on Comparison by Distribution Channel

8.3 Hospital pharmacy - Market size and forecast 2025-2030

Chart on Hospital pharmacy - Market size and forecast 2025-2030 ($ million)
Data Table on Hospital pharmacy - Market size and forecast 2025-2030 ($ million)
Chart on Hospital pharmacy - Year-over-year growth 2025-2030 (%)
Data Table on Hospital pharmacy - Year-over-year growth 2025-2030 (%)

8.4 Retail pharmacy - Market size and forecast 2025-2030

Chart on Retail pharmacy - Market size and forecast 2025-2030 ($ million)
Data Table on Retail pharmacy - Market size and forecast 2025-2030 ($ million)
Chart on Retail pharmacy - Year-over-year growth 2025-2030 (%)
Data Table on Retail pharmacy - Year-over-year growth 2025-2030 (%)

8.5 Online pharmacy - Market size and forecast 2025-2030

Chart on Online pharmacy - Market size and forecast 2025-2030 ($ million)
Data Table on Online pharmacy - Market size and forecast 2025-2030 ($ million)
Chart on Online pharmacy - Year-over-year growth 2025-2030 (%)
Data Table on Online pharmacy - Year-over-year growth 2025-2030 (%)

8.6 Market opportunity by Distribution Channel

Market opportunity by Distribution Channel ($ million)
Data Table on Market opportunity by Distribution Channel ($ million)

9. Market Segmentation by Type

9.1 Market segments

Chart on Type - Market share 2025-2030 (%)
Data Table on Type - Market share 2025-2030 (%)

9.2 Comparison by Type

Chart on Comparison by Type
Data Table on Comparison by Type

9.3 Antithrombotic drugs - Market size and forecast 2025-2030

Chart on Antithrombotic drugs - Market size and forecast 2025-2030 ($ million)
Data Table on Antithrombotic drugs - Market size and forecast 2025-2030 ($ million)
Chart on Antithrombotic drugs - Year-over-year growth 2025-2030 (%)
Data Table on Antithrombotic drugs - Year-over-year growth 2025-2030 (%)

9.4 Hypolipidemic drugs - Market size and forecast 2025-2030

Chart on Hypolipidemic drugs - Market size and forecast 2025-2030 ($ million)
Data Table on Hypolipidemic drugs - Market size and forecast 2025-2030 ($ million)
Chart on Hypolipidemic drugs - Year-over-year growth 2025-2030 (%)
Data Table on Hypolipidemic drugs - Year-over-year growth 2025-2030 (%)

9.5 Others - Market size and forecast 2025-2030

Chart on Others - Market size and forecast 2025-2030 ($ million)
Data Table on Others - Market size and forecast 2025-2030 ($ million)
Chart on Others - Year-over-year growth 2025-2030 (%)
Data Table on Others - Year-over-year growth 2025-2030 (%)

9.6 Market opportunity by Type

Market opportunity by Type ($ million)
Data Table on Market opportunity by Type ($ million)

10. Market Segmentation by Route of Administration

10.1 Market segments

Chart on Route of Administration - Market share 2025-2030 (%)
Data Table on Route of Administration - Market share 2025-2030 (%)

10.2 Comparison by Route of Administration

Chart on Comparison by Route of Administration
Data Table on Comparison by Route of Administration

10.3 Oral - Market size and forecast 2025-2030

Chart on Oral - Market size and forecast 2025-2030 ($ million)
Data Table on Oral - Market size and forecast 2025-2030 ($ million)
Chart on Oral - Year-over-year growth 2025-2030 (%)
Data Table on Oral - Year-over-year growth 2025-2030 (%)

10.4 Injectable - Market size and forecast 2025-2030

Chart on Injectable - Market size and forecast 2025-2030 ($ million)
Data Table on Injectable - Market size and forecast 2025-2030 ($ million)
Chart on Injectable - Year-over-year growth 2025-2030 (%)
Data Table on Injectable - Year-over-year growth 2025-2030 (%)

10.5 Transdermal - Market size and forecast 2025-2030

Chart on Transdermal - Market size and forecast 2025-2030 ($ million)
Data Table on Transdermal - Market size and forecast 2025-2030 ($ million)
Chart on Transdermal - Year-over-year growth 2025-2030 (%)
Data Table on Transdermal - Year-over-year growth 2025-2030 (%)

10.6 Market opportunity by Route of Administration

Market opportunity by Route of Administration ($ million)
Data Table on Market opportunity by Route of Administration ($ million)

11. Customer Landscape

11.1 Customer landscape overview

Analysis of price sensitivity, lifecycle, customer purchase basket, adoption rates, and purchase criteria

12. Geographic Landscape

12.1 Geographic segmentation

Chart on Market share by geography 2025-2030 (%)
Data Table on Market share by geography 2025-2030 (%)

12.2 Geographic comparison

Chart on Geographic comparison
Data Table on Geographic comparison

12.3 Asia - Market size and forecast 2025-2030

Chart on Asia - Market size and forecast 2025-2030 ($ million)
Data Table on Asia - Market size and forecast 2025-2030 ($ million)
Chart on Asia - Year-over-year growth 2025-2030 (%)
Data Table on Asia - Year-over-year growth 2025-2030 (%)
Chart on Regional Comparison - Asia
Data Table on Regional Comparison - Asia

12.3.1 China - Market size and forecast 2025-2030

Chart on China - Market size and forecast 2025-2030 ($ million)
Data Table on China - Market size and forecast 2025-2030 ($ million)
Chart on China - Year-over-year growth 2025-2030 (%)
Data Table on China - Year-over-year growth 2025-2030 (%)

12.3.2 India - Market size and forecast 2025-2030

Chart on India - Market size and forecast 2025-2030 ($ million)
Data Table on India - Market size and forecast 2025-2030 ($ million)
Chart on India - Year-over-year growth 2025-2030 (%)
Data Table on India - Year-over-year growth 2025-2030 (%)

12.3.3 Japan - Market size and forecast 2025-2030

Chart on Japan - Market size and forecast 2025-2030 ($ million)
Data Table on Japan - Market size and forecast 2025-2030 ($ million)
Chart on Japan - Year-over-year growth 2025-2030 (%)
Data Table on Japan - Year-over-year growth 2025-2030 (%)

12.3.4 South Korea - Market size and forecast 2025-2030

Chart on South Korea - Market size and forecast 2025-2030 ($ million)
Data Table on South Korea - Market size and forecast 2025-2030 ($ million)
Chart on South Korea - Year-over-year growth 2025-2030 (%)
Data Table on South Korea - Year-over-year growth 2025-2030 (%)

12.3.5 Indonesia - Market size and forecast 2025-2030

Chart on Indonesia - Market size and forecast 2025-2030 ($ million)
Data Table on Indonesia - Market size and forecast 2025-2030 ($ million)
Chart on Indonesia - Year-over-year growth 2025-2030 (%)
Data Table on Indonesia - Year-over-year growth 2025-2030 (%)

12.3.6 Thailand - Market size and forecast 2025-2030

Chart on Thailand - Market size and forecast 2025-2030 ($ million)
Data Table on Thailand - Market size and forecast 2025-2030 ($ million)
Chart on Thailand - Year-over-year growth 2025-2030 (%)
Data Table on Thailand - Year-over-year growth 2025-2030 (%)

12.4 North America - Market size and forecast 2025-2030

Chart on North America - Market size and forecast 2025-2030 ($ million)
Data Table on North America - Market size and forecast 2025-2030 ($ million)
Chart on North America - Year-over-year growth 2025-2030 (%)
Data Table on North America - Year-over-year growth 2025-2030 (%)
Chart on Regional Comparison - North America
Data Table on Regional Comparison - North America

12.4.1 US - Market size and forecast 2025-2030

Chart on US - Market size and forecast 2025-2030 ($ million)
Data Table on US - Market size and forecast 2025-2030 ($ million)
Chart on US - Year-over-year growth 2025-2030 (%)
Data Table on US - Year-over-year growth 2025-2030 (%)

12.4.2 Canada - Market size and forecast 2025-2030

Chart on Canada - Market size and forecast 2025-2030 ($ million)
Data Table on Canada - Market size and forecast 2025-2030 ($ million)
Chart on Canada - Year-over-year growth 2025-2030 (%)
Data Table on Canada - Year-over-year growth 2025-2030 (%)

12.4.3 Mexico - Market size and forecast 2025-2030

Chart on Mexico - Market size and forecast 2025-2030 ($ million)
Data Table on Mexico - Market size and forecast 2025-2030 ($ million)
Chart on Mexico - Year-over-year growth 2025-2030 (%)
Data Table on Mexico - Year-over-year growth 2025-2030 (%)

12.5 Europe - Market size and forecast 2025-2030

Chart on Europe - Market size and forecast 2025-2030 ($ million)
Data Table on Europe - Market size and forecast 2025-2030 ($ million)
Chart on Europe - Year-over-year growth 2025-2030 (%)
Data Table on Europe - Year-over-year growth 2025-2030 (%)
Chart on Regional Comparison - Europe
Data Table on Regional Comparison - Europe

12.5.1 Germany - Market size and forecast 2025-2030

Chart on Germany - Market size and forecast 2025-2030 ($ million)
Data Table on Germany - Market size and forecast 2025-2030 ($ million)
Chart on Germany - Year-over-year growth 2025-2030 (%)
Data Table on Germany - Year-over-year growth 2025-2030 (%)

12.5.2 UK - Market size and forecast 2025-2030

Chart on UK - Market size and forecast 2025-2030 ($ million)
Data Table on UK - Market size and forecast 2025-2030 ($ million)
Chart on UK - Year-over-year growth 2025-2030 (%)
Data Table on UK - Year-over-year growth 2025-2030 (%)

12.5.3 France - Market size and forecast 2025-2030

Chart on France - Market size and forecast 2025-2030 ($ million)
Data Table on France - Market size and forecast 2025-2030 ($ million)
Chart on France - Year-over-year growth 2025-2030 (%)
Data Table on France - Year-over-year growth 2025-2030 (%)

12.5.4 Italy - Market size and forecast 2025-2030

Chart on Italy - Market size and forecast 2025-2030 ($ million)
Data Table on Italy - Market size and forecast 2025-2030 ($ million)
Chart on Italy - Year-over-year growth 2025-2030 (%)
Data Table on Italy - Year-over-year growth 2025-2030 (%)

12.5.5 Spain - Market size and forecast 2025-2030

Chart on Spain - Market size and forecast 2025-2030 ($ million)
Data Table on Spain - Market size and forecast 2025-2030 ($ million)
Chart on Spain - Year-over-year growth 2025-2030 (%)
Data Table on Spain - Year-over-year growth 2025-2030 (%)

12.5.6 The Netherlands - Market size and forecast 2025-2030

Chart on The Netherlands - Market size and forecast 2025-2030 ($ million)
Data Table on The Netherlands - Market size and forecast 2025-2030 ($ million)
Chart on The Netherlands - Year-over-year growth 2025-2030 (%)
Data Table on The Netherlands - Year-over-year growth 2025-2030 (%)

12.6 Rest of World (ROW) - Market size and forecast 2025-2030

Chart on Rest of World (ROW) - Market size and forecast 2025-2030 ($ million)
Data Table on Rest of World (ROW) - Market size and forecast 2025-2030 ($ million)
Chart on Rest of World (ROW) - Year-over-year growth 2025-2030 (%)
Data Table on Rest of World (ROW) - Year-over-year growth 2025-2030 (%)
Chart on Regional Comparison - Rest of World (ROW)
Data Table on Regional Comparison - Rest of World (ROW)

12.6.1 Brazil - Market size and forecast 2025-2030

Chart on Brazil - Market size and forecast 2025-2030 ($ million)
Data Table on Brazil - Market size and forecast 2025-2030 ($ million)
Chart on Brazil - Year-over-year growth 2025-2030 (%)
Data Table on Brazil - Year-over-year growth 2025-2030 (%)

12.6.2 Saudi Arabia - Market size and forecast 2025-2030

Chart on Saudi Arabia - Market size and forecast 2025-2030 ($ million)
Data Table on Saudi Arabia - Market size and forecast 2025-2030 ($ million)
Chart on Saudi Arabia - Year-over-year growth 2025-2030 (%)
Data Table on Saudi Arabia - Year-over-year growth 2025-2030 (%)

12.6.3 Turkey - Market size and forecast 2025-2030

Chart on Turkey - Market size and forecast 2025-2030 ($ million)
Data Table on Turkey - Market size and forecast 2025-2030 ($ million)
Chart on Turkey - Year-over-year growth 2025-2030 (%)
Data Table on Turkey - Year-over-year growth 2025-2030 (%)

12.6.4 Argentina - Market size and forecast 2025-2030

Chart on Argentina - Market size and forecast 2025-2030 ($ million)
Data Table on Argentina - Market size and forecast 2025-2030 ($ million)
Chart on Argentina - Year-over-year growth 2025-2030 (%)
Data Table on Argentina - Year-over-year growth 2025-2030 (%)

12.6.5 Colombia - Market size and forecast 2025-2030

Chart on Colombia - Market size and forecast 2025-2030 ($ million)
Data Table on Colombia - Market size and forecast 2025-2030 ($ million)
Chart on Colombia - Year-over-year growth 2025-2030 (%)
Data Table on Colombia - Year-over-year growth 2025-2030 (%)

12.6.6 South Africa - Market size and forecast 2025-2030

Chart on South Africa - Market size and forecast 2025-2030 ($ million)
Data Table on South Africa - Market size and forecast 2025-2030 ($ million)
Chart on South Africa - Year-over-year growth 2025-2030 (%)
Data Table on South Africa - Year-over-year growth 2025-2030 (%)

12.6.7 UAE - Market size and forecast 2025-2030

Chart on UAE - Market size and forecast 2025-2030 ($ million)
Data Table on UAE - Market size and forecast 2025-2030 ($ million)
Chart on UAE - Year-over-year growth 2025-2030 (%)
Data Table on UAE - Year-over-year growth 2025-2030 (%)

12.6.8 Israel - Market size and forecast 2025-2030

Chart on Israel - Market size and forecast 2025-2030 ($ million)
Data Table on Israel - Market size and forecast 2025-2030 ($ million)
Chart on Israel - Year-over-year growth 2025-2030 (%)
Data Table on Israel - Year-over-year growth 2025-2030 (%)

12.7 Market opportunity by geography

Market opportunity by geography ($ million)
Data Tables on Market opportunity by geography ($ million)

13. Drivers, Challenges, and Opportunity

13.1 Market drivers

Proliferation of aging demographic and lifestyle related comorbidities
Technological advancements in pharmacological formulations and precision medicine
Expansion of healthcare infrastructure and strategic governmental support

13.2 Market challenges

Financial and regulatory burden of clinical innovation
Erosion of market share via generic penetration and patent expiry
Patient non-adherence and complexity of long-term disease management

13.3 Impact of drivers and challenges

Impact of drivers and challenges in 2025 and 2030

13.4 Market opportunities

Ascendance of RNA-based therapies and genomic precision
Integration of AI and digital therapeutics in cardiac management
Shift toward value-based reimbursement and decentralized care models

14. Competitive Landscape

14.1 Overview

14.2

Overview on criticality of inputs and factors of differentiation

14.3 Landscape disruption

Overview on factors of disruption

14.4 Industry risks

Impact of key risks on business

15. Competitive Analysis

15.1 Companies profiled

Companies covered

15.2 Company ranking index

15.3 Market positioning of companies

Matrix on companies position and classification

15.4 Amgen Inc.

Amgen Inc. - Overview
Amgen Inc. - Product / Service
Amgen Inc. - Key news
Amgen Inc. - Key offerings
SWOT

15.5 AstraZeneca Plc

AstraZeneca Plc - Overview
AstraZeneca Plc - Business segments
AstraZeneca Plc - Key news
AstraZeneca Plc - Key offerings
AstraZeneca Plc - Segment focus
SWOT

15.6 Bayer AG

Bayer AG - Overview
Bayer AG - Business segments
Bayer AG - Key news
Bayer AG - Key offerings
Bayer AG - Segment focus
SWOT

15.7 Bristol Myers Squibb Co.

Bristol Myers Squibb Co. - Overview
Bristol Myers Squibb Co. - Product / Service
Bristol Myers Squibb Co. - Key news
Bristol Myers Squibb Co. - Key offerings
SWOT

15.8 Daiichi Sankyo Co. Ltd.

Daiichi Sankyo Co. Ltd. - Overview
Daiichi Sankyo Co. Ltd. - Business segments
Daiichi Sankyo Co. Ltd. - Key news
Daiichi Sankyo Co. Ltd. - Key offerings
Daiichi Sankyo Co. Ltd. - Segment focus
SWOT

15.9 Eli Lilly and Co.

Eli Lilly and Co. - Overview
Eli Lilly and Co. - Product / Service
Eli Lilly and Co. - Key news
Eli Lilly and Co. - Key offerings
SWOT

15.10 Gilead Sciences Inc.

Gilead Sciences Inc. - Overview
Gilead Sciences Inc. - Business segments
Gilead Sciences Inc. - Key news
Gilead Sciences Inc. - Key offerings
Gilead Sciences Inc. - Segment focus
SWOT

15.11 Johnson and Johnson

Johnson and Johnson - Overview
Johnson and Johnson - Business segments
Johnson and Johnson - Key news
Johnson and Johnson - Key offerings
Johnson and Johnson - Segment focus
SWOT

15.12 Merck and Co. Inc.

Merck and Co. Inc. - Overview
Merck and Co. Inc. - Business segments
Merck and Co. Inc. - Key news
Merck and Co. Inc. - Key offerings
Merck and Co. Inc. - Segment focus
SWOT

15.13 Novartis AG

Novartis AG - Overview
Novartis AG - Business segments
Novartis AG - Key news
Novartis AG - Key offerings
Novartis AG - Segment focus
SWOT

15.14 Pfizer Inc.

Pfizer Inc. - Overview
Pfizer Inc. - Business segments
Pfizer Inc. - Key news
Pfizer Inc. - Key offerings
Pfizer Inc. - Segment focus
SWOT

15.15 Sanofi SA

Sanofi SA - Overview
Sanofi SA - Business segments
Sanofi SA - Key news
Sanofi SA - Key offerings
Sanofi SA - Segment focus
SWOT

15.16 Takeda Pharmaceutical Ltd.

Takeda Pharmaceutical Ltd. - Overview
Takeda Pharmaceutical Ltd. - Business segments
Takeda Pharmaceutical Ltd. - Key news
Takeda Pharmaceutical Ltd. - Key offerings
Takeda Pharmaceutical Ltd. - Segment focus
SWOT

15.17 Teva Pharmaceutical Ltd.

Teva Pharmaceutical Ltd. - Overview
Teva Pharmaceutical Ltd. - Business segments
Teva Pharmaceutical Ltd. - Key news
Teva Pharmaceutical Ltd. - Key offerings
Teva Pharmaceutical Ltd. - Segment focus
SWOT

15.18 Viatris Inc.

Viatris Inc. - Overview
Viatris Inc. - Business segments
Viatris Inc. - Key news
Viatris Inc. - Key offerings
Viatris Inc. - Segment focus
SWOT

16. Appendix

16.1 Scope of the report

Market definition
Objectives
Notes and caveats

16.2 Inclusions and exclusions checklist

Inclusions checklist
Exclusions checklist

16.3 Currency conversion rates for US$

16.4 Research methodology

16.5 Data procurement

Information sources

16.6 Data validation

16.7 Validation techniques employed for market sizing

16.8 Data synthesis

16.9 360 degree market analysis

16.10 List of abbreviations

Research Methodology

Technavio presents a detailed picture of the market by way of study, synthesis, and summation of data from multiple sources. The analysts have presented the various facets of the market with a particular focus on identifying the key industry influencers. The data thus presented is comprehensive, reliable, and the result of extensive research, both primary and secondary.

INFORMATION SOURCES

Primary sources

  • Manufacturers and suppliers
  • Channel partners
  • Industry experts
  • Strategic decision makers

Secondary sources

  • Industry journals and periodicals
  • Government data
  • Financial reports of key industry players
  • Historical data
  • Press releases

DATA ANALYSIS

Data Synthesis

  • Collation of data
  • Estimation of key figures
  • Analysis of derived insights

Data Validation

  • Triangulation with data models
  • Reference against proprietary databases
  • Corroboration with industry experts

REPORT WRITING

Qualitative

  • Market drivers
  • Market challenges
  • Market trends
  • Five forces analysis

Quantitative

  • Market size and forecast
  • Market segmentation
  • Geographical insights
  • Competitive landscape

Interested in this report?

Get your sample now to see our research methodology and insights!

Download Now

Frequently Asked Questions

Cardiovascular Therapeutics market growth will increase by USD 25757.4 million during 2026-2030.

The Cardiovascular Therapeutics market is expected to grow at a CAGR of 4.5% during 2026-2030.

Cardiovascular Therapeutics market is segmented by Distribution channel (Hospital pharmacy, Retail pharmacy, Online pharmacy) Type (Antithrombotic drugs, Hypolipidemic drugs, Others) Route of administration (Oral, Injectable, Transdermal)

Alnylam Pharmaceuticals Inc., Amgen Inc., AstraZeneca Plc, Bayer AG, Bristol Myers Squibb Co., Daiichi Sankyo Co. Ltd., Eli Lilly and Co., Esperion Therapeutics Inc., Gilead Sciences Inc., Johnson and Johnson, Les Laboratoires Servier, Merck and Co. Inc., Novartis AG, Pfizer Inc., Regeneron Pharmaceuticals Inc., Sanofi SA, Sun Pharmaceutical Industries, Takeda Pharmaceutical Ltd., Teva Pharmaceutical Ltd., Viatris Inc. are a few of the key vendors in the Cardiovascular Therapeutics market.

Asia will register the highest growth rate of 47.6% among the other regions. Therefore, the Cardiovascular Therapeutics market in Asia is expected to garner significant business opportunities for the vendors during the forecast period.

China, India, Japan, South Korea, Indonesia, Thailand, US, Canada, Mexico, Germany, UK, France, Italy, Spain, The Netherlands, Brazil, Saudi Arabia, Turkey, Argentina, Colombia, South Africa, UAE, Israel

  • Proliferation of aging demographic and lifestyle related comorbidities is the driving factor this market.

The Cardiovascular Therapeutics market vendors should focus on grabbing business opportunities from the Distribution channel segment as it accounted for the largest market share in the base year.
RIA - Research AI Assistant
Ask RIA