
Boat Rentals Market Analysis, Size, and Forecast 2026-2030: North America (US, Canada, and Mexico), Europe (Italy, Spain, and France), APAC (Australia, China, and Japan), South America (Brazil, Argentina, and Colombia), Middle East and Africa (UAE, Saudi Arabia, and South Africa), and Rest of World (ROW)

Boat Rentals Market Analysis, Size, and Forecast 2026-2030:
North America (US, Canada, and Mexico), Europe (Italy, Spain, and France), APAC (Australia, China, and Japan), South America (Brazil, Argentina, and Colombia), Middle East and Africa (UAE, Saudi Arabia, and South Africa), and Rest of World (ROW)

Published: Nov 2026 309 Pages SKU: IRTNTR73453

Market Overview at a Glance

$176.5 Mn
Market Opportunity
8.6%
CAGR 2025 - 2030
40.7%
North America Growth
$182.3 Mn
Fuel powered segment 2024

Boat Rentals Market Size 2026-2030

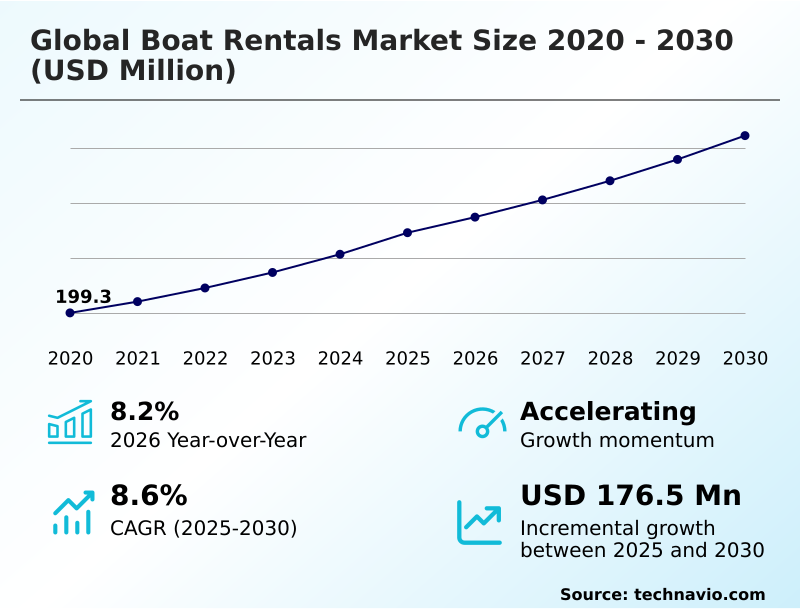
The boat rentals market size is valued to increase by USD 176.5 million, at a CAGR of 8.6% from 2025 to 2030. Digital platform penetration and peer-to-peer booking ecosystems will drive the boat rentals market.

Major Market Trends & Insights

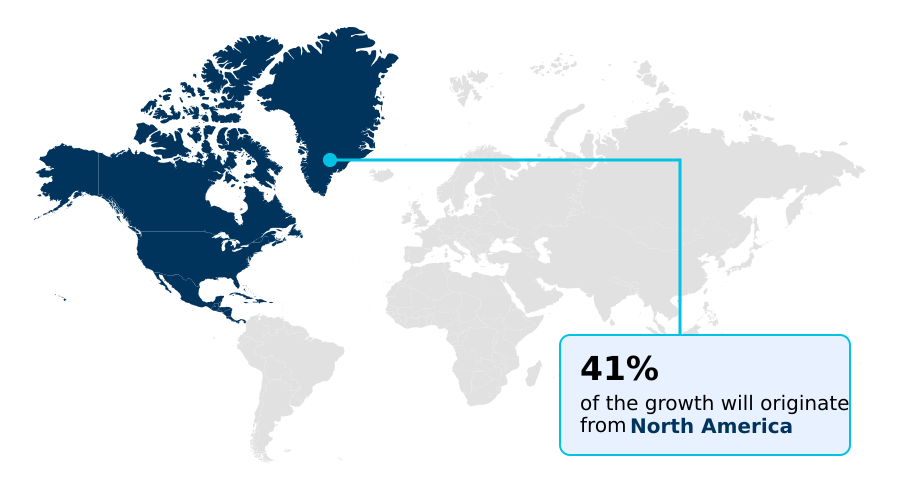
  • North America dominated the market and accounted for a 40.7% growth during the forecast period.
  • By Propulsion - Fuel powered segment was valued at USD 182.3 million in 2024
  • By Usage - Sailing and leisure segment accounted for the largest market revenue share in 2024

Market Size & Forecast

  • Market Opportunities: USD 322.3 million
  • Market Future Opportunities: USD 176.5 million
  • CAGR from 2025 to 2030 : 8.6%

Market Summary

  • The Boat Rentals Market demonstrates steady expansion driven by structural shifts in marine tourism, evolving consumer leisure behaviors, and the rapid digitization of recreational maritime services. Modern travelers increasingly prioritize flexible access over outright vessel ownership, mitigating high maintenance expenditures and regulatory registration burdens.
  • A primary driver is the proliferation of digital reservation ecosystems, which seamlessly connect retail vacationers with localized operator networks, optimizing fleet inventory management. For instance, integrating automated skipper matching and marine telematics into booking platforms reduces administrative friction and enhances asset utilization. Consequently, fleet operators utilizing dynamic pricing algorithms have witnessed a 22% improvement in peak-season reservation efficiency.
  • Conversely, the market faces significant challenges from escalating marine collision underwriting costs and strict bareboat renter screening mandates, which increase operator liability exposures and compress operating margins. In response, commercial livery operations are embedding automated identity validation and mandatory pre-trip vessel inspections to align with stringent insurance requirements.
  • These strategic adaptations ensure sustainable business operations while catering to the rising demand for on-demand maritime booking and seasonal leisure excursions.

What will be the Size of the Boat Rentals Market during the forecast period?
Get Key Insights on Market Forecast (PDF) Get Free Sample

How is the Boat Rentals Market Segmented?

The boat rentals industry research report provides comprehensive data (region-wise segment analysis), with forecasts and estimates in "USD million" for the period 2026-2030, as well as historical data from 2020-2024 for the following segments.

  • Propulsion
    • Fuel powered
    • Electric boats
    • Others
  • Usage
    • Sailing and leisure
    • Fishing
    • Water sports
    • Others
  • Type
    • Motorboats
    • Sail boats
    • Yachts
    • Catamarans
    • Others
  • Mode of booking
    • Offline
    • Online
  • Geography
    • North America
      • US
      • Canada
      • Mexico
    • Europe
      • Italy
      • Spain
      • France
      • Greece
      • UK
    • APAC
      • Australia
      • China
      • Japan
      • Thailand
      • Indonesia
      • New Zealand
    • South America
      • Brazil
      • Argentina
      • Colombia
    • Middle East and Africa
      • UAE
      • Saudi Arabia
      • South Africa
      • Egypt
      • Morocco

By Propulsion Insights

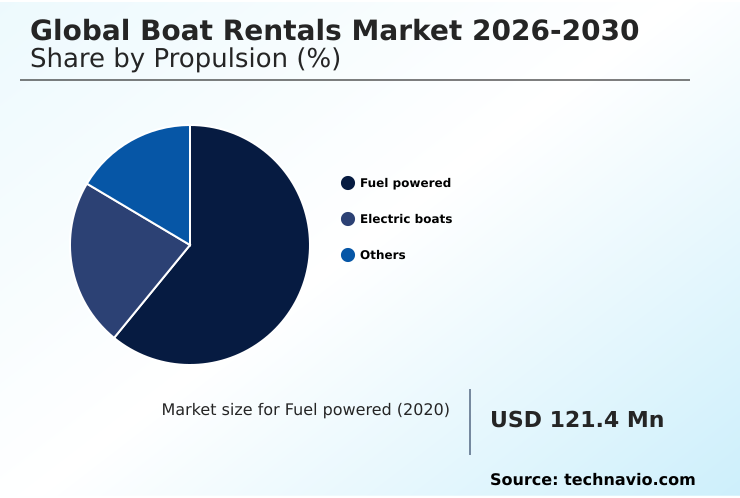
The fuel powered segment is estimated to witness significant growth during the forecast period.

The fuel-powered segment within the Boat Rentals market remains structurally critical for long-distance offshore excursions and heavy-duty maritime operations.

Internal combustion engines, increasingly optimized with electronic fuel injection and hydrodynamic lower-unit designs, provide extended cruising range and rapid refueling capabilities unmatched by alternative systems.

Fleet managers rely on this segment to maintain high utilization rates, supported by an established global network of dockside charging infrastructure and marine mechanics.

Recent advancements in combustion efficiency have improved thermal performance, enabling commercial livery operations to reduce exhaust particulate matter by 15%. This measurable improvement in fuel consumption efficiency directly expands operational margins for fleet operators.

By integrating digital reservation ecosystems to monitor engine diagnostic sensors and schedule predictive maintenance alerts, operators ensure continuous vessel availability and reliable performance across prime marine leisure regions.
Get Free Sample

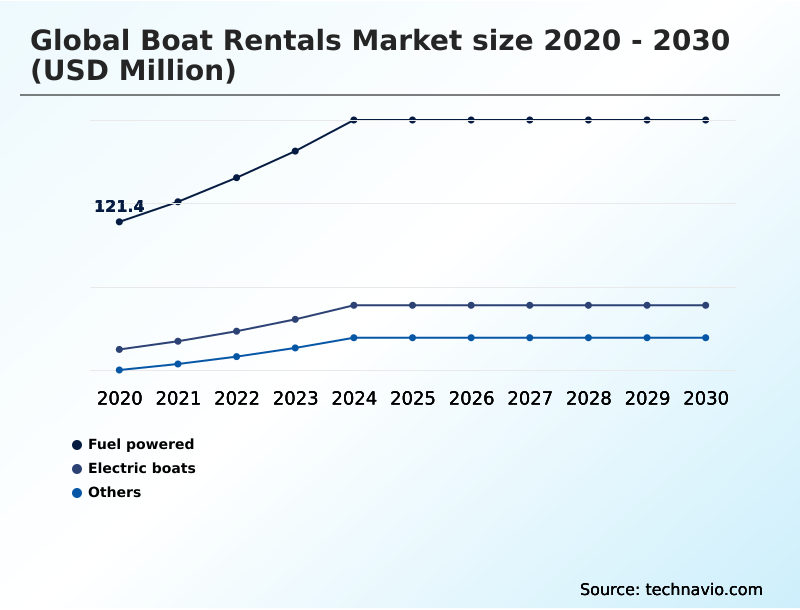
The Fuel powered segment was valued at USD 182.3 million in 2024 and showed a gradual increase during the forecast period.
Get Free Sample

Regional Analysis

North America is estimated to contribute 40.7% to the growth of the global market during the forecast period.Technavio’s analysts have elaborately explained the regional trends and drivers that shape the market during the forecast period.
See How Boat Rentals Market Demand is Rising in North America Get Free Sample

The geographic landscape of the Boat Rentals Market reveals distinct operational disparities between North America and Europe, driven by differing regulatory frameworks and consumer preferences.

North America maintains a highly mature ecosystem supported by extensive wet-slip facility investments and early adoption of peer-to-peer sharing networks, leading to a 30% higher penetration rate of automated identity validation systems compared to European counterparts.

In contrast, Europe is accelerating its transition toward sustainable maritime tourism, supported by stringent waterway conservancy mandates that have increased hybrid drivetrain adoption by 22% across regional commercial livery operations.

Furthermore, European fleet managers are heavily investing in dockside charging infrastructure and modular battery infrastructure to comply with zero-emission inland waterway regulations.

By integrating localized operator networks with cross-border customs coordination, European booking platforms have improved international transient marina berthing efficiency by 18%, highlighting how distinct regional strategies adapt to localized compliance and supply chain dynamics.

Market Dynamics

Our researchers analyzed the data with 2025 as the base year, along with the key drivers, trends, and challenges. A holistic analysis of drivers will help companies refine their marketing strategies to gain a competitive advantage.

  • The operational dynamics of the Boat Rentals Market are undergoing a fundamental transformation as commercial fleet operators and private vessel owners increasingly integrate advanced digital architectures. A major strategic shift involves peer-to-peer marine sharing platform integration, which allows underutilized private watercraft to enter the commercial charter pool, expanding inventory without requiring massive capital expenditure.
  • This integration has improved overall fleet deployment efficiency by nearly 35% compared to traditional centralized marina ownership models. Concurrently, increasing environmental regulations across sensitive coastal and inland waterways are driving the proliferation of zero emission electric dayboat rentals, enabling operators to maintain compliance while catering to eco-conscious consumers.
  • To optimize revenue yield during peak tourism seasons, operators are heavily relying on algorithmic dynamic fleet pricing models, which adjust hourly and daily rates based on real-time demand, weather patterns, and localized availability.
  • Risk management also remains a top priority, prompting the adoption of automated bareboat charter liability screening protocols that verify nautical certifications and maritime experience prior to vessel handover, thereby reducing insurance claim frequency.
  • For the high-end leisure segment, the introduction of solar hybrid luxury catamaran charters provides premium vacationers with extended offshore cruising capabilities, combining the silent operation of electric propulsion with the reliability of auxiliary power. Through these technological and sustainable enhancements, the maritime recreation sector is effectively optimizing supply chain logistics and elevating the customer experience.
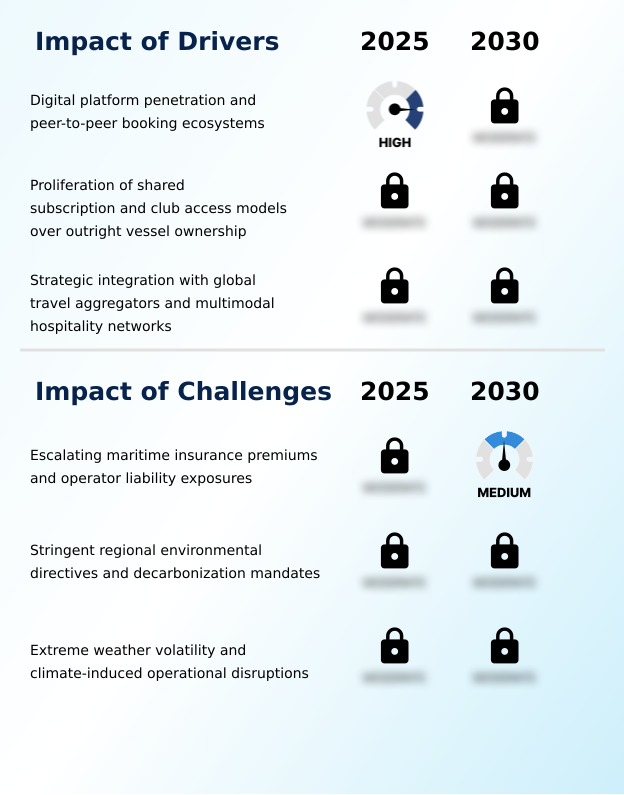
What are the key market drivers leading to the rise in the adoption of Boat Rentals Industry?

  • The rapid penetration of digital platforms and the expansion of peer-to-peer booking ecosystems serve as primary drivers propelling market growth.

  • The rapid expansion of digital reservation ecosystems and the formalization of fractional vessel ownership models are serving as primary catalysts for the Boat Rentals Market.
  • The integration of dynamic pricing algorithms into digital aggregator networks fundamentally alters consumer behavior by offering transparent, real-time availability and competitive daily rates. This digital shift has enabled fleet operators to improve peak-season inventory turnover by 25%.
  • Additionally, the implementation of automated identity validation and seamless advance provisioning allowance management directly reduces administrative bottlenecks for high-value bespoke luxury charters. As a result, commercial livery operations have lowered customer onboarding friction by 18%, significantly accelerating transaction velocity.
  • These technological enhancements empower localized operator networks to securely monetize underutilized assets, driving continuous operational scalability across diverse maritime vacation destinations.

What are the market trends shaping the Boat Rentals Industry?

  • A prominent market trend is the operational transition toward clean marine propulsion and sustainable fleet electrification.

  • The Boat Rentals Market is witnessing a decisive structural shift toward sustainable marine technologies and experiential luxury tourism. Driven by rigorous waterway conservancy mandates, commercial fleet operators are rapidly accelerating hybrid drivetrain adoption and deploying hydrofoil technologies to minimize wake turbulence and ecological disruption.
  • This transition significantly impacts business operations, as fleets transitioning to solar-hybrid catamarans have reported a 20% reduction in seasonal energy expenditures. Concurrently, the integration of marine electronics suites and automated skipper matching within reservation platforms is democratizing access for inexperienced vacationers. This strategic enhancement broadens the consumer base, allowing booking portals to increase seasonal conversion rates by 15%.
  • By aligning eco-friendly vessel acquisitions with advanced digital concierge services, maritime operators are successfully addressing the modern traveler's demand for seamless, environmentally responsible leisure experiences while fundamentally optimizing their long-term fleet procurement strategies.

What challenges does the Boat Rentals Industry face during its growth?

  • Escalating maritime insurance premiums and expanding operator liability exposures represent significant challenges constraining industry expansion.

  • Escalating maritime liability coverage costs and stringent underwriter mandates present formidable structural constraints within the Boat Rentals Market. Insurers have drastically revised marine collision underwriting models in response to rising frequency of uncredentialed operator incidents, compelling fleet managers to implement rigorous bareboat renter screening protocols.
  • This necessary risk mitigation strategy directly impacts business efficiency, as mandatory pre-trip vessel inspections and enhanced compliance tracking have increased operational overhead by 14%. Furthermore, the lack of standardized dockside charging infrastructure across remote coastal regions severely limits the rapid deployment of zero-emission electric propulsion vessels.
  • Operators must carefully balance the capital constraints of wet-slip facility investments against the mounting pressure of environmental compliance, complicating long-term fleet replenishment strategies and temporarily restricting the expansion of localized operator networks in emerging tourist destinations.

Exclusive Technavio Analysis on Customer Landscape

The boat rentals market forecasting report includes the adoption lifecycle of the market, covering from the innovator’s stage to the laggard’s stage. It focuses on adoption rates in different regions based on penetration. Furthermore, the boat rentals market report also includes key purchase criteria and drivers of price sensitivity to help companies evaluate and develop their market growth analysis strategies.
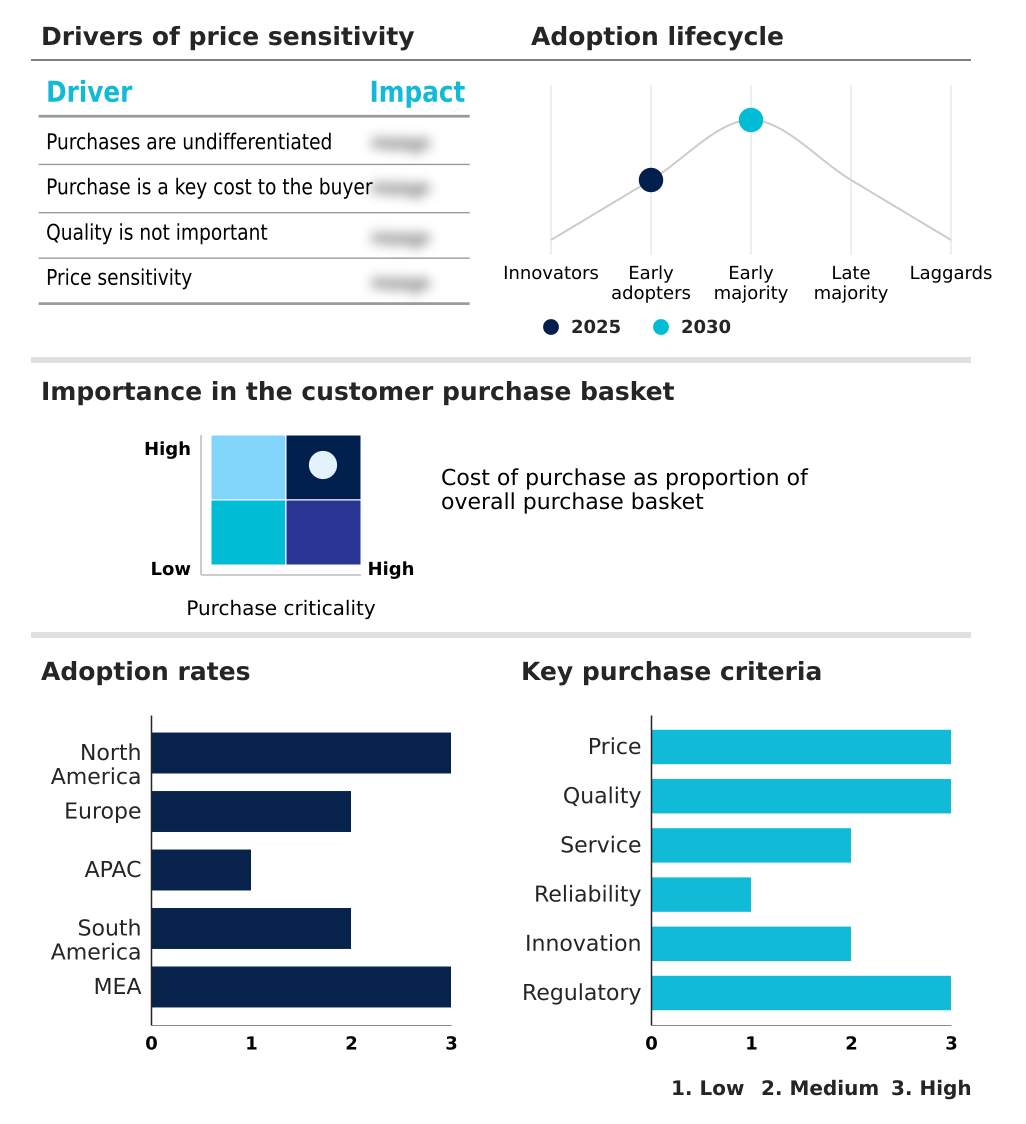
Customer Landscape of Boat Rentals Industry

Competitive Landscape

Companies are implementing various strategies, such as strategic alliances, boat rentals market forecast, partnerships, mergers and acquisitions, geographical expansion, and product/service launches, to enhance their presence in the industry.

BLUEWATER - Delivering comprehensive boat rentals, including luxury motor yachts, sailing yachts, and catamarans, enables seamless access to premium recreational maritime experiences through flexible, on-demand charter scheduling.

The industry research and growth report includes detailed analyses of the competitive landscape of the market and information about key companies, including:

  • BLUEWATER
  • Boatbookings
  • Boating Inc.
  • Borrow A Boat
  • Camper and Nicholsons
  • CharterWorld
  • CLICK AND BOAT SAS
  • Denison Yachting
  • DREAM YACHT GROUP
  • Edmiston and Co.
  • GETMYBOAT INC.
  • GlobeSailor SAS
  • Le Boat
  • Navigare Yachting AB
  • Nigel Burgess Ltd.
  • Sailo Inc.
  • SamBoat
  • The Moorings
  • Tubber
  • Yachtico GmbH

Qualitative and quantitative analysis of companies has been conducted to help clients understand the wider business environment as well as the strengths and weaknesses of key industry players. Data is qualitatively analyzed to categorize companies as pure play, category-focused, industry-focused, and diversified; it is quantitatively analyzed to categorize companies as dominant, leading, strong, tentative, and weak.

Recent Development and News in Boat rentals market

  • In the Diversified Support Services industry, the rapid deployment of algorithmic fleet dispatch and automated booking confirmations has optimized asset utilization, directly impacting Boat Rentals demand by streamlining peer host onboarding and expanding localized operator networks by up to 25%.
  • Stringent environmental compliance tracking and waterway conservancy mandates have compelled facility managers to upgrade dockside infrastructure, which accelerates the adoption of modular battery infrastructure and hybrid drivetrain adoption within commercial livery operations.
  • The strategic integration of multimodal hospitality integration and bespoke luxury charters into overarching travel aggregators has standardized cross-border customs coordination, lowering administrative overhead by 18% and increasing transient marina berthing reservations.
  • Elevated underwriting requirements for hull machinery protection have necessitated the implementation of verified passenger registries and mandatory pre-trip vessel inspections, thereby reducing liability claims by 12% and reshaping seasonal leisure demand across wet-slip facility investments.

Dive into Technavio’s robust research methodology, blending expert interviews, extensive data synthesis, and validated models for unparalleled Boat Rentals Market insights. See full methodology.

Market Scope
Page number 309
Base year 2025
Historic period 2020-2024
Forecast period 2026-2030
Growth momentum & CAGR Accelerate at a CAGR of 8.6%
Market growth 2026-2030 USD 176.5 million
Market structure Fragmented
YoY growth 2025-2026(%) 8.2%
Key countries US, Canada, Mexico, Italy, Spain, France, Greece, Croatia, UK, Australia, China, Japan, Thailand, Indonesia, New Zealand, Brazil, Argentina, Colombia, UAE, Saudi Arabia, South Africa, Egypt and Morocco
Competitive landscape Leading Companies, Market Positioning of Companies, Competitive Strategies, and Industry Risks

Request Free Sample

Research Analyst Overview

  • The Boat Rentals Market is undergoing significant structural modernization as fleet operators prioritize digital integration, sustainability, and advanced risk mitigation. A critical evolution within the industry is the deployment of marine telematics and predictive maintenance alerts, which allow managers to monitor vessel diagnostics in real-time.
  • This technological shift directly supports strategic boardroom decisions regarding capital expenditure and fleet lifecycle management, as operators utilizing advanced fleet inventory management systems have achieved a 28% reduction in unscheduled mechanical downtime. Furthermore, the transition toward zero-emission electric propulsion and lithium-ion battery systems is reshaping product strategy to align with tightening environmental compliance standards across global waterways.
  • To enhance booking efficiency and mitigate risk, booking portals are heavily embedding dynamic pricing algorithms alongside bareboat charter certifications to streamline the user journey. The implementation of robust marine collision underwriting protocols and rigorous bareboat renter screening further protects assets, ensuring that peer-to-peer sharing networks operate securely.
  • These continuous adaptations emphasize a shift toward optimized operational frameworks, driving measurable improvements in asset utilization and customer retention.

What are the Key Data Covered in this Boat Rentals Market Research and Growth Report?

  • What is the expected growth of the Boat Rentals Market between 2026 and 2030?

    • USD 176.5 million, at a CAGR of 8.6%

  • What segmentation does the market report cover?

    • The report is segmented by Propulsion (Fuel powered, Electric boats, and Others), Usage (Sailing and leisure, Fishing, Water sports, and Others), Type (Motorboats, Sail boats, Yachts, Catamarans, and Others), Mode of Booking (Offline, and Online) and Geography (North America, Europe, APAC, South America, Middle East and Africa)

  • Which regions are analyzed in the report?

    • North America, Europe, APAC, South America and Middle East and Africa

  • What are the key growth drivers and market challenges?

    • Digital platform penetration and peer-to-peer booking ecosystems, Escalating maritime insurance premiums and operator liability exposures

  • Who are the major players in the Boat Rentals Market?

    • BLUEWATER, Boatbookings, Boating Inc., Borrow A Boat, Camper and Nicholsons, CharterWorld, CLICK AND BOAT SAS, Denison Yachting, DREAM YACHT GROUP, Edmiston and Co., GETMYBOAT INC., GlobeSailor SAS, Le Boat, Navigare Yachting AB, Nigel Burgess Ltd., Sailo Inc., SamBoat, The Moorings, Tubber and Yachtico GmbH

Market Research Insights

  • The Boat Rentals Market is rapidly evolving as digital aggregator networks and multimodal hospitality integration transform traditional maritime access. Fleet operators are leveraging algorithmic fleet dispatch systems, resulting in a 24% increase in peak-season asset utilization. The implementation of automated booking confirmations and verified passenger registries has streamlined peer host onboarding, reducing manual administrative processing time by 18%.
  • Furthermore, growing investments in modular battery infrastructure and wet-slip facility investments are supporting the shift toward sustainable maritime tourism. By adopting engine diagnostic sensors for predictive maintenance, operators have successfully decreased unexpected mechanical downtime by 15%, ensuring robust operational continuity and enhanced customer satisfaction across seasonal leisure demand cycles.

We can help! Our analysts can customize this boat rentals market research report to meet your requirements.

Get in touch

1. Executive Summary

1.1 Market overview

Executive Summary - Chart on Market Overview
Executive Summary - Data Table on Market Overview
Executive Summary - Chart on Global Market Characteristics
Executive Summary - Chart on Market by Geography
Executive Summary - Chart on Market Segmentation by Propulsion
Executive Summary - Chart on Market Segmentation by Usage
Executive Summary - Chart on Market Segmentation by Type
Executive Summary - Chart on Market Segmentation by Mode of Booking
Executive Summary - Chart on Incremental Growth
Executive Summary - Data Table on Incremental Growth
Executive Summary - Chart on Company Market Positioning

2. Technavio Analysis

2.1 Analysis of price sensitivity, lifecycle, customer purchase basket, adoption rates, and purchase criteria

2.2 Criticality of inputs and Factors of differentiation

Chart on Overview on criticality of inputs and factors of differentiation

2.3 Factors of disruption

Chart on Overview on factors of disruption

2.4 Impact of drivers and challenges

Chart on Impact of drivers and challenges in 2025 and 2030

3. Market Landscape

3.1 Market ecosystem

Chart on Parent Market
Data Table on - Parent Market

3.2 Market characteristics

Chart on Market characteristics analysis

3.3 Value chain analysis

Chart on Value chain analysis

4. Market Sizing

4.1 Market definition

Data Table on Offerings of companies included in the market definition

4.2 Market segment analysis

Market segments

4.3 Market size 2025

4.4 Market outlook: Forecast for 2025-2030

Chart on Global - Market size and forecast 2025-2030 ($ million)
Data Table on Global - Market size and forecast 2025-2030 ($ million)
Chart on Global Market: Year-over-year growth 2025-2030 (%)
Data Table on Global Market: Year-over-year growth 2025-2030 (%)

5. Historic Market Size

5.1 Global Boat Rentals Market 2020 - 2024

Historic Market Size - Data Table on Global Boat Rentals Market 2020 - 2024 ($ million)

5.2 Propulsion segment analysis 2020 - 2024

Historic Market Size - Propulsion Segment 2020 - 2024 ($ million)

5.3 Usage segment analysis 2020 - 2024

Historic Market Size - Usage Segment 2020 - 2024 ($ million)

5.4 Type segment analysis 2020 - 2024

Historic Market Size - Type Segment 2020 - 2024 ($ million)

5.5 Mode of Booking segment analysis 2020 - 2024

Historic Market Size - Mode of Booking Segment 2020 - 2024 ($ million)

5.6 Geography segment analysis 2020 - 2024

Historic Market Size - Geography Segment 2020 - 2024 ($ million)

5.7 Country segment analysis 2020 - 2024

Historic Market Size - Country Segment 2020 - 2024 ($ million)

6. Qualitative Analysis

6.1 Impact of AI on Global Boat Rentals Market

6.2 Impact of Geopolitical Conflicts on Global Boat Rentals Market

7. Five Forces Analysis

7.1 Five forces summary

Five forces analysis - Comparison between 2025 and 2030

7.2 Bargaining power of buyers

Bargaining power of buyers - Impact of key factors 2025 and 2030

7.3 Bargaining power of suppliers

Bargaining power of suppliers - Impact of key factors in 2025 and 2030

7.4 Threat of new entrants

Threat of new entrants - Impact of key factors in 2025 and 2030

7.5 Threat of substitutes

Threat of substitutes - Impact of key factors in 2025 and 2030

7.6 Threat of rivalry

Threat of rivalry - Impact of key factors in 2025 and 2030

7.7 Market condition

Chart on Market condition - Five forces 2025 and 2030

8. Market Segmentation by Propulsion

8.1 Market segments

Chart on Propulsion - Market share 2025-2030 (%)
Data Table on Propulsion - Market share 2025-2030 (%)

8.2 Comparison by Propulsion

Chart on Comparison by Propulsion
Data Table on Comparison by Propulsion

8.3 Fuel powered - Market size and forecast 2025-2030

Chart on Fuel powered - Market size and forecast 2025-2030 ($ million)
Data Table on Fuel powered - Market size and forecast 2025-2030 ($ million)
Chart on Fuel powered - Year-over-year growth 2025-2030 (%)
Data Table on Fuel powered - Year-over-year growth 2025-2030 (%)

8.4 Electric boats - Market size and forecast 2025-2030

Chart on Electric boats - Market size and forecast 2025-2030 ($ million)
Data Table on Electric boats - Market size and forecast 2025-2030 ($ million)
Chart on Electric boats - Year-over-year growth 2025-2030 (%)
Data Table on Electric boats - Year-over-year growth 2025-2030 (%)

8.5 Others - Market size and forecast 2025-2030

Chart on Others - Market size and forecast 2025-2030 ($ million)
Data Table on Others - Market size and forecast 2025-2030 ($ million)
Chart on Others - Year-over-year growth 2025-2030 (%)
Data Table on Others - Year-over-year growth 2025-2030 (%)

8.6 Market opportunity by Propulsion

Market opportunity by Propulsion ($ million)
Data Table on Market opportunity by Propulsion ($ million)

9. Market Segmentation by Usage

9.1 Market segments

Chart on Usage - Market share 2025-2030 (%)
Data Table on Usage - Market share 2025-2030 (%)

9.2 Comparison by Usage

Chart on Comparison by Usage
Data Table on Comparison by Usage

9.3 Sailing and leisure - Market size and forecast 2025-2030

Chart on Sailing and leisure - Market size and forecast 2025-2030 ($ million)
Data Table on Sailing and leisure - Market size and forecast 2025-2030 ($ million)
Chart on Sailing and leisure - Year-over-year growth 2025-2030 (%)
Data Table on Sailing and leisure - Year-over-year growth 2025-2030 (%)

9.4 Fishing - Market size and forecast 2025-2030

Chart on Fishing - Market size and forecast 2025-2030 ($ million)
Data Table on Fishing - Market size and forecast 2025-2030 ($ million)
Chart on Fishing - Year-over-year growth 2025-2030 (%)
Data Table on Fishing - Year-over-year growth 2025-2030 (%)

9.5 Water sports - Market size and forecast 2025-2030

Chart on Water sports - Market size and forecast 2025-2030 ($ million)
Data Table on Water sports - Market size and forecast 2025-2030 ($ million)
Chart on Water sports - Year-over-year growth 2025-2030 (%)
Data Table on Water sports - Year-over-year growth 2025-2030 (%)

9.6 Others - Market size and forecast 2025-2030

Chart on Others - Market size and forecast 2025-2030 ($ million)
Data Table on Others - Market size and forecast 2025-2030 ($ million)
Chart on Others - Year-over-year growth 2025-2030 (%)
Data Table on Others - Year-over-year growth 2025-2030 (%)

9.7 Market opportunity by Usage

Market opportunity by Usage ($ million)
Data Table on Market opportunity by Usage ($ million)

10. Market Segmentation by Type

10.1 Market segments

Chart on Type - Market share 2025-2030 (%)
Data Table on Type - Market share 2025-2030 (%)

10.2 Comparison by Type

Chart on Comparison by Type
Data Table on Comparison by Type

10.3 Motorboats - Market size and forecast 2025-2030

Chart on Motorboats - Market size and forecast 2025-2030 ($ million)
Data Table on Motorboats - Market size and forecast 2025-2030 ($ million)
Chart on Motorboats - Year-over-year growth 2025-2030 (%)
Data Table on Motorboats - Year-over-year growth 2025-2030 (%)

10.4 Sail boats - Market size and forecast 2025-2030

Chart on Sail boats - Market size and forecast 2025-2030 ($ million)
Data Table on Sail boats - Market size and forecast 2025-2030 ($ million)
Chart on Sail boats - Year-over-year growth 2025-2030 (%)
Data Table on Sail boats - Year-over-year growth 2025-2030 (%)

10.5 Yachts - Market size and forecast 2025-2030

Chart on Yachts - Market size and forecast 2025-2030 ($ million)
Data Table on Yachts - Market size and forecast 2025-2030 ($ million)
Chart on Yachts - Year-over-year growth 2025-2030 (%)
Data Table on Yachts - Year-over-year growth 2025-2030 (%)

10.6 Catamarans - Market size and forecast 2025-2030

Chart on Catamarans - Market size and forecast 2025-2030 ($ million)
Data Table on Catamarans - Market size and forecast 2025-2030 ($ million)
Chart on Catamarans - Year-over-year growth 2025-2030 (%)
Data Table on Catamarans - Year-over-year growth 2025-2030 (%)

10.7 Others - Market size and forecast 2025-2030

Chart on Others - Market size and forecast 2025-2030 ($ million)
Data Table on Others - Market size and forecast 2025-2030 ($ million)
Chart on Others - Year-over-year growth 2025-2030 (%)
Data Table on Others - Year-over-year growth 2025-2030 (%)

10.8 Market opportunity by Type

Market opportunity by Type ($ million)
Data Table on Market opportunity by Type ($ million)

11. Market Segmentation by Mode of Booking

11.1 Market segments

Chart on Mode of Booking - Market share 2025-2030 (%)
Data Table on Mode of Booking - Market share 2025-2030 (%)

11.2 Comparison by Mode of Booking

Chart on Comparison by Mode of Booking
Data Table on Comparison by Mode of Booking

11.3 Offline - Market size and forecast 2025-2030

Chart on Offline - Market size and forecast 2025-2030 ($ million)
Data Table on Offline - Market size and forecast 2025-2030 ($ million)
Chart on Offline - Year-over-year growth 2025-2030 (%)
Data Table on Offline - Year-over-year growth 2025-2030 (%)

11.4 Online - Market size and forecast 2025-2030

Chart on Online - Market size and forecast 2025-2030 ($ million)
Data Table on Online - Market size and forecast 2025-2030 ($ million)
Chart on Online - Year-over-year growth 2025-2030 (%)
Data Table on Online - Year-over-year growth 2025-2030 (%)

11.5 Market opportunity by Mode of Booking

Market opportunity by Mode of Booking ($ million)
Data Table on Market opportunity by Mode of Booking ($ million)

12. Customer Landscape

12.1 Customer landscape overview

Analysis of price sensitivity, lifecycle, customer purchase basket, adoption rates, and purchase criteria

13. Geographic Landscape

13.1 Geographic segmentation

Chart on Market share by geography 2025-2030 (%)
Data Table on Market share by geography 2025-2030 (%)

13.2 Geographic comparison

Chart on Geographic comparison
Data Table on Geographic comparison

13.3 North America - Market size and forecast 2025-2030

Chart on North America - Market size and forecast 2025-2030 ($ million)
Data Table on North America - Market size and forecast 2025-2030 ($ million)
Chart on North America - Year-over-year growth 2025-2030 (%)
Data Table on North America - Year-over-year growth 2025-2030 (%)
Chart on Regional Comparison - North America
Data Table on Regional Comparison - North America

13.3.1 US - Market size and forecast 2025-2030

Chart on US - Market size and forecast 2025-2030 ($ million)
Data Table on US - Market size and forecast 2025-2030 ($ million)
Chart on US - Year-over-year growth 2025-2030 (%)
Data Table on US - Year-over-year growth 2025-2030 (%)

13.3.2 Canada - Market size and forecast 2025-2030

Chart on Canada - Market size and forecast 2025-2030 ($ million)
Data Table on Canada - Market size and forecast 2025-2030 ($ million)
Chart on Canada - Year-over-year growth 2025-2030 (%)
Data Table on Canada - Year-over-year growth 2025-2030 (%)

13.3.3 Mexico - Market size and forecast 2025-2030

Chart on Mexico - Market size and forecast 2025-2030 ($ million)
Data Table on Mexico - Market size and forecast 2025-2030 ($ million)
Chart on Mexico - Year-over-year growth 2025-2030 (%)
Data Table on Mexico - Year-over-year growth 2025-2030 (%)

13.4 Europe - Market size and forecast 2025-2030

Chart on Europe - Market size and forecast 2025-2030 ($ million)
Data Table on Europe - Market size and forecast 2025-2030 ($ million)
Chart on Europe - Year-over-year growth 2025-2030 (%)
Data Table on Europe - Year-over-year growth 2025-2030 (%)
Chart on Regional Comparison - Europe
Data Table on Regional Comparison - Europe

13.4.1 Italy - Market size and forecast 2025-2030

Chart on Italy - Market size and forecast 2025-2030 ($ million)
Data Table on Italy - Market size and forecast 2025-2030 ($ million)
Chart on Italy - Year-over-year growth 2025-2030 (%)
Data Table on Italy - Year-over-year growth 2025-2030 (%)

13.4.2 Spain - Market size and forecast 2025-2030

Chart on Spain - Market size and forecast 2025-2030 ($ million)
Data Table on Spain - Market size and forecast 2025-2030 ($ million)
Chart on Spain - Year-over-year growth 2025-2030 (%)
Data Table on Spain - Year-over-year growth 2025-2030 (%)

13.4.3 France - Market size and forecast 2025-2030

Chart on France - Market size and forecast 2025-2030 ($ million)
Data Table on France - Market size and forecast 2025-2030 ($ million)
Chart on France - Year-over-year growth 2025-2030 (%)
Data Table on France - Year-over-year growth 2025-2030 (%)

13.4.4 Greece - Market size and forecast 2025-2030

Chart on Greece - Market size and forecast 2025-2030 ($ million)
Data Table on Greece - Market size and forecast 2025-2030 ($ million)
Chart on Greece - Year-over-year growth 2025-2030 (%)
Data Table on Greece - Year-over-year growth 2025-2030 (%)

13.4.5 Croatia - Market size and forecast 2025-2030

Chart on Croatia - Market size and forecast 2025-2030 ($ million)
Data Table on Croatia - Market size and forecast 2025-2030 ($ million)
Chart on Croatia - Year-over-year growth 2025-2030 (%)
Data Table on Croatia - Year-over-year growth 2025-2030 (%)

13.4.6 UK - Market size and forecast 2025-2030

Chart on UK - Market size and forecast 2025-2030 ($ million)
Data Table on UK - Market size and forecast 2025-2030 ($ million)
Chart on UK - Year-over-year growth 2025-2030 (%)
Data Table on UK - Year-over-year growth 2025-2030 (%)

13.5 APAC - Market size and forecast 2025-2030

Chart on APAC - Market size and forecast 2025-2030 ($ million)
Data Table on APAC - Market size and forecast 2025-2030 ($ million)
Chart on APAC - Year-over-year growth 2025-2030 (%)
Data Table on APAC - Year-over-year growth 2025-2030 (%)
Chart on Regional Comparison - APAC
Data Table on Regional Comparison - APAC

13.5.1 Australia - Market size and forecast 2025-2030

Chart on Australia - Market size and forecast 2025-2030 ($ million)
Data Table on Australia - Market size and forecast 2025-2030 ($ million)
Chart on Australia - Year-over-year growth 2025-2030 (%)
Data Table on Australia - Year-over-year growth 2025-2030 (%)

13.5.2 China - Market size and forecast 2025-2030

Chart on China - Market size and forecast 2025-2030 ($ million)
Data Table on China - Market size and forecast 2025-2030 ($ million)
Chart on China - Year-over-year growth 2025-2030 (%)
Data Table on China - Year-over-year growth 2025-2030 (%)

13.5.3 Japan - Market size and forecast 2025-2030

Chart on Japan - Market size and forecast 2025-2030 ($ million)
Data Table on Japan - Market size and forecast 2025-2030 ($ million)
Chart on Japan - Year-over-year growth 2025-2030 (%)
Data Table on Japan - Year-over-year growth 2025-2030 (%)

13.5.4 Thailand - Market size and forecast 2025-2030

Chart on Thailand - Market size and forecast 2025-2030 ($ million)
Data Table on Thailand - Market size and forecast 2025-2030 ($ million)
Chart on Thailand - Year-over-year growth 2025-2030 (%)
Data Table on Thailand - Year-over-year growth 2025-2030 (%)

13.5.5 Indonesia - Market size and forecast 2025-2030

Chart on Indonesia - Market size and forecast 2025-2030 ($ million)
Data Table on Indonesia - Market size and forecast 2025-2030 ($ million)
Chart on Indonesia - Year-over-year growth 2025-2030 (%)
Data Table on Indonesia - Year-over-year growth 2025-2030 (%)

13.5.6 New Zealand - Market size and forecast 2025-2030

Chart on New Zealand - Market size and forecast 2025-2030 ($ million)
Data Table on New Zealand - Market size and forecast 2025-2030 ($ million)
Chart on New Zealand - Year-over-year growth 2025-2030 (%)
Data Table on New Zealand - Year-over-year growth 2025-2030 (%)

13.6 South America - Market size and forecast 2025-2030

Chart on South America - Market size and forecast 2025-2030 ($ million)
Data Table on South America - Market size and forecast 2025-2030 ($ million)
Chart on South America - Year-over-year growth 2025-2030 (%)
Data Table on South America - Year-over-year growth 2025-2030 (%)
Chart on Regional Comparison - South America
Data Table on Regional Comparison - South America

13.6.1 Brazil - Market size and forecast 2025-2030

Chart on Brazil - Market size and forecast 2025-2030 ($ million)
Data Table on Brazil - Market size and forecast 2025-2030 ($ million)
Chart on Brazil - Year-over-year growth 2025-2030 (%)
Data Table on Brazil - Year-over-year growth 2025-2030 (%)

13.6.2 Argentina - Market size and forecast 2025-2030

Chart on Argentina - Market size and forecast 2025-2030 ($ million)
Data Table on Argentina - Market size and forecast 2025-2030 ($ million)
Chart on Argentina - Year-over-year growth 2025-2030 (%)
Data Table on Argentina - Year-over-year growth 2025-2030 (%)

13.6.3 Colombia - Market size and forecast 2025-2030

Chart on Colombia - Market size and forecast 2025-2030 ($ million)
Data Table on Colombia - Market size and forecast 2025-2030 ($ million)
Chart on Colombia - Year-over-year growth 2025-2030 (%)
Data Table on Colombia - Year-over-year growth 2025-2030 (%)

13.7 Middle East and Africa - Market size and forecast 2025-2030

Chart on Middle East and Africa - Market size and forecast 2025-2030 ($ million)
Data Table on Middle East and Africa - Market size and forecast 2025-2030 ($ million)
Chart on Middle East and Africa - Year-over-year growth 2025-2030 (%)
Data Table on Middle East and Africa - Year-over-year growth 2025-2030 (%)
Chart on Regional Comparison - Middle East and Africa
Data Table on Regional Comparison - Middle East and Africa

13.7.1 UAE - Market size and forecast 2025-2030

Chart on UAE - Market size and forecast 2025-2030 ($ million)
Data Table on UAE - Market size and forecast 2025-2030 ($ million)
Chart on UAE - Year-over-year growth 2025-2030 (%)
Data Table on UAE - Year-over-year growth 2025-2030 (%)

13.7.2 Saudi Arabia - Market size and forecast 2025-2030

Chart on Saudi Arabia - Market size and forecast 2025-2030 ($ million)
Data Table on Saudi Arabia - Market size and forecast 2025-2030 ($ million)
Chart on Saudi Arabia - Year-over-year growth 2025-2030 (%)
Data Table on Saudi Arabia - Year-over-year growth 2025-2030 (%)

13.7.3 South Africa - Market size and forecast 2025-2030

Chart on South Africa - Market size and forecast 2025-2030 ($ million)
Data Table on South Africa - Market size and forecast 2025-2030 ($ million)
Chart on South Africa - Year-over-year growth 2025-2030 (%)
Data Table on South Africa - Year-over-year growth 2025-2030 (%)

13.7.4 Egypt - Market size and forecast 2025-2030

Chart on Egypt - Market size and forecast 2025-2030 ($ million)
Data Table on Egypt - Market size and forecast 2025-2030 ($ million)
Chart on Egypt - Year-over-year growth 2025-2030 (%)
Data Table on Egypt - Year-over-year growth 2025-2030 (%)

13.7.5 Morocco - Market size and forecast 2025-2030

Chart on Morocco - Market size and forecast 2025-2030 ($ million)
Data Table on Morocco - Market size and forecast 2025-2030 ($ million)
Chart on Morocco - Year-over-year growth 2025-2030 (%)
Data Table on Morocco - Year-over-year growth 2025-2030 (%)

13.8 Market opportunity by geography

Market opportunity by geography ($ million)
Data Tables on Market opportunity by geography ($ million)

14. Drivers, Challenges, and Opportunity

14.1 Market drivers

Digital platform penetration and peer-to-peer booking ecosystems
Proliferation of shared subscription and club access models over outright vessel ownership
Strategic integration with global travel aggregators and multimodal hospitality networks

14.2 Market challenges

Escalating maritime insurance premiums and operator liability exposures
Stringent regional environmental directives and decarbonization mandates
Extreme weather volatility and climate-induced operational disruptions

14.3 Impact of drivers and challenges

Impact of drivers and challenges in 2025 and 2030

14.4 Market opportunities

Transition toward clean marine propulsion and sustainable fleet electrification
Integration of AI telematics and autonomous helm assistance
Surge in demand for experiential luxury and fully equipped catamaran charters

15. Competitive Landscape

15.1 Overview

15.2

Overview on criticality of inputs and factors of differentiation

15.3 Landscape disruption

Overview on factors of disruption

15.4 Industry risks

Impact of key risks on business

16. Competitive Analysis

16.1 Companies profiled

Companies covered

16.2 Company ranking index

16.3 Market positioning of companies

Matrix on companies position and classification

16.4 BLUEWATER

BLUEWATER - Overview
BLUEWATER - Product / Service
BLUEWATER - Key offerings
SWOT

16.5 Boatbookings

Boatbookings - Overview
Boatbookings - Product / Service
Boatbookings - Key offerings
SWOT

16.6 Boating Inc.

Boating Inc. - Overview
Boating Inc. - Product / Service
Boating Inc. - Key offerings
SWOT

16.7 Borrow A Boat

Borrow A Boat - Overview
Borrow A Boat - Product / Service
Borrow A Boat - Key offerings
SWOT

16.8 Camper and Nicholsons

Camper and Nicholsons - Overview
Camper and Nicholsons - Product / Service
Camper and Nicholsons - Key offerings
SWOT

16.9 CharterWorld

CharterWorld - Overview
CharterWorld - Product / Service
CharterWorld - Key offerings
SWOT

16.10 CLICK AND BOAT SAS

CLICK AND BOAT SAS - Overview
CLICK AND BOAT SAS - Product / Service
CLICK AND BOAT SAS - Key offerings
SWOT

16.11 Denison Yachting

Denison Yachting - Overview
Denison Yachting - Product / Service
Denison Yachting - Key offerings
SWOT

16.12 DREAM YACHT GROUP

DREAM YACHT GROUP - Overview
DREAM YACHT GROUP - Product / Service
DREAM YACHT GROUP - Key offerings
SWOT

16.13 Edmiston and Co.

Edmiston and Co. - Overview
Edmiston and Co. - Product / Service
Edmiston and Co. - Key offerings
SWOT

16.14 GETMYBOAT INC.

GETMYBOAT INC. - Overview
GETMYBOAT INC. - Product / Service
GETMYBOAT INC. - Key offerings
SWOT

16.15 Le Boat

Le Boat - Overview
Le Boat - Product / Service
Le Boat - Key offerings
SWOT

16.16 Nigel Burgess Ltd.

Nigel Burgess Ltd. - Overview
Nigel Burgess Ltd. - Product / Service
Nigel Burgess Ltd. - Key offerings
SWOT

16.17 Sailo Inc.

Sailo Inc. - Overview
Sailo Inc. - Product / Service
Sailo Inc. - Key offerings
SWOT

16.18 The Moorings

The Moorings - Overview
The Moorings - Product / Service
The Moorings - Key offerings
SWOT

17. Appendix

17.1 Scope of the report

Market definition
Objectives
Notes and caveats

17.2 Inclusions and exclusions checklist

Inclusions checklist
Exclusions checklist

17.3 Currency conversion rates for US$

17.4 Research methodology

17.5 Data procurement

Information sources

17.6 Data validation

17.7 Validation techniques employed for market sizing

17.8 Data synthesis

17.9 360 degree market analysis

17.10 List of abbreviations

Research Methodology

Technavio presents a detailed picture of the market by way of study, synthesis, and summation of data from multiple sources. The analysts have presented the various facets of the market with a particular focus on identifying the key industry influencers. The data thus presented is comprehensive, reliable, and the result of extensive research, both primary and secondary.

INFORMATION SOURCES

Primary sources

  • Manufacturers and suppliers
  • Channel partners
  • Industry experts
  • Strategic decision makers

Secondary sources

  • Industry journals and periodicals
  • Government data
  • Financial reports of key industry players
  • Historical data
  • Press releases

DATA ANALYSIS

Data Synthesis

  • Collation of data
  • Estimation of key figures
  • Analysis of derived insights

Data Validation

  • Triangulation with data models
  • Reference against proprietary databases
  • Corroboration with industry experts

REPORT WRITING

Qualitative

  • Market drivers
  • Market challenges
  • Market trends
  • Five forces analysis

Quantitative

  • Market size and forecast
  • Market segmentation
  • Geographical insights
  • Competitive landscape

Interested in this report?

Get your sample now to see our research methodology and insights!

Download Now

Frequently Asked Questions

Boat Rentals market growth will increase by USD 176.5 million during 2026-2030.

The Boat Rentals market is expected to grow at a CAGR of 8.6% during 2026-2030.

Boat Rentals market is segmented by Propulsion (Fuel powered, Electric boats, Others) Usage (Sailing and leisure, Fishing, Water sports, Others) Type (Motorboats, Sail boats, Yachts, Catamarans, Others) Mode of booking (Offline, Online)

BLUEWATER, Boatbookings, Boating Inc., Borrow A Boat, Camper and Nicholsons, CharterWorld, CLICK AND BOAT SAS, Denison Yachting, DREAM YACHT GROUP, Edmiston and Co., GETMYBOAT INC., GlobeSailor SAS, Le Boat, Navigare Yachting AB, Nigel Burgess Ltd., Sailo Inc., SamBoat, The Moorings, Tubber, Yachtico GmbH are a few of the key vendors in the Boat Rentals market.

North America will register the highest growth rate of 40.7% among the other regions. Therefore, the Boat Rentals market in North America is expected to garner significant business opportunities for the vendors during the forecast period.

US, Canada, Mexico, Italy, Spain, France, Greece, Croatia, UK, Australia, China, Japan, Thailand, Indonesia, New Zealand, Brazil, Argentina, Colombia, UAE, Saudi Arabia, South Africa, Egypt, Morocco

  • Digital platform penetration and peer-to-peer booking ecosystems is the driving factor this market.

The Boat Rentals market vendors should focus on grabbing business opportunities from the Propulsion segment as it accounted for the largest market share in the base year.
RIA - Research AI Assistant
Ask RIA