Biogas Market Analysis, Size, and Forecast 2026-2030: North America (US, Canada, and Mexico), APAC (China, India, and Japan), Europe (Germany, France, and Italy), Middle East and Africa (UAE, South Africa, and Saudi Arabia), South America (Brazil, Argentina, and Colombia), and Rest of World (ROW)

Biogas Market Analysis, Size, and Forecast 2026-2030:
North America (US, Canada, and Mexico), APAC (China, India, and Japan), Europe (Germany, France, and Italy), Middle East and Africa (UAE, South Africa, and Saudi Arabia), South America (Brazil, Argentina, and Colombia), and Rest of World (ROW)

Published: Nov 2026 298 Pages SKU: IRTNTR71300

Market Overview at a Glance

$21.08 B
Market Opportunity
5.9%
CAGR 2025 - 2030
41.9%
North America Growth
$20.87 B
Co-generation segment 2024

Biogas Market Size 2026-2030

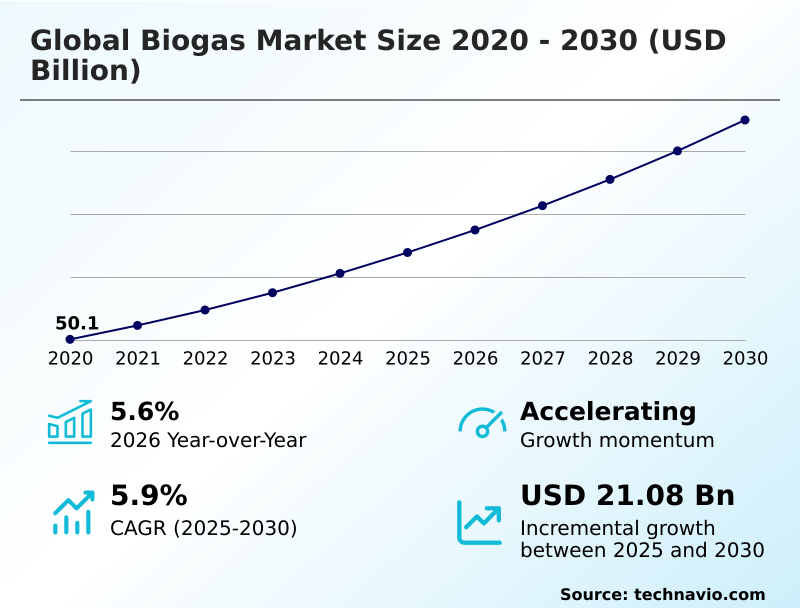
The biogas market size is valued to increase by USD 21.08 billion, at a CAGR of 5.9% from 2025 to 2030. Increased generation of municipal solid waste will drive the biogas market.

Major Market Trends & Insights

  • North America dominated the market and accounted for a 41.9% growth during the forecast period.
  • By Application - Co-generation segment was valued at USD 20.87 billion in 2024
  • By Source - Agricultural waste segment accounted for the largest market revenue share in 2024

Market Size & Forecast

  • Market Opportunities: USD 34.89 billion
  • Market Future Opportunities: USD 21.08 billion
  • CAGR from 2025 to 2030 : 5.9%

Market Summary

  • The Biogas Market demonstrates accelerating structural maturation, driven by the critical need to decarbonize intensive industrial processes and stabilize decentralized power grids. Expanding urbanization directly fuels municipal solid waste generation, acting as a powerful market driver by compelling municipalities to divert organic matter from overburdened disposal sites into energy recovery facilities.
  • For example, large-scale waste management operations routing agricultural and municipal effluents into anaerobic processing units have documented a 45% reduction in localized greenhouse gas emissions compared to traditional landfilling. However, the sector faces persistent operational challenges due to thermal intermittency, where temperature fluctuations impede bacterial fermentation rates and lower raw gas yields, constraining steady-state energy output.
  • To counter this, modern facilities invest in advanced thermal regulation to maintain continuous production. The transition toward high-purity renewable natural gas requires sophisticated upgrading infrastructure to remove trace contaminants, enabling seamless integration into existing pipeline networks. As regulatory frameworks increasingly penalize carbon-heavy fuels, the adoption of closed-loop energy systems becomes a fundamental compliance strategy for industrial operators.

What will be the Size of the Biogas Market during the forecast period?
Get Key Insights on Market Forecast (PDF) Get Free Sample

How is the Biogas Market Segmented?

The biogas industry research report provides comprehensive data (region-wise segment analysis), with forecasts and estimates in "USD million" for the period 2026-2030, as well as historical data from 2020-2024 for the following segments.

  • Application
    • Co-generation
    • Power generation
    • Heat in buildings
    • Upgraded to biomethane
  • Source
    • Agricultural waste
    • Landfill
    • Others
  • Feedstock
    • Organic residue and wastes
    • Energy crops
  • Geography
    • North America
      • US
      • Canada
      • Mexico
    • APAC
      • China
      • India
      • Japan
      • South Korea
      • Australia
      • Indonesia
    • Europe
      • Germany
      • France
      • Italy
      • UK
      • Spain
      • The Netherlands
    • Middle East and Africa
      • UAE
      • South Africa
      • Saudi Arabia
      • Egypt
      • Turkey
    • South America
      • Brazil
      • Argentina
      • Colombia

By Application Insights

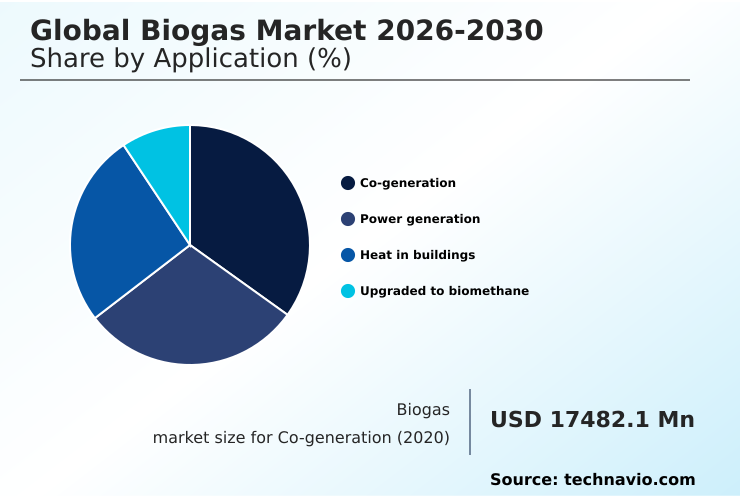
The co-generation segment is estimated to witness significant growth during the forecast period.

Co-generation systems represent a highly efficient operational pathway within the Biogas sector, fundamentally shifting decentralized energy production by capturing both thermal and electrical energy from biological breakdown.

Operations deploying combined heat and power frameworks report that overall energy conversion efficiency improves by 85% compared to isolated generation setups, drastically lowering external utility reliance.

Anaerobic digestion facilities utilize organic residue decomposition to sustain dispatchable energy, offering stable baseload power for industrial sites. Through advanced bio-methanation techniques, organizations optimize their off grid systems, ensuring continuous power supply during grid fluctuations.

This dual-output model maximizes resource utilization, allowing agricultural and municipal operators to streamline energy costs while maintaining strict operational continuity.
Get Free Sample

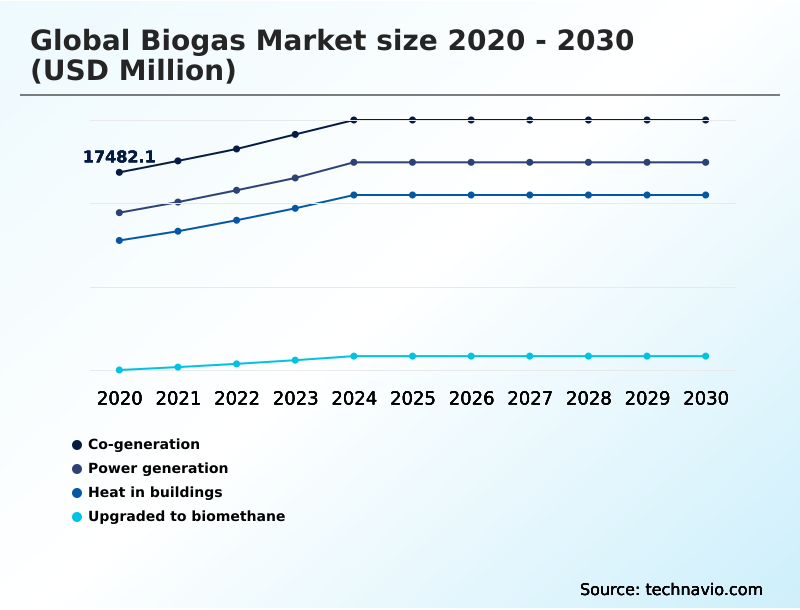
The Co-generation segment was valued at USD 20.87 billion in 2024 and showed a gradual increase during the forecast period.
Get Free Sample

Regional Analysis

North America is estimated to contribute 41.9% to the growth of the global market during the forecast period.Technavio’s analysts have elaborately explained the regional trends and drivers that shape the market during the forecast period.
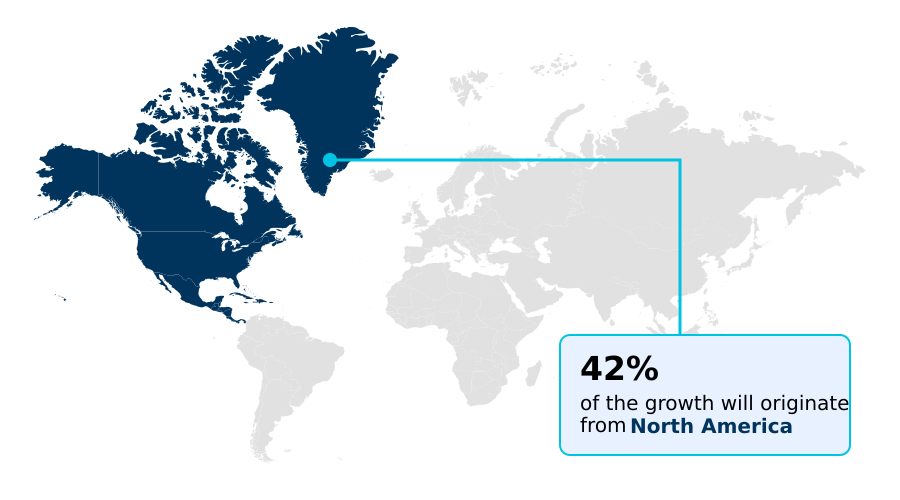
See How Biogas Market Demand is Rising in North America Get Free Sample

The geographic landscape of the Biogas sector reveals distinct regional adoption strategies driven by localized regulatory frameworks and feedstock availability. North America heavily prioritizes landfill gas recovery and transportation fuel applications, spurred by stringent low carbon intensity mandates.

Facilities in this region utilizing amine-based absorber technology report a 25% improvement in gas purification efficiency, enabling seamless pipeline integration. Conversely, Europe focuses on a comprehensive closed loop system approach, deeply integrating agricultural waste processing with bio-fertilizer extraction.

European operations leveraging advanced purepac membrane systems achieve a 35% higher nutrient recovery rate from digestate compared to their North American counterparts.

These operational discrepancies stem from Europe aggressive renewable fuel standards and circular economy directives, which mandate both energy generation and soil health restoration.

Consequently, European agribusinesses have reduced synthetic fertilizer reliance by 20%, whereas North American operators primarily optimize for raw energy output and emissions compliance.

Market Dynamics

Our researchers analyzed the data with 2025 as the base year, along with the key drivers, trends, and challenges. A holistic analysis of drivers will help companies refine their marketing strategies to gain a competitive advantage.

  • Modernizing energy infrastructure requires continuous innovation across biological and mechanical waste treatment frameworks. Facilities deploying anaerobic digestion thermal hydrolysis integration show superior processing speeds, handling dense agricultural inputs more effectively than standard mesophilic setups. Implementing specialized thermophilic bacteria organic waste breakdown allows operators to increase volatile solid destruction by 30%, directly enhancing raw gas yields.
  • As municipalities enforce stricter organic fraction municipal waste diversion, localized facilities rely on standardized municipal solid waste bio-methanation protocols to ensure consistent regulatory compliance. Agricultural hubs increasingly utilize the agricultural residue dry fermentation process to manage high-solid feedstocks, seamlessly feeding into decentralized combined heat and power units that offset facility energy consumption.
  • Concurrently, large disposal sites expand their landfill gas extraction well networks to capture fugitive emissions efficiently. Upgrading this raw output demands high-performance purification; thus, plants leverage membrane based biomethane upgrading systems and prioritize amine based absorber stripper optimization to eliminate corrosive contaminants.
  • Refining these gas streams maximizes pressure swing adsorption purification efficiency, ensuring the final output meets the rigorous purity standards required for renewable natural gas grid injection. In municipal sectors, wastewater sludge stabilization energy recovery minimizes disposal volumes while generating baseload power. Furthermore, integrating closed loop bio-fertilizer digestate utilization restores soil health, reducing synthetic input costs.
  • Ultimately, maximizing bio-methanation process emission reduction alongside refuse derived fuel thermal production creates a resilient, multi-tiered approach to sustainable waste valorization and industrial energy independence.
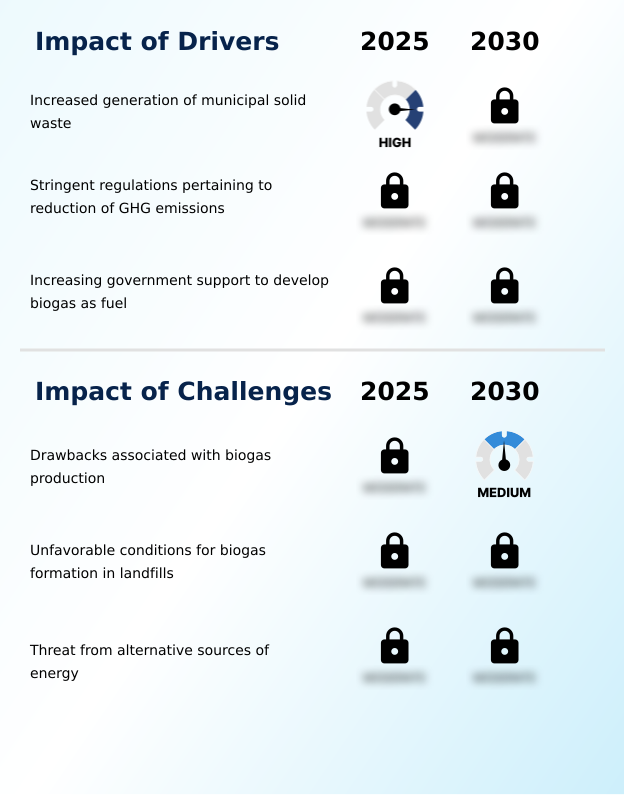
What are the key market drivers leading to the rise in the adoption of Biogas Industry?

  • The escalating global generation of municipal solid waste acts as a primary catalyst, necessitating advanced biological treatment solutions that propel the adoption of renewable energy recovery systems.

  • Escalating urbanization and strict landfill diversion mandates act as primary catalysts forcing municipalities to rethink municipal solid waste management.
  • To achieve circular economy compliance, industrial operators are aggressively scaling the biological treatment of the biogenic fraction found in urban and agricultural streams. Implementing the dry fermentation process for dense agricultural residue processing has increased operational throughput capacity by 25%.
  • This rapid shift toward comprehensive waste valorization allows facilities to generate both refuse-derived fuel and high-purity gas for direct biomethane injection. Furthermore, optimizing digestate valorization reduces synthetic fertilizer procurement costs by 15% for partnered agricultural operations.
  • By transforming waste liabilities into continuous revenue streams, organizations simultaneously achieve rigorous greenhouse gas mitigation targets and secure long-term energy independence against volatile fossil fuel markets.

What are the market trends shaping the Biogas Industry?

  • The integration of biogas as a direct piped gas for domestic and industrial applications represents a prominent market trend. This shift reduces reliance on conventional fossil fuels while enhancing decentralized energy distribution networks.

  • The industrial shift toward advanced biomethane upgrading fundamentally alters energy distribution landscapes as operators transition from localized power generation to high-value transportation fuels. Organizations are aggressively adopting membrane separation and water scrubbing technologies to remove trace impurities, improving overall gas desulfurization efficiency by 35%. This high-purity output meets strict grid injection protocols, allowing seamless blending with pipeline natural gas.
  • As commercial fleets pivot away from diesel, the demand for compressed natural gas and liquefied natural gas derived from organic sources has surged. By integrating carbon dioxide liquefaction into the purification process, facilities capture secondary byproducts, reducing total operational emissions by 20%.
  • This strategic pivot toward renewable natural gas production enables waste management entities to monetize outputs in lucrative carbon credit markets, driving sustainable infrastructure expansion and significantly lowering fleet fuel expenditures.

What challenges does the Biogas Industry face during its growth?

  • Inherent operational inefficiencies and high impurity levels in early-stage production processes present substantial technical challenges that restrain broader industrial integration.

  • Scaling sustainable energy transition infrastructure presents significant operational bottlenecks, primarily driven by feedstock inconsistencies and thermal sensitivity. Biological volatility within the organic fraction significantly hampers steady-state production; temperature fluctuations easily disrupt the delicate balance between thermophilic bacteria and mesophilic bacteria, causing sudden 20% drops in daily raw gas yields.
  • Upgrading heavy industrial wastewater treatment effluents requires expensive pretreatment phases, such as enzymatic hydrolysis and thermal hydrolysis, which increase initial capital expenditures by 30% compared to standard sludge stabilization methods. Furthermore, refining raw output demands energy-intensive pressure swing adsorption, draining facility power resources.
  • Despite rising landfill tipping fees that incentivize waste diversion, these high technical barriers and subsequent maintenance costs severely restrict mid-sized operators from maximizing profitability and maintaining continuous operational uptime.

Exclusive Technavio Analysis on Customer Landscape

The biogas market forecasting report includes the adoption lifecycle of the market, covering from the innovator’s stage to the laggard’s stage. It focuses on adoption rates in different regions based on penetration. Furthermore, the biogas market report also includes key purchase criteria and drivers of price sensitivity to help companies evaluate and develop their market growth analysis strategies.
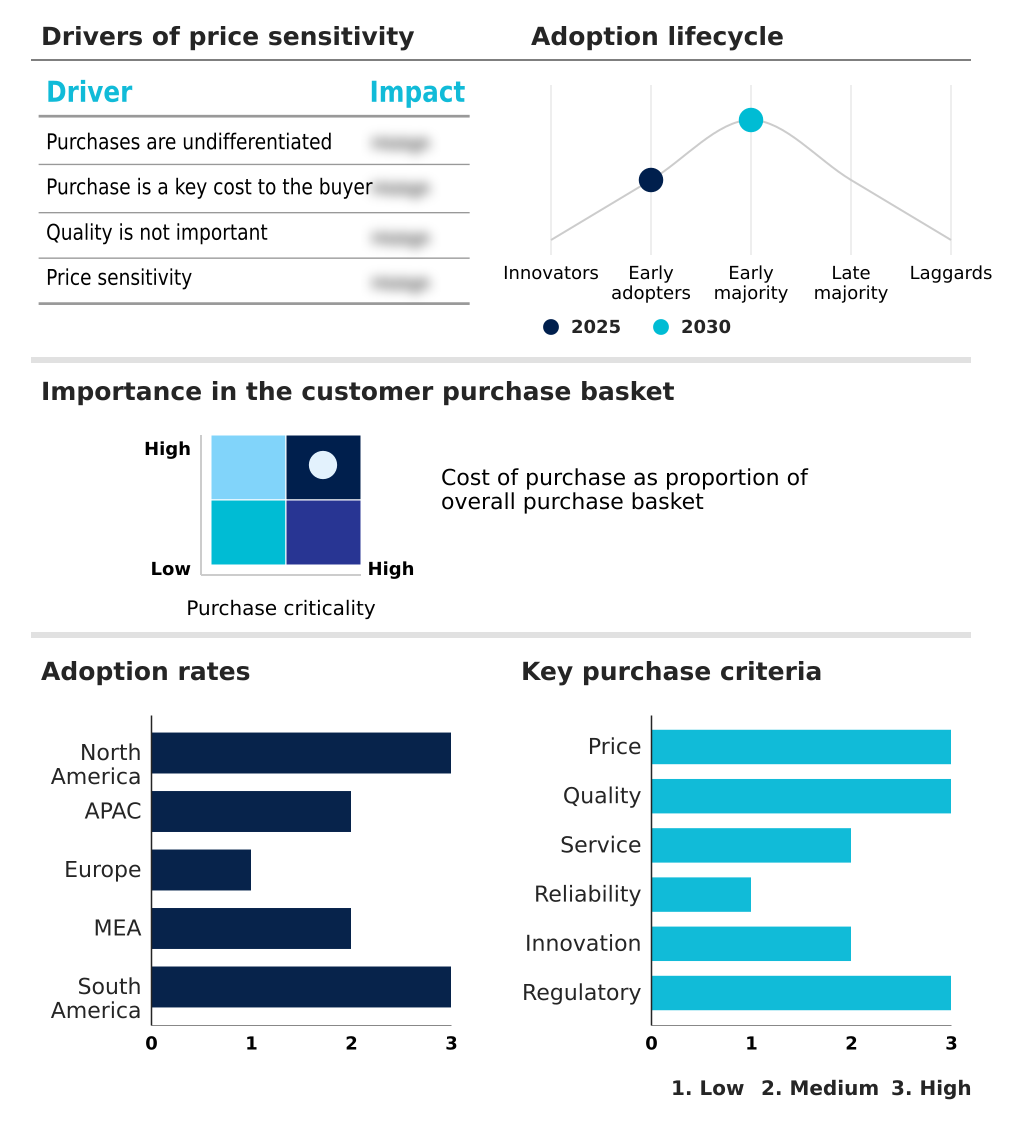
Customer Landscape of Biogas Industry

Competitive Landscape

Companies are implementing various strategies, such as strategic alliances, biogas market forecast, partnerships, mergers and acquisitions, geographical expansion, and product/service launches, to enhance their presence in the industry.

Air Liquide SA - Provides comprehensive biomethane purification solutions utilizing advanced filtration processes to eliminate pollutants, enabling seamless grid injection and renewable vehicle fuel production for sustainable energy transitions.

The industry research and growth report includes detailed analyses of the competitive landscape of the market and information about key companies, including:

  • Air Liquide SA
  • Ameresco Inc.
  • Ammongas A S
  • Bekon Energy Technologies Inc
  • Biofrigas Sweden AB
  • Biokraft AB
  • Bright Renewables B.V.
  • DMT International
  • EnviTec Biogas AG
  • Gasum Oy
  • Greenlane Renewables Inc.
  • HomeBiogas Ltd
  • HoSt Energy Systems
  • PlanET Biogastechnik GmbH
  • Schmack Biogas Srl
  • STRABAG Umwelttechnik GmbH
  • TotalEnergies SE
  • Verdant Biogas Co Ltd
  • Wartsila Corp.
  • WELTEC BIOPOWER GmbH

Qualitative and quantitative analysis of companies has been conducted to help clients understand the wider business environment as well as the strengths and weaknesses of key industry players. Data is qualitatively analyzed to categorize companies as pure play, category-focused, industry-focused, and diversified; it is quantitatively analyzed to categorize companies as dominant, leading, strong, tentative, and weak.

Recent Development and News in Biogas market

  • In the Renewable Electricity industry, the implementation of stringent carbon pricing mechanisms across European energy markets has elevated the cost of fossil-based power generation, directly driving industrial demand for Biogas as a carbon-neutral alternative.
  • The rapid expansion of decentralized microgrid infrastructure for rural electrification has shifted power distribution models, increasing the integration of Biogas baseload capacity to stabilize intermittent solar and wind outputs by 20%.
  • Stricter municipal solid waste diversion mandates within the circular economy framework have forced waste management operators to adopt biological treatment solutions, creating a reliable feedstock supply chain that enhances Biogas production capacity.
  • Advancements in membrane separation technologies for gas purification have reduced energy consumption during fuel upgrading by 15%, significantly improving the commercial viability of injecting Biogas into existing natural gas networks.

Dive into Technavio’s robust research methodology, blending expert interviews, extensive data synthesis, and validated models for unparalleled Biogas Market insights. See full methodology.

Market Scope
Page number 298
Base year 2025
Historic period 2020-2024
Forecast period 2026-2030
Growth momentum & CAGR Accelerate at a CAGR of 5.9%
Market growth 2026-2030 USD 21077.6 million
Market structure Fragmented
YoY growth 2025-2026(%) 5.6%
Key countries US, Canada, Mexico, China, India, Japan, South Korea, Australia, Indonesia, Germany, France, Italy, UK, Spain, The Netherlands, UAE, South Africa, Saudi Arabia, Egypt, Turkey, Brazil, Argentina and Colombia
Competitive landscape Leading Companies, Market Positioning of Companies, Competitive Strategies, and Industry Risks

Request Free Sample

Research Analyst Overview

  • Executive boards are increasingly prioritizing sustainable energy resilience by integrating advanced biological waste conversion technologies into core operational frameworks. The transition toward high-purity energy recovery dictates strict compliance and capital allocation strategies, particularly in the adoption of sophisticated pretreatment mechanisms like enzymatic hydrolysis and thermal hydrolysis.
  • These technologies accelerate feedstock degradation, enabling facilities to increase overall methane yield by 28% compared to conventional untreated digestion processes. Furthermore, stringent pipeline quality standards necessitate aggressive investments in gas desulfurization and carbon dioxide liquefaction. By deploying advanced purepac membrane filtration, operators achieve superior contaminant removal, directly facilitating seamless biomethane injection into public utility networks.
  • This strategic alignment with decarbonization mandates protects organizations from escalating carbon tax liabilities while opening new revenue streams through digestate valorization. Consequently, industrial leaders are shifting their energy procurement models, moving away from volatile fossil fuel dependencies toward internalized, closed-loop renewable gas production to ensure long-term operational stability and regulatory adherence.

What are the Key Data Covered in this Biogas Market Research and Growth Report?

  • What is the expected growth of the Biogas Market between 2026 and 2030?

    • USD 21.08 billion, at a CAGR of 5.9%

  • What segmentation does the market report cover?

    • The report is segmented by Application (Co-generation, Power generation, Heat in buildings, and Upgraded to biomethane), Source (Agricultural waste, Landfill, and Others), Feedstock (Organic residue and wastes, and Energy crops) and Geography (North America, APAC, Europe, Middle East and Africa, South America)

  • Which regions are analyzed in the report?

    • North America, APAC, Europe, Middle East and Africa and South America

  • What are the key growth drivers and market challenges?

    • Increased generation of municipal solid waste, Drawbacks associated with biogas production

  • Who are the major players in the Biogas Market?

    • Air Liquide SA, Ameresco Inc., Ammongas A S, Bekon Energy Technologies Inc, Biofrigas Sweden AB, Biokraft AB, Bright Renewables B.V., DMT International, EnviTec Biogas AG, Gasum Oy, Greenlane Renewables Inc., HomeBiogas Ltd, HoSt Energy Systems, PlanET Biogastechnik GmbH, Schmack Biogas Srl, STRABAG Umwelttechnik GmbH, TotalEnergies SE, Verdant Biogas Co Ltd, Wartsila Corp. and WELTEC BIOPOWER GmbH

Market Research Insights

  • The Biogas market is rapidly evolving as industrial operators prioritize energy transition infrastructure to meet aggressive decarbonization targets. Facilities transitioning to renewable natural gas experience a 30% reduction in compliance costs associated with greenhouse gas mitigation mandates. Furthermore, integrating combined heat and power systems has improved overall facility energy utilization efficiency by 40% compared to reliance on conventional grid electricity.
  • By adhering to emerging renewable fuel standards, municipal and agricultural producers effectively monetize waste streams. This shift toward circular economy compliance not only ensures regulatory alignment but also lowers long-term operational expenditures by 25%, solidifying sustainable energy recovery as a core strategic imperative for modern waste management.

We can help! Our analysts can customize this biogas market research report to meet your requirements.

Get in touch

1. Executive Summary

1.1 Market overview

Executive Summary - Chart on Market Overview
Executive Summary - Data Table on Market Overview
Executive Summary - Chart on Global Market Characteristics
Executive Summary - Chart on Market by Geography
Executive Summary - Chart on Market Segmentation by Application
Executive Summary - Chart on Market Segmentation by Source
Executive Summary - Chart on Market Segmentation by Feedstock
Executive Summary - Chart on Incremental Growth
Executive Summary - Data Table on Incremental Growth
Executive Summary - Chart on Company Market Positioning

2. Technavio Analysis

2.1 Analysis of price sensitivity, lifecycle, customer purchase basket, adoption rates, and purchase criteria

2.2 Criticality of inputs and Factors of differentiation

Chart on Overview on criticality of inputs and factors of differentiation

2.3 Factors of disruption

Chart on Overview on factors of disruption

2.4 Impact of drivers and challenges

Chart on Impact of drivers and challenges in 2025 and 2030

3. Market Landscape

3.1 Market ecosystem

Chart on Parent Market
Data Table on - Parent Market

3.2 Market characteristics

Chart on Market characteristics analysis

3.3 Value chain analysis

Chart on Value chain analysis

4. Market Sizing

4.1 Market definition

Data Table on Offerings of companies included in the market definition

4.2 Market segment analysis

Market segments

4.3 Market size 2025

4.4 Market outlook: Forecast for 2025-2030

Chart on Global - Market size and forecast 2025-2030 ($ million)
Data Table on Global - Market size and forecast 2025-2030 ($ million)
Chart on Global Market: Year-over-year growth 2025-2030 (%)
Data Table on Global Market: Year-over-year growth 2025-2030 (%)

5. Historic Market Size

5.1 Global Biogas Market 2020 - 2024

Historic Market Size - Data Table on Global Biogas Market 2020 - 2024 ($ million)

5.2 Application segment analysis 2020 - 2024

Historic Market Size - Application Segment 2020 - 2024 ($ million)

5.3 Source segment analysis 2020 - 2024

Historic Market Size - Source Segment 2020 - 2024 ($ million)

5.4 Feedstock segment analysis 2020 - 2024

Historic Market Size - Feedstock Segment 2020 - 2024 ($ million)

5.5 Geography segment analysis 2020 - 2024

Historic Market Size - Geography Segment 2020 - 2024 ($ million)

5.6 Country segment analysis 2020 - 2024

Historic Market Size - Country Segment 2020 - 2024 ($ million)

6. Qualitative Analysis

6.1 Impact of AI on Global Biogas Market

6.2 Impact of geopolitical conflicts on Global Biogas Market

7. Five Forces Analysis

7.1 Five forces summary

Five forces analysis - Comparison between 2025 and 2030

7.2 Bargaining power of buyers

Bargaining power of buyers - Impact of key factors 2025 and 2030

7.3 Bargaining power of suppliers

Bargaining power of suppliers - Impact of key factors in 2025 and 2030

7.4 Threat of new entrants

Threat of new entrants - Impact of key factors in 2025 and 2030

7.5 Threat of substitutes

Threat of substitutes - Impact of key factors in 2025 and 2030

7.6 Threat of rivalry

Threat of rivalry - Impact of key factors in 2025 and 2030

7.7 Market condition

Chart on Market condition - Five forces 2025 and 2030

8. Market Segmentation by Application

8.1 Market segments

Chart on Application - Market share 2025-2030 (%)
Data Table on Application - Market share 2025-2030 (%)

8.2 Comparison by Application

Chart on Comparison by Application
Data Table on Comparison by Application

8.3 Co-generation - Market size and forecast 2025-2030

Chart on Co-generation - Market size and forecast 2025-2030 ($ million)
Data Table on Co-generation - Market size and forecast 2025-2030 ($ million)
Chart on Co-generation - Year-over-year growth 2025-2030 (%)
Data Table on Co-generation - Year-over-year growth 2025-2030 (%)

8.4 Power generation - Market size and forecast 2025-2030

Chart on Power generation - Market size and forecast 2025-2030 ($ million)
Data Table on Power generation - Market size and forecast 2025-2030 ($ million)
Chart on Power generation - Year-over-year growth 2025-2030 (%)
Data Table on Power generation - Year-over-year growth 2025-2030 (%)

8.5 Heat in buildings - Market size and forecast 2025-2030

Chart on Heat in buildings - Market size and forecast 2025-2030 ($ million)
Data Table on Heat in buildings - Market size and forecast 2025-2030 ($ million)
Chart on Heat in buildings - Year-over-year growth 2025-2030 (%)
Data Table on Heat in buildings - Year-over-year growth 2025-2030 (%)

8.6 Upgraded to biomethane - Market size and forecast 2025-2030

Chart on Upgraded to biomethane - Market size and forecast 2025-2030 ($ million)
Data Table on Upgraded to biomethane - Market size and forecast 2025-2030 ($ million)
Chart on Upgraded to biomethane - Year-over-year growth 2025-2030 (%)
Data Table on Upgraded to biomethane - Year-over-year growth 2025-2030 (%)

8.7 Market opportunity by Application

Market opportunity by Application ($ million)
Data Table on Market opportunity by Application ($ million)

9. Market Segmentation by Source

9.1 Market segments

Chart on Source - Market share 2025-2030 (%)
Data Table on Source - Market share 2025-2030 (%)

9.2 Comparison by Source

Chart on Comparison by Source
Data Table on Comparison by Source

9.3 Agricultural waste - Market size and forecast 2025-2030

Chart on Agricultural waste - Market size and forecast 2025-2030 ($ million)
Data Table on Agricultural waste - Market size and forecast 2025-2030 ($ million)
Chart on Agricultural waste - Year-over-year growth 2025-2030 (%)
Data Table on Agricultural waste - Year-over-year growth 2025-2030 (%)

9.4 Landfill - Market size and forecast 2025-2030

Chart on Landfill - Market size and forecast 2025-2030 ($ million)
Data Table on Landfill - Market size and forecast 2025-2030 ($ million)
Chart on Landfill - Year-over-year growth 2025-2030 (%)
Data Table on Landfill - Year-over-year growth 2025-2030 (%)

9.5 Others - Market size and forecast 2025-2030

Chart on Others - Market size and forecast 2025-2030 ($ million)
Data Table on Others - Market size and forecast 2025-2030 ($ million)
Chart on Others - Year-over-year growth 2025-2030 (%)
Data Table on Others - Year-over-year growth 2025-2030 (%)

9.6 Market opportunity by Source

Market opportunity by Source ($ million)
Data Table on Market opportunity by Source ($ million)

10. Market Segmentation by Feedstock

10.1 Market segments

Chart on Feedstock - Market share 2025-2030 (%)
Data Table on Feedstock - Market share 2025-2030 (%)

10.2 Comparison by Feedstock

Chart on Comparison by Feedstock
Data Table on Comparison by Feedstock

10.3 Organic residue and wastes - Market size and forecast 2025-2030

Chart on Organic residue and wastes - Market size and forecast 2025-2030 ($ million)
Data Table on Organic residue and wastes - Market size and forecast 2025-2030 ($ million)
Chart on Organic residue and wastes - Year-over-year growth 2025-2030 (%)
Data Table on Organic residue and wastes - Year-over-year growth 2025-2030 (%)

10.4 Energy crops - Market size and forecast 2025-2030

Chart on Energy crops - Market size and forecast 2025-2030 ($ million)
Data Table on Energy crops - Market size and forecast 2025-2030 ($ million)
Chart on Energy crops - Year-over-year growth 2025-2030 (%)
Data Table on Energy crops - Year-over-year growth 2025-2030 (%)

10.5 Market opportunity by Feedstock

Market opportunity by Feedstock ($ million)
Data Table on Market opportunity by Feedstock ($ million)

11. Customer Landscape

11.1 Customer landscape overview

Analysis of price sensitivity, lifecycle, customer purchase basket, adoption rates, and purchase criteria

12. Geographic Landscape

12.1 Geographic segmentation

Chart on Market share by geography 2025-2030 (%)
Data Table on Market share by geography 2025-2030 (%)

12.2 Geographic comparison

Chart on Geographic comparison
Data Table on Geographic comparison

12.3 North America - Market size and forecast 2025-2030

Chart on North America - Market size and forecast 2025-2030 ($ million)
Data Table on North America - Market size and forecast 2025-2030 ($ million)
Chart on North America - Year-over-year growth 2025-2030 (%)
Data Table on North America - Year-over-year growth 2025-2030 (%)
Chart on Regional Comparison - North America
Data Table on Regional Comparison - North America

12.3.1 US - Market size and forecast 2025-2030

Chart on US - Market size and forecast 2025-2030 ($ million)
Data Table on US - Market size and forecast 2025-2030 ($ million)
Chart on US - Year-over-year growth 2025-2030 (%)
Data Table on US - Year-over-year growth 2025-2030 (%)

12.3.2 Canada - Market size and forecast 2025-2030

Chart on Canada - Market size and forecast 2025-2030 ($ million)
Data Table on Canada - Market size and forecast 2025-2030 ($ million)
Chart on Canada - Year-over-year growth 2025-2030 (%)
Data Table on Canada - Year-over-year growth 2025-2030 (%)

12.3.3 Mexico - Market size and forecast 2025-2030

Chart on Mexico - Market size and forecast 2025-2030 ($ million)
Data Table on Mexico - Market size and forecast 2025-2030 ($ million)
Chart on Mexico - Year-over-year growth 2025-2030 (%)
Data Table on Mexico - Year-over-year growth 2025-2030 (%)

12.4 APAC - Market size and forecast 2025-2030

Chart on APAC - Market size and forecast 2025-2030 ($ million)
Data Table on APAC - Market size and forecast 2025-2030 ($ million)
Chart on APAC - Year-over-year growth 2025-2030 (%)
Data Table on APAC - Year-over-year growth 2025-2030 (%)
Chart on Regional Comparison - APAC
Data Table on Regional Comparison - APAC

12.4.1 China - Market size and forecast 2025-2030

Chart on China - Market size and forecast 2025-2030 ($ million)
Data Table on China - Market size and forecast 2025-2030 ($ million)
Chart on China - Year-over-year growth 2025-2030 (%)
Data Table on China - Year-over-year growth 2025-2030 (%)

12.4.2 India - Market size and forecast 2025-2030

Chart on India - Market size and forecast 2025-2030 ($ million)
Data Table on India - Market size and forecast 2025-2030 ($ million)
Chart on India - Year-over-year growth 2025-2030 (%)
Data Table on India - Year-over-year growth 2025-2030 (%)

12.4.3 Japan - Market size and forecast 2025-2030

Chart on Japan - Market size and forecast 2025-2030 ($ million)
Data Table on Japan - Market size and forecast 2025-2030 ($ million)
Chart on Japan - Year-over-year growth 2025-2030 (%)
Data Table on Japan - Year-over-year growth 2025-2030 (%)

12.4.4 South Korea - Market size and forecast 2025-2030

Chart on South Korea - Market size and forecast 2025-2030 ($ million)
Data Table on South Korea - Market size and forecast 2025-2030 ($ million)
Chart on South Korea - Year-over-year growth 2025-2030 (%)
Data Table on South Korea - Year-over-year growth 2025-2030 (%)

12.4.5 Australia - Market size and forecast 2025-2030

Chart on Australia - Market size and forecast 2025-2030 ($ million)
Data Table on Australia - Market size and forecast 2025-2030 ($ million)
Chart on Australia - Year-over-year growth 2025-2030 (%)
Data Table on Australia - Year-over-year growth 2025-2030 (%)

12.4.6 Indonesia - Market size and forecast 2025-2030

Chart on Indonesia - Market size and forecast 2025-2030 ($ million)
Data Table on Indonesia - Market size and forecast 2025-2030 ($ million)
Chart on Indonesia - Year-over-year growth 2025-2030 (%)
Data Table on Indonesia - Year-over-year growth 2025-2030 (%)

12.5 Europe - Market size and forecast 2025-2030

Chart on Europe - Market size and forecast 2025-2030 ($ million)
Data Table on Europe - Market size and forecast 2025-2030 ($ million)
Chart on Europe - Year-over-year growth 2025-2030 (%)
Data Table on Europe - Year-over-year growth 2025-2030 (%)
Chart on Regional Comparison - Europe
Data Table on Regional Comparison - Europe

12.5.1 Germany - Market size and forecast 2025-2030

Chart on Germany - Market size and forecast 2025-2030 ($ million)
Data Table on Germany - Market size and forecast 2025-2030 ($ million)
Chart on Germany - Year-over-year growth 2025-2030 (%)
Data Table on Germany - Year-over-year growth 2025-2030 (%)

12.5.2 France - Market size and forecast 2025-2030

Chart on France - Market size and forecast 2025-2030 ($ million)
Data Table on France - Market size and forecast 2025-2030 ($ million)
Chart on France - Year-over-year growth 2025-2030 (%)
Data Table on France - Year-over-year growth 2025-2030 (%)

12.5.3 Italy - Market size and forecast 2025-2030

Chart on Italy - Market size and forecast 2025-2030 ($ million)
Data Table on Italy - Market size and forecast 2025-2030 ($ million)
Chart on Italy - Year-over-year growth 2025-2030 (%)
Data Table on Italy - Year-over-year growth 2025-2030 (%)

12.5.4 UK - Market size and forecast 2025-2030

Chart on UK - Market size and forecast 2025-2030 ($ million)
Data Table on UK - Market size and forecast 2025-2030 ($ million)
Chart on UK - Year-over-year growth 2025-2030 (%)
Data Table on UK - Year-over-year growth 2025-2030 (%)

12.5.5 Spain - Market size and forecast 2025-2030

Chart on Spain - Market size and forecast 2025-2030 ($ million)
Data Table on Spain - Market size and forecast 2025-2030 ($ million)
Chart on Spain - Year-over-year growth 2025-2030 (%)
Data Table on Spain - Year-over-year growth 2025-2030 (%)

12.5.6 The Netherlands - Market size and forecast 2025-2030

Chart on The Netherlands - Market size and forecast 2025-2030 ($ million)
Data Table on The Netherlands - Market size and forecast 2025-2030 ($ million)
Chart on The Netherlands - Year-over-year growth 2025-2030 (%)
Data Table on The Netherlands - Year-over-year growth 2025-2030 (%)

12.6 Middle East and Africa - Market size and forecast 2025-2030

Chart on Middle East and Africa - Market size and forecast 2025-2030 ($ million)
Data Table on Middle East and Africa - Market size and forecast 2025-2030 ($ million)
Chart on Middle East and Africa - Year-over-year growth 2025-2030 (%)
Data Table on Middle East and Africa - Year-over-year growth 2025-2030 (%)
Chart on Regional Comparison - Middle East and Africa
Data Table on Regional Comparison - Middle East and Africa

12.6.1 UAE - Market size and forecast 2025-2030

Chart on UAE - Market size and forecast 2025-2030 ($ million)
Data Table on UAE - Market size and forecast 2025-2030 ($ million)
Chart on UAE - Year-over-year growth 2025-2030 (%)
Data Table on UAE - Year-over-year growth 2025-2030 (%)

12.6.2 South Africa - Market size and forecast 2025-2030

Chart on South Africa - Market size and forecast 2025-2030 ($ million)
Data Table on South Africa - Market size and forecast 2025-2030 ($ million)
Chart on South Africa - Year-over-year growth 2025-2030 (%)
Data Table on South Africa - Year-over-year growth 2025-2030 (%)

12.6.3 Saudi Arabia - Market size and forecast 2025-2030

Chart on Saudi Arabia - Market size and forecast 2025-2030 ($ million)
Data Table on Saudi Arabia - Market size and forecast 2025-2030 ($ million)
Chart on Saudi Arabia - Year-over-year growth 2025-2030 (%)
Data Table on Saudi Arabia - Year-over-year growth 2025-2030 (%)

12.6.4 Egypt - Market size and forecast 2025-2030

Chart on Egypt - Market size and forecast 2025-2030 ($ million)
Data Table on Egypt - Market size and forecast 2025-2030 ($ million)
Chart on Egypt - Year-over-year growth 2025-2030 (%)
Data Table on Egypt - Year-over-year growth 2025-2030 (%)

12.6.5 Turkey - Market size and forecast 2025-2030

Chart on Turkey - Market size and forecast 2025-2030 ($ million)
Data Table on Turkey - Market size and forecast 2025-2030 ($ million)
Chart on Turkey - Year-over-year growth 2025-2030 (%)
Data Table on Turkey - Year-over-year growth 2025-2030 (%)

12.7 South America - Market size and forecast 2025-2030

Chart on South America - Market size and forecast 2025-2030 ($ million)
Data Table on South America - Market size and forecast 2025-2030 ($ million)
Chart on South America - Year-over-year growth 2025-2030 (%)
Data Table on South America - Year-over-year growth 2025-2030 (%)
Chart on Regional Comparison - South America
Data Table on Regional Comparison - South America

12.7.1 Brazil - Market size and forecast 2025-2030

Chart on Brazil - Market size and forecast 2025-2030 ($ million)
Data Table on Brazil - Market size and forecast 2025-2030 ($ million)
Chart on Brazil - Year-over-year growth 2025-2030 (%)
Data Table on Brazil - Year-over-year growth 2025-2030 (%)

12.7.2 Argentina - Market size and forecast 2025-2030

Chart on Argentina - Market size and forecast 2025-2030 ($ million)
Data Table on Argentina - Market size and forecast 2025-2030 ($ million)
Chart on Argentina - Year-over-year growth 2025-2030 (%)
Data Table on Argentina - Year-over-year growth 2025-2030 (%)

12.7.3 Colombia - Market size and forecast 2025-2030

Chart on Colombia - Market size and forecast 2025-2030 ($ million)
Data Table on Colombia - Market size and forecast 2025-2030 ($ million)
Chart on Colombia - Year-over-year growth 2025-2030 (%)
Data Table on Colombia - Year-over-year growth 2025-2030 (%)

12.8 Market opportunity by geography

Market opportunity by geography ($ million)
Data Tables on Market opportunity by geography ($ million)

13. Drivers, Challenges, and Opportunity

13.1 Market drivers

Increased generation of municipal solid waste
Stringent regulations pertaining to reduction of GHG emissions
Increasing government support to develop biogas as fuel

13.2 Market challenges

Drawbacks associated with biogas production
Unfavorable conditions for biogas formation in landfills
Threat from alternative sources of energy

13.3 Impact of drivers and challenges

Impact of drivers and challenges in 2025 and 2030

13.4 Market opportunities

Increased use of biogas as piped gas
Integrated waste management system
Decline in coal-based power generation

14. Competitive Landscape

14.1 Overview

14.2

Overview on criticality of inputs and factors of differentiation

14.3 Landscape disruption

Overview on factors of disruption

14.4 Industry risks

Impact of key risks on business

15. Competitive Analysis

15.1 Companies profiled

Companies covered

15.2 Company ranking index

15.3 Market positioning of companies

Matrix on companies position and classification

15.4 Air Liquide SA

Air Liquide SA - Overview
Air Liquide SA - Business segments
Air Liquide SA - Key news
Air Liquide SA - Key offerings
Air Liquide SA - Segment focus
SWOT

15.5 Ameresco Inc.

Ameresco Inc. - Overview
Ameresco Inc. - Business segments
Ameresco Inc. - Key offerings
Ameresco Inc. - Segment focus
SWOT

15.6 Ammongas A S

Ammongas A S - Overview
Ammongas A S - Product / Service
Ammongas A S - Key offerings
SWOT

15.7 Bekon Energy Technologies Inc

Bekon Energy Technologies Inc - Overview
Bekon Energy Technologies Inc - Product / Service
Bekon Energy Technologies Inc - Key offerings
SWOT

15.8 Bright Renewables B.V.

Bright Renewables B.V. - Overview
Bright Renewables B.V. - Product / Service
Bright Renewables B.V. - Key offerings
SWOT

15.9 DMT International

DMT International - Overview
DMT International - Product / Service
DMT International - Key offerings
SWOT

15.10 EnviTec Biogas AG

EnviTec Biogas AG - Overview
EnviTec Biogas AG - Product / Service
EnviTec Biogas AG - Key news
EnviTec Biogas AG - Key offerings
SWOT

15.11 Greenlane Renewables Inc.

Greenlane Renewables Inc. - Overview
Greenlane Renewables Inc. - Product / Service
Greenlane Renewables Inc. - Key news
Greenlane Renewables Inc. - Key offerings
SWOT

15.12 HoSt Energy Systems

HoSt Energy Systems - Overview
HoSt Energy Systems - Product / Service
HoSt Energy Systems - Key offerings
SWOT

15.13 PlanET Biogastechnik GmbH

PlanET Biogastechnik GmbH - Overview
PlanET Biogastechnik GmbH - Product / Service
PlanET Biogastechnik GmbH - Key offerings
SWOT

15.14 Schmack Biogas Srl

Schmack Biogas Srl - Overview
Schmack Biogas Srl - Product / Service
Schmack Biogas Srl - Key offerings
SWOT

15.15 TotalEnergies SE

TotalEnergies SE - Overview
TotalEnergies SE - Business segments
TotalEnergies SE - Key news
TotalEnergies SE - Key offerings
TotalEnergies SE - Segment focus
SWOT

15.16 Verdant Biogas Co Ltd

Verdant Biogas Co Ltd - Overview
Verdant Biogas Co Ltd - Product / Service
Verdant Biogas Co Ltd - Key offerings
SWOT

15.17 Wartsila Corp.

Wartsila Corp. - Overview
Wartsila Corp. - Business segments
Wartsila Corp. - Key news
Wartsila Corp. - Key offerings
Wartsila Corp. - Segment focus
SWOT

15.18 WELTEC BIOPOWER GmbH

WELTEC BIOPOWER GmbH - Overview
WELTEC BIOPOWER GmbH - Product / Service
WELTEC BIOPOWER GmbH - Key offerings
SWOT

16. Appendix

16.1 Scope of the report

Market definition
Objectives
Notes and caveats

16.2 Inclusions and exclusions checklist

Inclusions checklist
Exclusions checklist

16.3 Currency conversion rates for US$

16.4 Research methodology

16.5 Data procurement

Information sources

16.6 Data validation

16.7 Validation techniques employed for market sizing

16.8 Data synthesis

16.9 360 degree market analysis

16.10 List of abbreviations

Research Methodology

Technavio presents a detailed picture of the market by way of study, synthesis, and summation of data from multiple sources. The analysts have presented the various facets of the market with a particular focus on identifying the key industry influencers. The data thus presented is comprehensive, reliable, and the result of extensive research, both primary and secondary.

INFORMATION SOURCES

Primary sources

  • Manufacturers and suppliers
  • Channel partners
  • Industry experts
  • Strategic decision makers

Secondary sources

  • Industry journals and periodicals
  • Government data
  • Financial reports of key industry players
  • Historical data
  • Press releases

DATA ANALYSIS

Data Synthesis

  • Collation of data
  • Estimation of key figures
  • Analysis of derived insights

Data Validation

  • Triangulation with data models
  • Reference against proprietary databases
  • Corroboration with industry experts

REPORT WRITING

Qualitative

  • Market drivers
  • Market challenges
  • Market trends
  • Five forces analysis

Quantitative

  • Market size and forecast
  • Market segmentation
  • Geographical insights
  • Competitive landscape

Interested in this report?

Get your sample now to see our research methodology and insights!

Download Now

Frequently Asked Questions

Biogas market growth will increase by USD 21077.6 million during 2026-2030.

The Biogas market is expected to grow at a CAGR of 5.9% during 2026-2030.

Biogas market is segmented by Application (Co-generation, Power generation, Heat in buildings, Upgraded to biomethane) Source (Agricultural waste, Landfill, Others) Feedstock (Organic residue and wastes, Energy crops)

Air Liquide SA, Ameresco Inc., Ammongas A S, Bekon Energy Technologies Inc, Biofrigas Sweden AB, Biokraft AB, Bright Renewables B.V., DMT International, EnviTec Biogas AG, Gasum Oy, Greenlane Renewables Inc., HomeBiogas Ltd, HoSt Energy Systems, PlanET Biogastechnik GmbH, Schmack Biogas Srl, STRABAG Umwelttechnik GmbH, TotalEnergies SE, Verdant Biogas Co Ltd, Wartsila Corp., WELTEC BIOPOWER GmbH are a few of the key vendors in the Biogas market.

North America will register the highest growth rate of 41.9% among the other regions. Therefore, the Biogas market in North America is expected to garner significant business opportunities for the vendors during the forecast period.

US, Canada, Mexico, China, India, Japan, South Korea, Australia, Indonesia, Germany, France, Italy, UK, Spain, The Netherlands, UAE, South Africa, Saudi Arabia, Egypt, Turkey, Brazil, Argentina, Colombia

  • Increased generation of municipal solid waste is the driving factor this market.

The Biogas market vendors should focus on grabbing business opportunities from the Application segment as it accounted for the largest market share in the base year.
RIA - Research AI Assistant
Ask RIA