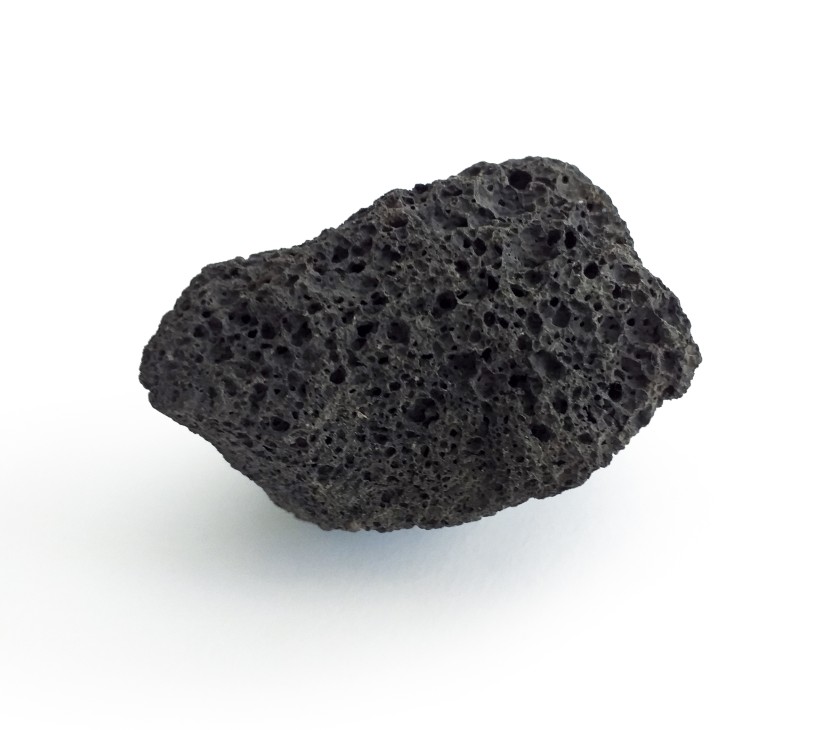
Basalt Rock Market Analysis, Size, and Forecast 2026-2030: APAC (China, Japan, and India), Europe (Germany, UK, and France), North America (US, Canada, and Mexico), South America (Brazil, Argentina, and Chile), Middle East and Africa (Saudi Arabia, UAE, and South Africa), and Rest of World (ROW)

Basalt Rock Market Analysis, Size, and Forecast 2026-2030:
APAC (China, Japan, and India), Europe (Germany, UK, and France), North America (US, Canada, and Mexico), South America (Brazil, Argentina, and Chile), Middle East and Africa (Saudi Arabia, UAE, and South Africa), and Rest of World (ROW)

Published: Nov 2026 302 Pages SKU: IRTNTR81134

Market Overview at a Glance

$907 Mn
Market Opportunity
7.5%
CAGR 2025 - 2030
53.2%
APAC Growth
$1.80 B
Natural basalt segment 2024

Basalt Rock Market Size 2026-2030

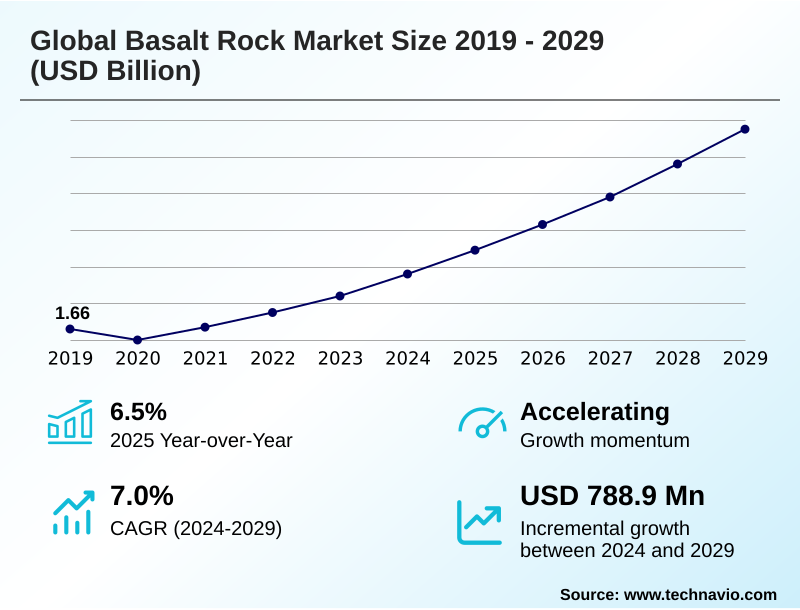
The basalt rock market size is valued to increase by USD 907 million, at a CAGR of 7.5% from 2025 to 2030. Wind energy blade component reinforcement acceleration will drive the basalt rock market.

Major Market Trends & Insights

  • APAC dominated the market and accounted for a 53.2% growth during the forecast period.
  • By Type - Natural basalt segment was valued at USD 1.80 billion in 2024
  • By End-user - Building and construction segment accounted for the largest market revenue share in 2024

Market Size & Forecast

  • Market Opportunities: USD 1.39 billion
  • Market Future Opportunities: USD 907 million
  • CAGR from 2025 to 2030 : 7.5%

Market Summary

  • The Basalt Rock Market exhibits strong upward momentum driven by structural shifts across civil engineering, renewable energy infrastructure, and advanced material sciences. Industrial manufacturers are rapidly pivoting from carbon-intensive synthetics toward naturally derived volcanic composites that deliver superior mechanical longevity.
  • For instance, in marine port expansions, project managers replacing conventional steel with basalt composite grids have realized a 40% reduction in life-cycle maintenance costs over a fifty-year structural lifespan. A primary driver propelling this sector is the acceleration of wind energy blade component reinforcement, where offshore developers require high-strength, fatigue-resistant materials to maximize turbine energy capture.
  • Conversely, high capital requirements for specialized furnace retrofitting and platinum-alloy extrusion equipment pose significant barriers, restricting rapid capacity scaling for smaller regional processors. The inherent moisture and salt corrosion resistance of basalt composites makes them uniquely suited for demanding coastal installations.
  • Strategic investments in localized quarrying and emission-free melting technologies continue to optimize supply chains, ensuring high-performance mineral fibers remain a highly competitive alternative in modern industrial construction.

What will be the Size of the Basalt Rock Market during the forecast period?
Get Key Insights on Market Forecast (PDF) Get Free Sample

How is the Basalt Rock Market Segmented?

The basalt rock industry research report provides comprehensive data (region-wise segment analysis), with forecasts and estimates in "USD million" for the period 2026-2030, as well as historical data from 2020-2024 for the following segments.

  • Type
    • Natural basalt
    • Synthetic basalt
  • End-user
    • Building and construction
    • Infrastructure
    • Automotive and transportation
    • Aerospace and defense
    • Others
  • Product type
    • Basalt fiber
    • Basalt aggregates
    • Basalt tiles or slabs
    • Others
  • Geography
    • APAC
      • China
      • Japan
      • India
      • South Korea
      • Australia
      • Indonesia
    • Europe
      • Germany
      • UK
      • France
      • Italy
      • Spain
      • The Netherlands
    • North America
      • US
      • Canada
      • Mexico
    • South America
      • Brazil
      • Argentina
      • Chile
    • Middle East and Africa
      • Saudi Arabia
      • UAE
      • South Africa
      • Turkey
      • Israel

By Type Insights

The natural basalt segment is estimated to witness significant growth during the forecast period.

The natural segment of the Basalt Rock Market serves as the foundational material for heavy civil infrastructure and advanced composite manufacturing.

Extracted directly from volcanic deposits, this highly durable igneous rock is critical for high-load foundations, coastal erosion barriers, and structural composite matrix formulations.

Facilities processing this raw material into continuous basalt fiber have achieved a 15% improvement in extrusion efficiency when utilizing advanced platinum rhodium bushing technology.

This raw aggregate is essential for deep subsurface energy infrastructure and offshore wind turbine structures supporting the broader clean energy expansion. By providing superior resistance to severe chloride ion exposure, natural basalt outlasts traditional metallic reinforcements in marine environments.

The adoption of basalt fiber reinforced polymer components and thermal insulation panels derived from natural stone accelerates industrial decarbonization, enhancing long-term operational resilience without relying on synthetic chemical binders.
Get Free Sample

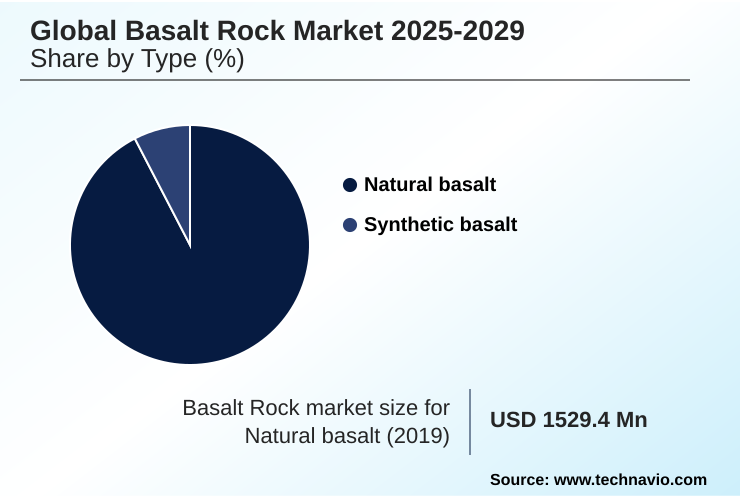
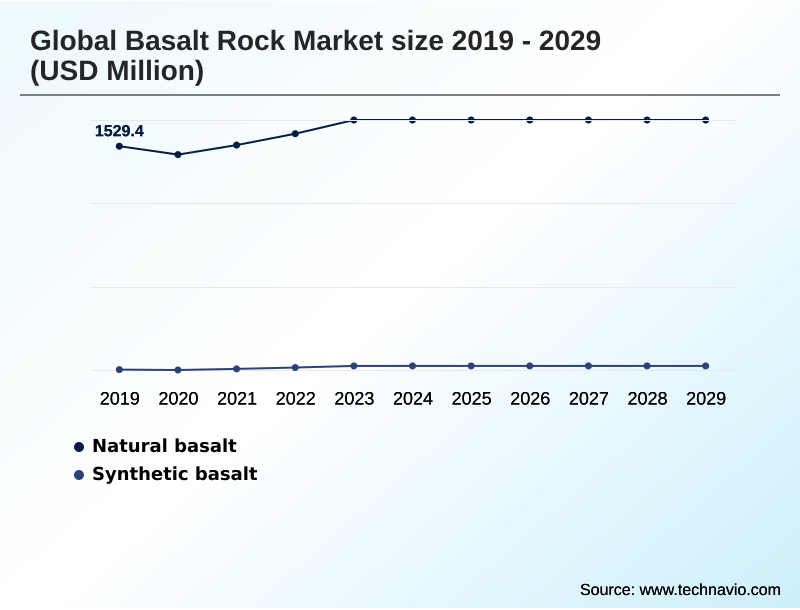
The Natural basalt segment was valued at USD 1.80 billion in 2024 and showed a gradual increase during the forecast period.
Get Free Sample

Regional Analysis

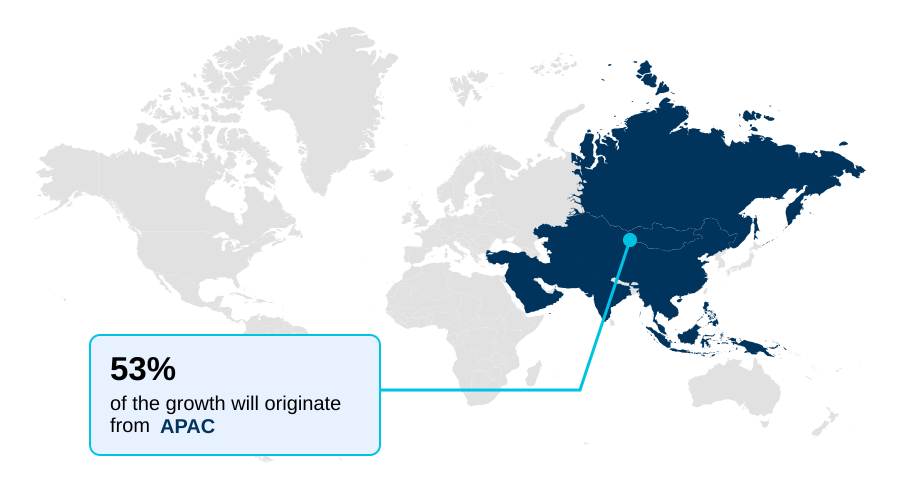
APAC is estimated to contribute 53.2% to the growth of the global market during the forecast period.Technavio’s analysts have elaborately explained the regional trends and drivers that shape the market during the forecast period.
See How Basalt Rock Market Demand is Rising in APAC Get Free Sample

APAC commands the dominant position in the Basalt Rock Market, operating massive extraction networks and advanced processing lines that outpace European production volumes by a 3-to-1 margin.

This production density allows Asian manufacturers to reduce raw material logistics costs by up to 25%, aggressively supplying basalt fiber rovings for domestic high-speed rail and infrastructure mega-projects.

Conversely, the European market exhibits a higher penetration rate of high temperature filtration systems and non asbestos organic friction components, prioritizing stringent carbon reduction compliance over bulk aggregate consumption.

European facilities utilizing automated sorting systems have improved flexural toughness enhancement in precast concrete by 18%. Furthermore, structural engineers across coastal APAC regions increasingly mandate non-corrosive rebars boasting superior electrochemical corrosion resistance and high flexural strength, mitigating saltwater decay.

This regional divergence highlights how Asian supply chains focus on volumetric scale and coastal infrastructure, while Europe advances specialized acoustic vibration absorption and dielectric constant transparency applications for aerospace and automotive sectors.

Market Dynamics

Our researchers analyzed the data with 2025 as the base year, along with the key drivers, trends, and challenges. A holistic analysis of drivers will help companies refine their marketing strategies to gain a competitive advantage.

  • The integration of specialized volcanic mineral derivatives fundamentally redefines operational planning and long-term asset management across heavy industrial sectors. Procurement teams increasingly favor continuous basalt fiber composite rebar over traditional epoxy-coated steel, finding that the former offers substantially superior fatigue resistance and completely eliminates the risk of concrete spalling in damp environments.
  • In marine engineering applications, the deployment of non corrosive marine infrastructure reinforcement extends the reliable service life of port facilities and sea walls by a ratio of nearly two to one when compared to legacy metallic grid systems, dramatically lowering future rehabilitation liabilities.
  • Industrial processing plants also recognize the operational necessity of integrating high temperature structural thermal insulation to line petrochemical furnaces and high-pressure steam pipelines, ensuring strict regulatory compliance regarding workplace heat exposure while preventing radiant energy loss.
  • Simultaneously, modern construction technology rapidly adopts automated structural concrete extrusion printing, wherein micro-chopped volcanic fibers are injected directly into printing mortars to prevent shrinkage cracking and enhance inter-layer adhesion without clogging robotic nozzles.
  • Beyond the built environment, the agricultural sector aggressively implements volcanic rock dust soil remineralization programs to organically balance soil pH and restore depleted micronutrients, facilitating robust crop yields. By embracing these advanced material solutions, supply chain managers achieve superior structural durability and environmental compliance, rendering conventional synthetic and metallic materials obsolete across critical performance applications.
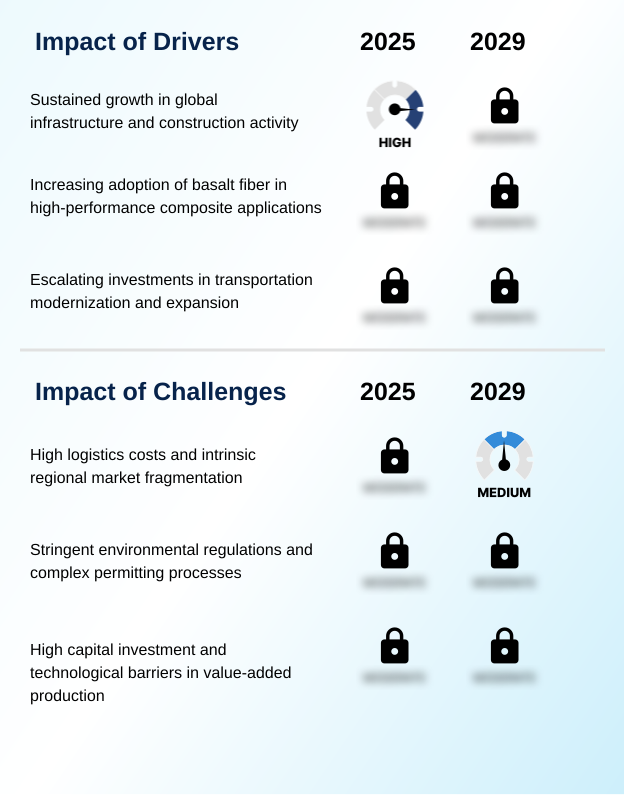
What are the key market drivers leading to the rise in the adoption of Basalt Rock Industry?

  • The acceleration of wind energy blade component reinforcement heavily drives market expansion as developers seek high-strength, fatigue-resistant mineral composites to maximize the operational lifespan of offshore turbine structures.

  • Escalating investments in offshore wind energy and industrial decarbonization act as primary demand triggers for resilient volcanic rock composites. Original equipment manufacturers fabricating massive offshore turbine blades must ensure optimal structural integrity maintenance under extreme maritime turbulence.
  • By replacing traditional fiberglass with continuous mineral filaments possessing high fatigue resistance, blade manufacturers have extended component operational lifespans by up to 25%, simultaneously reducing blade weight by 10%.
  • Furthermore, tightening industrial safety codes force petrochemical facilities to transition toward non hazardous mineral alternatives to secure reliable passive fire protection around high-pressure pipelines.
  • The implementation of precision automated sorting systems within sustainable composite manufacturing workflows ensures highly uniform mineral chemistry, allowing industrial operators to slash material defect rates by 15% and aggressively drive down life-cycle maintenance expenditures.

What are the market trends shaping the Basalt Rock Industry?

  • The integration of advanced aerospace thermal protection systems and lightweight defense hardware represents a highly specialized application driving new demand avenues. Engineers increasingly specify volcanic mineral composites to ensure structural stability and electromagnetic neutrality under extreme operational stresses.

  • The integration of advanced geothermal wellbore technology and 3D architectural printing represents a profound adoption shift across modern industrial construction. Energy developers operating in aggressive subterranean conditions increasingly inject basalt aggregate slurry into well cements, a process that improves zonal isolation efficiency by 22% compared to standard silica mixes.
  • Because extreme subsurface heat and acidic fluids rapidly degrade standard metallic casings, drilling operators mandate non corrosive structural reinforcement to prevent catastrophic well failure. The optimization of continuous filament attenuation techniques enables manufacturers to produce superior high temperature thermal barrier textiles and mineral wool insulation with lower energy consumption, achieving a 40% carbon footprint reduction relative to glass fiber manufacturing.
  • This structural material evolution guarantees long-term performance under severe alkaline environment exposure, directly allowing heavy industries to maximize operational uptime while adhering to stringent environmental construction codes.

What challenges does the Basalt Rock Industry face during its growth?

  • High capital requirements and the extensive costs associated with specialized furnace retrofitting present substantial financial barriers that limit rapid manufacturing capacity expansion for continuous fiber production.

  • High initial capital requirements and inconsistent raw mineral chemistry present severe structural limitations for scaling high-performance composite production. Establishing a modern melting facility capable of extreme heat management requires specialized platinum-alloy bushings that elevate upfront equipment costs by nearly 45% compared to conventional glass fiber plants.
  • Because natural volcanic rock exhibits significant chemical variability across different quarry locations, maintaining uniform viscosity during extrusion becomes technically complex. This chemical inconsistency causes unexpected filament breakage, increasing production line downtime by up to 20% if not heavily monitored.
  • Consequently, manufacturers struggle to guarantee the strict tensile specifications required for extreme thermal shock endurance and electromagnetic interference shielding in aerospace components. These production bottlenecks inflate life cycle operational expenditure for processors, ultimately restricting the widespread commercialization of advanced structural rebars.

Exclusive Technavio Analysis on Customer Landscape

The basalt rock market forecasting report includes the adoption lifecycle of the market, covering from the innovator’s stage to the laggard’s stage. It focuses on adoption rates in different regions based on penetration. Furthermore, the basalt rock market report also includes key purchase criteria and drivers of price sensitivity to help companies evaluate and develop their market growth analysis strategies.
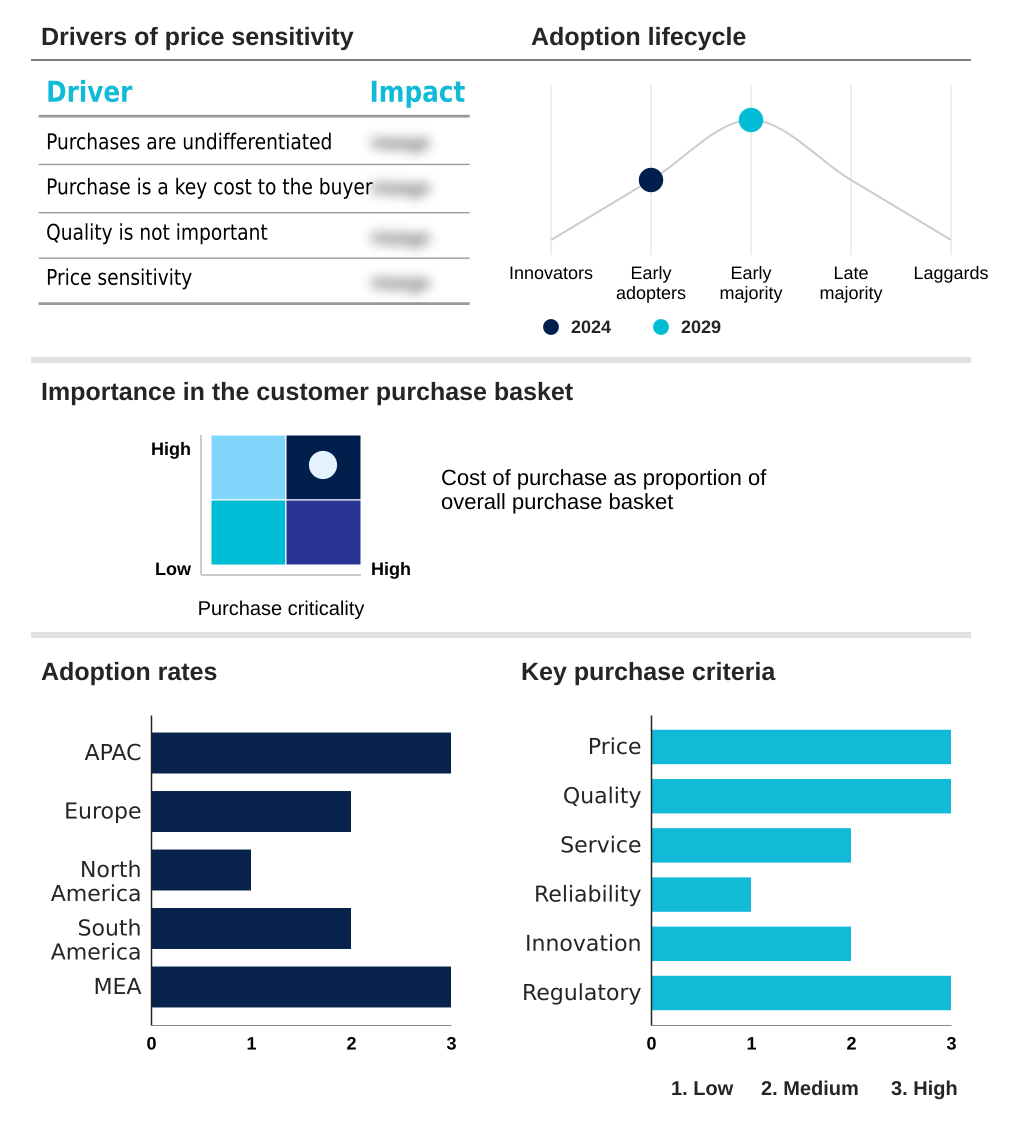
Customer Landscape of Basalt Rock Industry

Competitive Landscape

Companies are implementing various strategies, such as strategic alliances, basalt rock market forecast, partnerships, mergers and acquisitions, geographical expansion, and product/service launches, to enhance their presence in the industry.

Arab Basalt Fiber Co - Advanced continuous basalt fiber products provide superior tensile strength and thermal stability, offering a highly durable, non-corrosive reinforcement solution optimized for high-performance industrial construction and civil engineering applications.

The industry research and growth report includes detailed analyses of the competitive landscape of the market and information about key companies, including:

  • Arab Basalt Fiber Co
  • Aravali India Marbles
  • ArmBasfiber LLC
  • Arrow Technical Textiles Ltd.
  • Basalt Engineering Corp
  • Basalt Engineering LLC
  • Basalt Fiber China
  • Basalt Fiber Tech
  • Basalt International
  • BASALTEX NV
  • Deutsche Basalt Faser GmbH
  • Hebei Yuniu Fiberglass
  • HG GBF Basalt Fiber Co. Ltd.
  • INCOTELOGY GmbH
  • ISOMATEX SA
  • Kamenny Vek
  • Lavaintel
  • Mafic USA
  • MagmaTech Ltd
  • Technobasalt LLC

Qualitative and quantitative analysis of companies has been conducted to help clients understand the wider business environment as well as the strengths and weaknesses of key industry players. Data is qualitatively analyzed to categorize companies as pure play, category-focused, industry-focused, and diversified; it is quantitatively analyzed to categorize companies as dominant, leading, strong, tentative, and weak.

Recent Development and News in Basalt rock market

  • In the Specialty Chemicals industry, the shift toward zero-emission mineral processing and industrial decarbonization has accelerated the adoption of electric induction furnaces, directly impacting Basalt Rock demand by enabling the sustainable production of continuous filament fibers with extreme thermal shock endurance for aerospace composites.
  • Strict maritime regulatory frameworks targeting severe chloride ion exposure and infrastructure degradation have mandated the use of non-metallic, high alkali resistance structural materials, significantly increasing the procurement of non hazardous mineral alternatives like basalt composite rebars for coastal defense projects.
  • Advancements in automated industrial concrete extrusion and 3D printing mortars require micro-reinforcement additives that maintain structural integrity maintenance during rapid curing, driving the consumption of chopped basalt fibers that offer superior flexural strength compared to traditional synthetic binders.
  • The rapid expansion of electric vehicle manufacturing and battery safety compliance protocols necessitates advanced electromagnetic interference shielding and thermal barrier coatings, pushing automotive OEMs to integrate high-density basalt wool and fiber textiles to reduce overall life cycle operational expenditure while ensuring passive fire protection.

Dive into Technavio’s robust research methodology, blending expert interviews, extensive data synthesis, and validated models for unparalleled Basalt Rock Market insights. See full methodology.

Market Scope
Page number 302
Base year 2025
Historic period 2020-2024
Forecast period 2026-2030
Growth momentum & CAGR Accelerate at a CAGR of 7.5%
Market growth 2026-2030 USD 907.0 million
Market structure Fragmented
YoY growth 2025-2026(%) 6.8%
Key countries China, Japan, India, South Korea, Australia, Indonesia, Germany, UK, France, Italy, Spain, The Netherlands, US, Canada, Mexico, Brazil, Argentina, Chile, Saudi Arabia, UAE, South Africa, Turkey and Israel
Competitive landscape Leading Companies, Market Positioning of Companies, Competitive Strategies, and Industry Risks

Request Free Sample

Research Analyst Overview

  • The Basalt Rock Market continually evolves as industrial stakeholders transition toward high-performance, non-toxic mineral resources for structural and environmental engineering. Modern architectural applications increasingly rely on precision dimensional stone fabrication, delivering highly resilient paving and cladding materials that endure severe urban weathering.
  • A critical trend shaping product strategy is the integration of advanced seismic retrofitting wraps utilizing continuous mineral filaments, enabling structural engineers to reinforce aging bridges and masonry without adding significant dead weight. Facilities implementing these structural wraps report a 30% reduction in installation downtime compared to traditional steel jacketing methods.
  • Furthermore, agricultural supply chains are strategically procuring volcanic rock powder to support enhanced rock weathering initiatives, capturing atmospheric carbon while restoring vital soil micronutrients. The greenhouse cultivation sector also leverages inert hydroponic growth substrates derived from spun volcanic wool to optimize water retention and root aeration.
  • By specifying an advanced mineral additive in concrete formulations, construction planners eliminate the need for synthetic chemical binders, dramatically improving life-cycle asset resilience and aligning procurement strategies with rigorous global sustainability standards.

What are the Key Data Covered in this Basalt Rock Market Research and Growth Report?

  • What is the expected growth of the Basalt Rock Market between 2026 and 2030?

    • USD 907 million, at a CAGR of 7.5%

  • What segmentation does the market report cover?

    • The report is segmented by Type (Natural basalt, and Synthetic basalt), End-user (Building and construction, Infrastructure, Automotive and transportation, Aerospace and defense, and Others), Product Type (Basalt fiber, Basalt aggregates, Basalt tiles or slabs, and Others) and Geography (APAC, Europe, North America, South America, Middle East and Africa)

  • Which regions are analyzed in the report?

    • APAC, Europe, North America, South America and Middle East and Africa

  • What are the key growth drivers and market challenges?

    • Wind energy blade component reinforcement acceleration, High capital requirements and furnace retrofitting

  • Who are the major players in the Basalt Rock Market?

    • Arab Basalt Fiber Co, Aravali India Marbles, ArmBasfiber LLC, Arrow Technical Textiles Ltd., Basalt Engineering Corp, Basalt Engineering LLC, Basalt Fiber China, Basalt Fiber Tech, Basalt International, BASALTEX NV, Deutsche Basalt Faser GmbH, Hebei Yuniu Fiberglass, HG GBF Basalt Fiber Co. Ltd., INCOTELOGY GmbH, ISOMATEX SA, Kamenny Vek, Lavaintel, Mafic USA, MagmaTech Ltd and Technobasalt LLC

Market Research Insights

  • The Basalt Rock Market undergoes rapid transformation as developers prioritize sustainable materials capable of maintaining continuous operating temperatures exceeding one thousand degrees Celsius. Civil engineering firms adopting basalt-based rebars for coastal infrastructure resilience have achieved a 35% improvement in long-term durability compared to traditional steel reinforcement.
  • Furthermore, the integration of these composites in marine dike strengthening projects yields a 20% increase in structural load bearing capacity under severe wave action. Automotive and aerospace sectors highly value the material's zero electrical conductivity, utilizing it to enhance component safety while simultaneously reducing vehicle weight by up to 15%.
  • This structural shift toward advanced mineral composites significantly enhances lifecycle asset performance and operational efficiency across heavy industrial sectors without relying on toxic chemical binders.

We can help! Our analysts can customize this basalt rock market research report to meet your requirements.

Get in touch

1. Executive Summary

1.1 Market overview

Executive Summary - Chart on Market Overview
Executive Summary - Data Table on Market Overview
Executive Summary - Chart on Global Market Characteristics
Executive Summary - Chart on Market by Geography
Executive Summary - Chart on Market Segmentation by Type
Executive Summary - Chart on Market Segmentation by End-user
Executive Summary - Chart on Market Segmentation by Product Type
Executive Summary - Chart on Incremental Growth
Executive Summary - Data Table on Incremental Growth
Executive Summary - Chart on Company Market Positioning

2. Technavio Analysis

2.1 Analysis of price sensitivity, lifecycle, customer purchase basket, adoption rates, and purchase criteria

2.2 Criticality of inputs and Factors of differentiation

Chart on Overview on criticality of inputs and factors of differentiation

2.3 Factors of disruption

Chart on Overview on factors of disruption

2.4 Impact of drivers and challenges

Chart on Impact of drivers and challenges in 2025 and 2030

3. Market Landscape

3.1 Market ecosystem

Chart on Parent Market
Data Table on - Parent Market

3.2 Market characteristics

Chart on Market characteristics analysis

3.3 Value chain analysis

Chart on Value chain analysis

4. Market Sizing

4.1 Market definition

Data Table on Offerings of companies included in the market definition

4.2 Market segment analysis

Market segments

4.3 Market size 2025

4.4 Market outlook: Forecast for 2025-2030

Chart on Global - Market size and forecast 2025-2030 ($ million)
Data Table on Global - Market size and forecast 2025-2030 ($ million)
Chart on Global Market: Year-over-year growth 2025-2030 (%)
Data Table on Global Market: Year-over-year growth 2025-2030 (%)

5. Historic Market Size

5.1 Global Basalt Rock Market 2020 - 2024

Historic Market Size - Data Table on Global Basalt Rock Market 2020 - 2024 ($ million)

5.2 Type segment analysis 2020 - 2024

Historic Market Size - Type Segment 2020 - 2024 ($ million)

5.3 End-user segment analysis 2020 - 2024

Historic Market Size - End-user Segment 2020 - 2024 ($ million)

5.4 Product Type segment analysis 2020 - 2024

Historic Market Size - Product Type Segment 2020 - 2024 ($ million)

5.5 Geography segment analysis 2020 - 2024

Historic Market Size - Geography Segment 2020 - 2024 ($ million)

5.6 Country segment analysis 2020 - 2024

Historic Market Size - Country Segment 2020 - 2024 ($ million)

6. Qualitative Analysis

6.1 Impact of AI on Global Basalt Rock Market

6.2 Impact of geopolitical conflicts on Global Basalt Rock Market

7. Five Forces Analysis

7.1 Five forces summary

Five forces analysis - Comparison between 2025 and 2030

7.2 Bargaining power of buyers

Bargaining power of buyers - Impact of key factors 2025 and 2030

7.3 Bargaining power of suppliers

Bargaining power of suppliers - Impact of key factors in 2025 and 2030

7.4 Threat of new entrants

Threat of new entrants - Impact of key factors in 2025 and 2030

7.5 Threat of substitutes

Threat of substitutes - Impact of key factors in 2025 and 2030

7.6 Threat of rivalry

Threat of rivalry - Impact of key factors in 2025 and 2030

7.7 Market condition

Chart on Market condition - Five forces 2025 and 2030

8. Market Segmentation by Type

8.1 Market segments

Chart on Type - Market share 2025-2030 (%)
Data Table on Type - Market share 2025-2030 (%)

8.2 Comparison by Type

Chart on Comparison by Type
Data Table on Comparison by Type

8.3 Natural basalt - Market size and forecast 2025-2030

Chart on Natural basalt - Market size and forecast 2025-2030 ($ million)
Data Table on Natural basalt - Market size and forecast 2025-2030 ($ million)
Chart on Natural basalt - Year-over-year growth 2025-2030 (%)
Data Table on Natural basalt - Year-over-year growth 2025-2030 (%)

8.4 Synthetic basalt - Market size and forecast 2025-2030

Chart on Synthetic basalt - Market size and forecast 2025-2030 ($ million)
Data Table on Synthetic basalt - Market size and forecast 2025-2030 ($ million)
Chart on Synthetic basalt - Year-over-year growth 2025-2030 (%)
Data Table on Synthetic basalt - Year-over-year growth 2025-2030 (%)

8.5 Market opportunity by Type

Market opportunity by Type ($ million)
Data Table on Market opportunity by Type ($ million)

9. Market Segmentation by End-user

9.1 Market segments

Chart on End-user - Market share 2025-2030 (%)
Data Table on End-user - Market share 2025-2030 (%)

9.2 Comparison by End-user

Chart on Comparison by End-user
Data Table on Comparison by End-user

9.3 Building and construction - Market size and forecast 2025-2030

Chart on Building and construction - Market size and forecast 2025-2030 ($ million)
Data Table on Building and construction - Market size and forecast 2025-2030 ($ million)
Chart on Building and construction - Year-over-year growth 2025-2030 (%)
Data Table on Building and construction - Year-over-year growth 2025-2030 (%)

9.4 Infrastructure - Market size and forecast 2025-2030

Chart on Infrastructure - Market size and forecast 2025-2030 ($ million)
Data Table on Infrastructure - Market size and forecast 2025-2030 ($ million)
Chart on Infrastructure - Year-over-year growth 2025-2030 (%)
Data Table on Infrastructure - Year-over-year growth 2025-2030 (%)

9.5 Automotive and transportation - Market size and forecast 2025-2030

Chart on Automotive and transportation - Market size and forecast 2025-2030 ($ million)
Data Table on Automotive and transportation - Market size and forecast 2025-2030 ($ million)
Chart on Automotive and transportation - Year-over-year growth 2025-2030 (%)
Data Table on Automotive and transportation - Year-over-year growth 2025-2030 (%)

9.6 Aerospace and defense - Market size and forecast 2025-2030

Chart on Aerospace and defense - Market size and forecast 2025-2030 ($ million)
Data Table on Aerospace and defense - Market size and forecast 2025-2030 ($ million)
Chart on Aerospace and defense - Year-over-year growth 2025-2030 (%)
Data Table on Aerospace and defense - Year-over-year growth 2025-2030 (%)

9.7 Others - Market size and forecast 2025-2030

Chart on Others - Market size and forecast 2025-2030 ($ million)
Data Table on Others - Market size and forecast 2025-2030 ($ million)
Chart on Others - Year-over-year growth 2025-2030 (%)
Data Table on Others - Year-over-year growth 2025-2030 (%)

9.8 Market opportunity by End-user

Market opportunity by End-user ($ million)
Data Table on Market opportunity by End-user ($ million)

10. Market Segmentation by Product Type

10.1 Market segments

Chart on Product Type - Market share 2025-2030 (%)
Data Table on Product Type - Market share 2025-2030 (%)

10.2 Comparison by Product Type

Chart on Comparison by Product Type
Data Table on Comparison by Product Type

10.3 Basalt fiber - Market size and forecast 2025-2030

Chart on Basalt fiber - Market size and forecast 2025-2030 ($ million)
Data Table on Basalt fiber - Market size and forecast 2025-2030 ($ million)
Chart on Basalt fiber - Year-over-year growth 2025-2030 (%)
Data Table on Basalt fiber - Year-over-year growth 2025-2030 (%)

10.4 Basalt aggregates - Market size and forecast 2025-2030

Chart on Basalt aggregates - Market size and forecast 2025-2030 ($ million)
Data Table on Basalt aggregates - Market size and forecast 2025-2030 ($ million)
Chart on Basalt aggregates - Year-over-year growth 2025-2030 (%)
Data Table on Basalt aggregates - Year-over-year growth 2025-2030 (%)

10.5 Basalt tiles or slabs - Market size and forecast 2025-2030

Chart on Basalt tiles or slabs - Market size and forecast 2025-2030 ($ million)
Data Table on Basalt tiles or slabs - Market size and forecast 2025-2030 ($ million)
Chart on Basalt tiles or slabs - Year-over-year growth 2025-2030 (%)
Data Table on Basalt tiles or slabs - Year-over-year growth 2025-2030 (%)

10.6 Others - Market size and forecast 2025-2030

Chart on Others - Market size and forecast 2025-2030 ($ million)
Data Table on Others - Market size and forecast 2025-2030 ($ million)
Chart on Others - Year-over-year growth 2025-2030 (%)
Data Table on Others - Year-over-year growth 2025-2030 (%)

10.7 Market opportunity by Product Type

Market opportunity by Product Type ($ million)
Data Table on Market opportunity by Product Type ($ million)

11. Customer Landscape

11.1 Customer landscape overview

Analysis of price sensitivity, lifecycle, customer purchase basket, adoption rates, and purchase criteria

12. Geographic Landscape

12.1 Geographic segmentation

Chart on Market share by geography 2025-2030 (%)
Data Table on Market share by geography 2025-2030 (%)

12.2 Geographic comparison

Chart on Geographic comparison
Data Table on Geographic comparison

12.3 APAC - Market size and forecast 2025-2030

Chart on APAC - Market size and forecast 2025-2030 ($ million)
Data Table on APAC - Market size and forecast 2025-2030 ($ million)
Chart on APAC - Year-over-year growth 2025-2030 (%)
Data Table on APAC - Year-over-year growth 2025-2030 (%)
Chart on Regional Comparison - APAC
Data Table on Regional Comparison - APAC

12.3.1 China - Market size and forecast 2025-2030

Chart on China - Market size and forecast 2025-2030 ($ million)
Data Table on China - Market size and forecast 2025-2030 ($ million)
Chart on China - Year-over-year growth 2025-2030 (%)
Data Table on China - Year-over-year growth 2025-2030 (%)

12.3.2 Japan - Market size and forecast 2025-2030

Chart on Japan - Market size and forecast 2025-2030 ($ million)
Data Table on Japan - Market size and forecast 2025-2030 ($ million)
Chart on Japan - Year-over-year growth 2025-2030 (%)
Data Table on Japan - Year-over-year growth 2025-2030 (%)

12.3.3 India - Market size and forecast 2025-2030

Chart on India - Market size and forecast 2025-2030 ($ million)
Data Table on India - Market size and forecast 2025-2030 ($ million)
Chart on India - Year-over-year growth 2025-2030 (%)
Data Table on India - Year-over-year growth 2025-2030 (%)

12.3.4 South Korea - Market size and forecast 2025-2030

Chart on South Korea - Market size and forecast 2025-2030 ($ million)
Data Table on South Korea - Market size and forecast 2025-2030 ($ million)
Chart on South Korea - Year-over-year growth 2025-2030 (%)
Data Table on South Korea - Year-over-year growth 2025-2030 (%)

12.3.5 Australia - Market size and forecast 2025-2030

Chart on Australia - Market size and forecast 2025-2030 ($ million)
Data Table on Australia - Market size and forecast 2025-2030 ($ million)
Chart on Australia - Year-over-year growth 2025-2030 (%)
Data Table on Australia - Year-over-year growth 2025-2030 (%)

12.3.6 Indonesia - Market size and forecast 2025-2030

Chart on Indonesia - Market size and forecast 2025-2030 ($ million)
Data Table on Indonesia - Market size and forecast 2025-2030 ($ million)
Chart on Indonesia - Year-over-year growth 2025-2030 (%)
Data Table on Indonesia - Year-over-year growth 2025-2030 (%)

12.4 Europe - Market size and forecast 2025-2030

Chart on Europe - Market size and forecast 2025-2030 ($ million)
Data Table on Europe - Market size and forecast 2025-2030 ($ million)
Chart on Europe - Year-over-year growth 2025-2030 (%)
Data Table on Europe - Year-over-year growth 2025-2030 (%)
Chart on Regional Comparison - Europe
Data Table on Regional Comparison - Europe

12.4.1 Germany - Market size and forecast 2025-2030

Chart on Germany - Market size and forecast 2025-2030 ($ million)
Data Table on Germany - Market size and forecast 2025-2030 ($ million)
Chart on Germany - Year-over-year growth 2025-2030 (%)
Data Table on Germany - Year-over-year growth 2025-2030 (%)

12.4.2 UK - Market size and forecast 2025-2030

Chart on UK - Market size and forecast 2025-2030 ($ million)
Data Table on UK - Market size and forecast 2025-2030 ($ million)
Chart on UK - Year-over-year growth 2025-2030 (%)
Data Table on UK - Year-over-year growth 2025-2030 (%)

12.4.3 France - Market size and forecast 2025-2030

Chart on France - Market size and forecast 2025-2030 ($ million)
Data Table on France - Market size and forecast 2025-2030 ($ million)
Chart on France - Year-over-year growth 2025-2030 (%)
Data Table on France - Year-over-year growth 2025-2030 (%)

12.4.4 Italy - Market size and forecast 2025-2030

Chart on Italy - Market size and forecast 2025-2030 ($ million)
Data Table on Italy - Market size and forecast 2025-2030 ($ million)
Chart on Italy - Year-over-year growth 2025-2030 (%)
Data Table on Italy - Year-over-year growth 2025-2030 (%)

12.4.5 Spain - Market size and forecast 2025-2030

Chart on Spain - Market size and forecast 2025-2030 ($ million)
Data Table on Spain - Market size and forecast 2025-2030 ($ million)
Chart on Spain - Year-over-year growth 2025-2030 (%)
Data Table on Spain - Year-over-year growth 2025-2030 (%)

12.4.6 The Netherlands - Market size and forecast 2025-2030

Chart on The Netherlands - Market size and forecast 2025-2030 ($ million)
Data Table on The Netherlands - Market size and forecast 2025-2030 ($ million)
Chart on The Netherlands - Year-over-year growth 2025-2030 (%)
Data Table on The Netherlands - Year-over-year growth 2025-2030 (%)

12.5 North America - Market size and forecast 2025-2030

Chart on North America - Market size and forecast 2025-2030 ($ million)
Data Table on North America - Market size and forecast 2025-2030 ($ million)
Chart on North America - Year-over-year growth 2025-2030 (%)
Data Table on North America - Year-over-year growth 2025-2030 (%)
Chart on Regional Comparison - North America
Data Table on Regional Comparison - North America

12.5.1 US - Market size and forecast 2025-2030

Chart on US - Market size and forecast 2025-2030 ($ million)
Data Table on US - Market size and forecast 2025-2030 ($ million)
Chart on US - Year-over-year growth 2025-2030 (%)
Data Table on US - Year-over-year growth 2025-2030 (%)

12.5.2 Canada - Market size and forecast 2025-2030

Chart on Canada - Market size and forecast 2025-2030 ($ million)
Data Table on Canada - Market size and forecast 2025-2030 ($ million)
Chart on Canada - Year-over-year growth 2025-2030 (%)
Data Table on Canada - Year-over-year growth 2025-2030 (%)

12.5.3 Mexico - Market size and forecast 2025-2030

Chart on Mexico - Market size and forecast 2025-2030 ($ million)
Data Table on Mexico - Market size and forecast 2025-2030 ($ million)
Chart on Mexico - Year-over-year growth 2025-2030 (%)
Data Table on Mexico - Year-over-year growth 2025-2030 (%)

12.6 South America - Market size and forecast 2025-2030

Chart on South America - Market size and forecast 2025-2030 ($ million)
Data Table on South America - Market size and forecast 2025-2030 ($ million)
Chart on South America - Year-over-year growth 2025-2030 (%)
Data Table on South America - Year-over-year growth 2025-2030 (%)
Chart on Regional Comparison - South America
Data Table on Regional Comparison - South America

12.6.1 Brazil - Market size and forecast 2025-2030

Chart on Brazil - Market size and forecast 2025-2030 ($ million)
Data Table on Brazil - Market size and forecast 2025-2030 ($ million)
Chart on Brazil - Year-over-year growth 2025-2030 (%)
Data Table on Brazil - Year-over-year growth 2025-2030 (%)

12.6.2 Argentina - Market size and forecast 2025-2030

Chart on Argentina - Market size and forecast 2025-2030 ($ million)
Data Table on Argentina - Market size and forecast 2025-2030 ($ million)
Chart on Argentina - Year-over-year growth 2025-2030 (%)
Data Table on Argentina - Year-over-year growth 2025-2030 (%)

12.6.3 Chile - Market size and forecast 2025-2030

Chart on Chile - Market size and forecast 2025-2030 ($ million)
Data Table on Chile - Market size and forecast 2025-2030 ($ million)
Chart on Chile - Year-over-year growth 2025-2030 (%)
Data Table on Chile - Year-over-year growth 2025-2030 (%)

12.7 Middle East and Africa - Market size and forecast 2025-2030

Chart on Middle East and Africa - Market size and forecast 2025-2030 ($ million)
Data Table on Middle East and Africa - Market size and forecast 2025-2030 ($ million)
Chart on Middle East and Africa - Year-over-year growth 2025-2030 (%)
Data Table on Middle East and Africa - Year-over-year growth 2025-2030 (%)
Chart on Regional Comparison - Middle East and Africa
Data Table on Regional Comparison - Middle East and Africa

12.7.1 Saudi Arabia - Market size and forecast 2025-2030

Chart on Saudi Arabia - Market size and forecast 2025-2030 ($ million)
Data Table on Saudi Arabia - Market size and forecast 2025-2030 ($ million)
Chart on Saudi Arabia - Year-over-year growth 2025-2030 (%)
Data Table on Saudi Arabia - Year-over-year growth 2025-2030 (%)

12.7.2 UAE - Market size and forecast 2025-2030

Chart on UAE - Market size and forecast 2025-2030 ($ million)
Data Table on UAE - Market size and forecast 2025-2030 ($ million)
Chart on UAE - Year-over-year growth 2025-2030 (%)
Data Table on UAE - Year-over-year growth 2025-2030 (%)

12.7.3 South Africa - Market size and forecast 2025-2030

Chart on South Africa - Market size and forecast 2025-2030 ($ million)
Data Table on South Africa - Market size and forecast 2025-2030 ($ million)
Chart on South Africa - Year-over-year growth 2025-2030 (%)
Data Table on South Africa - Year-over-year growth 2025-2030 (%)

12.7.4 Turkey - Market size and forecast 2025-2030

Chart on Turkey - Market size and forecast 2025-2030 ($ million)
Data Table on Turkey - Market size and forecast 2025-2030 ($ million)
Chart on Turkey - Year-over-year growth 2025-2030 (%)
Data Table on Turkey - Year-over-year growth 2025-2030 (%)

12.7.5 Israel - Market size and forecast 2025-2030

Chart on Israel - Market size and forecast 2025-2030 ($ million)
Data Table on Israel - Market size and forecast 2025-2030 ($ million)
Chart on Israel - Year-over-year growth 2025-2030 (%)
Data Table on Israel - Year-over-year growth 2025-2030 (%)

12.8 Market opportunity by geography

Market opportunity by geography ($ million)
Data Tables on Market opportunity by geography ($ million)

13. Drivers, Challenges, and Opportunity

13.1 Market drivers

Wind energy blade component reinforcement acceleration
High-temperature industrial thermal insulation expansion
Marine infrastructure and coastal resilience investment

13.2 Market challenges

High capital requirements and furnace retrofitting
Chemical inconsistency and raw material selection
Absence of standardized global testing protocols

13.3 Impact of drivers and challenges

Impact of drivers and challenges in 2025 and 2030

13.4 Market opportunities

Aerospace thermal protection and defense applications
Integration of geothermal and subsurface wellbore infrastructure
Deploy 3D concrete printing and additive construction

14. Competitive Landscape

14.1 Overview

14.2

Overview on criticality of inputs and factors of differentiation

14.3 Landscape disruption

Overview on factors of disruption

14.4 Industry risks

Impact of key risks on business

15. Competitive Analysis

15.1 Companies profiled

Companies covered

15.2 Company ranking index

15.3 Market positioning of companies

Matrix on companies position and classification

15.4 Arab Basalt Fiber Co

Arab Basalt Fiber Co - Overview
Arab Basalt Fiber Co - Product / Service
Arab Basalt Fiber Co - Key offerings
SWOT

15.5 Aravali India Marbles

Aravali India Marbles - Overview
Aravali India Marbles - Product / Service
Aravali India Marbles - Key offerings
SWOT

15.6 Basalt Engineering Corp

Basalt Engineering Corp - Overview
Basalt Engineering Corp - Product / Service
Basalt Engineering Corp - Key offerings
SWOT

15.7 Basalt Engineering LLC

Basalt Engineering LLC - Overview
Basalt Engineering LLC - Product / Service
Basalt Engineering LLC - Key offerings
SWOT

15.8 Basalt Fiber China

Basalt Fiber China - Overview
Basalt Fiber China - Product / Service
Basalt Fiber China - Key offerings
SWOT

15.9 Basalt Fiber Tech

Basalt Fiber Tech - Overview
Basalt Fiber Tech - Product / Service
Basalt Fiber Tech - Key offerings
SWOT

15.10 Basalt International

Basalt International - Overview
Basalt International - Product / Service
Basalt International - Key offerings
SWOT

15.11 Deutsche Basalt Faser GmbH

Deutsche Basalt Faser GmbH - Overview
Deutsche Basalt Faser GmbH - Product / Service
Deutsche Basalt Faser GmbH - Key offerings
SWOT

15.12 HG GBF Basalt Fiber Co. Ltd.

HG GBF Basalt Fiber Co. Ltd. - Overview
HG GBF Basalt Fiber Co. Ltd. - Product / Service
HG GBF Basalt Fiber Co. Ltd. - Key offerings
SWOT

15.13 INCOTELOGY GmbH

INCOTELOGY GmbH - Overview
INCOTELOGY GmbH - Product / Service
INCOTELOGY GmbH - Key offerings
SWOT

15.14 ISOMATEX SA

ISOMATEX SA - Overview
ISOMATEX SA - Product / Service
ISOMATEX SA - Key offerings
SWOT

15.15 Lavaintel

Lavaintel - Overview
Lavaintel - Product / Service
Lavaintel - Key offerings
SWOT

15.16 Mafic USA

Mafic USA - Overview
Mafic USA - Product / Service
Mafic USA - Key offerings
SWOT

15.17 MagmaTech Ltd

MagmaTech Ltd - Overview
MagmaTech Ltd - Product / Service
MagmaTech Ltd - Key offerings
SWOT

15.18 Technobasalt LLC

Technobasalt LLC - Overview
Technobasalt LLC - Product / Service
Technobasalt LLC - Key offerings
SWOT

16. Appendix

16.1 Scope of the report

Market definition
Objectives
Notes and caveats

16.2 Inclusions and exclusions checklist

Inclusions checklist
Exclusions checklist

16.3 Currency conversion rates for US$

16.4 Research methodology

16.5 Data procurement

Information sources

16.6 Data validation

16.7 Validation techniques employed for market sizing

16.8 Data synthesis

16.9 360 degree market analysis

16.10 List of abbreviations

Research Methodology

Technavio presents a detailed picture of the market by way of study, synthesis, and summation of data from multiple sources. The analysts have presented the various facets of the market with a particular focus on identifying the key industry influencers. The data thus presented is comprehensive, reliable, and the result of extensive research, both primary and secondary.

INFORMATION SOURCES

Primary sources

  • Manufacturers and suppliers
  • Channel partners
  • Industry experts
  • Strategic decision makers

Secondary sources

  • Industry journals and periodicals
  • Government data
  • Financial reports of key industry players
  • Historical data
  • Press releases

DATA ANALYSIS

Data Synthesis

  • Collation of data
  • Estimation of key figures
  • Analysis of derived insights

Data Validation

  • Triangulation with data models
  • Reference against proprietary databases
  • Corroboration with industry experts

REPORT WRITING

Qualitative

  • Market drivers
  • Market challenges
  • Market trends
  • Five forces analysis

Quantitative

  • Market size and forecast
  • Market segmentation
  • Geographical insights
  • Competitive landscape

Interested in this report?

Get your sample now to see our research methodology and insights!

Download Now

Frequently Asked Questions

Basalt Rock market growth will increase by USD 907.0 million during 2026-2030.

The Basalt Rock market is expected to grow at a CAGR of 7.5% during 2026-2030.

Basalt Rock market is segmented by Type (Natural basalt, Synthetic basalt) End-user (Building and construction, Infrastructure, Automotive and transportation, Aerospace and defense, Others) Product type (Basalt fiber, Basalt aggregates, Basalt tiles or slabs, Others)

Arab Basalt Fiber Co, Aravali India Marbles, ArmBasfiber LLC, Arrow Technical Textiles Ltd., Basalt Engineering Corp, Basalt Engineering LLC, Basalt Fiber China, Basalt Fiber Tech, Basalt International, BASALTEX NV, Deutsche Basalt Faser GmbH, Hebei Yuniu Fiberglass, HG GBF Basalt Fiber Co. Ltd., INCOTELOGY GmbH, ISOMATEX SA, Kamenny Vek, Lavaintel, Mafic USA, MagmaTech Ltd, Technobasalt LLC are a few of the key vendors in the Basalt Rock market.

APAC will register the highest growth rate of 53.2% among the other regions. Therefore, the Basalt Rock market in APAC is expected to garner significant business opportunities for the vendors during the forecast period.

China, Japan, India, South Korea, Australia, Indonesia, Germany, UK, France, Italy, Spain, The Netherlands, US, Canada, Mexico, Brazil, Argentina, Chile, Saudi Arabia, UAE, South Africa, Turkey, Israel

  • Wind energy blade component reinforcement acceleration is the driving factor this market.

The Basalt Rock market vendors should focus on grabbing business opportunities from the Type segment as it accounted for the largest market share in the base year.
RIA - Research AI Assistant
Ask RIA