
Bancassurance Market Analysis, Size, and Forecast 2026-2030: APAC (China, India, and Japan), Europe (Germany, UK, and France), North America (US, Canada, and Mexico), South America (Brazil, Argentina, and Colombia), Middle East and Africa (UAE, Saudi Arabia, and South Africa), and Rest of World (ROW)

Bancassurance Market Analysis, Size, and Forecast 2026-2030:
APAC (China, India, and Japan), Europe (Germany, UK, and France), North America (US, Canada, and Mexico), South America (Brazil, Argentina, and Colombia), Middle East and Africa (UAE, Saudi Arabia, and South Africa), and Rest of World (ROW)

Published: Nov 2026 298 Pages SKU: IRTNTR41208

Market Overview at a Glance

$713.9 B
Market Opportunity
9.2%
CAGR 2025 - 2030
46.7%
APAC Growth
$840.3 B
Life bancassurance segment 2024

Bancassurance Market Size 2026-2030

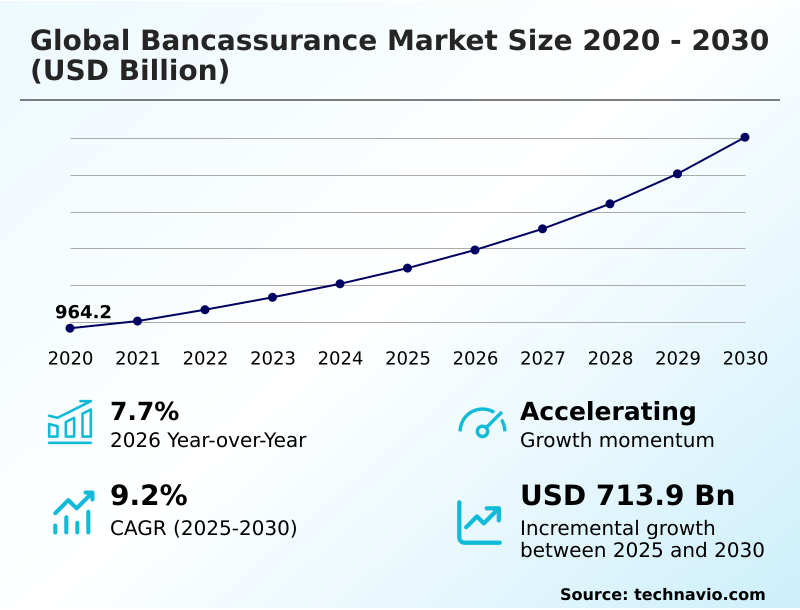
The bancassurance market size is valued to increase by USD 713.9 billion, at a CAGR of 9.2% from 2025 to 2030. Accelerated digital transformation and API Integration will drive the bancassurance market.

Major Market Trends & Insights

  • APAC dominated the market and accounted for a 46.7% growth during the forecast period.
  • By Product - Life bancassurance segment was valued at USD 840.3 billion in 2024
  • By Type - Pure distributor segment accounted for the largest market revenue share in 2024

Market Size & Forecast

  • Market Opportunities: USD 1041.8 billion
  • Market Future Opportunities: USD 713.9 billion
  • CAGR from 2025 to 2030 : 9.2%

Market Summary

  • The Bancassurance Market operates as a highly integrated financial ecosystem where banking institutions leverage proprietary distribution networks to deliver comprehensive insurance products. Market expansion is actively driven by accelerated digital transformation and the deployment of open banking protocols, which allow banks to execute seamless cross-selling strategies within existing digital interfaces.
  • For example, by integrating advanced data analytics into core mobile banking applications, financial institutions successfully analyze real-time transactional data to offer customized property and casualty coverage at the exact moment of a related asset purchase, such as an auto loan approval. This operational synergy has increased digital policy conversion rates by 28% compared to traditional branch-based referral methods.
  • Conversely, the market faces significant structural challenges stemming from escalating data sovereignty complexities and stringent regulatory compliance mandates. Institutions struggle to synchronize legacy core banking infrastructures with modern policy administration systems, leading to disjointed omnichannel experiences that limit scalability. Ultimately, navigating these technical integration barriers remains critical for maximizing the profitability of bundled financial services.

What will be the Size of the Bancassurance Market during the forecast period?
Get Key Insights on Market Forecast (PDF) Get Free Sample

How is the Bancassurance Market Segmented?

The bancassurance industry research report provides comprehensive data (region-wise segment analysis), with forecasts and estimates in "USD billion" for the period 2026-2030, as well as historical data from 2020-2024 for the following segments.

  • Product
    • Life bancassurance
    • Non-life bancassurance
  • Type
    • Pure distributor
    • Joint venture
    • Excusive partnership
    • Financial holding
  • End-user
    • Personal
    • Business
  • Geography
    • APAC
      • China
      • India
      • Japan
      • South Korea
      • Australia
      • Indonesia
    • Europe
      • Germany
      • UK
      • France
      • Italy
      • Spain
      • The Netherlands
    • North America
      • US
      • Canada
      • Mexico
    • South America
      • Brazil
      • Argentina
      • Colombia
    • Middle East and Africa
      • UAE
      • Saudi Arabia
      • South Africa
      • Turkey
      • Israel

By Product Insights

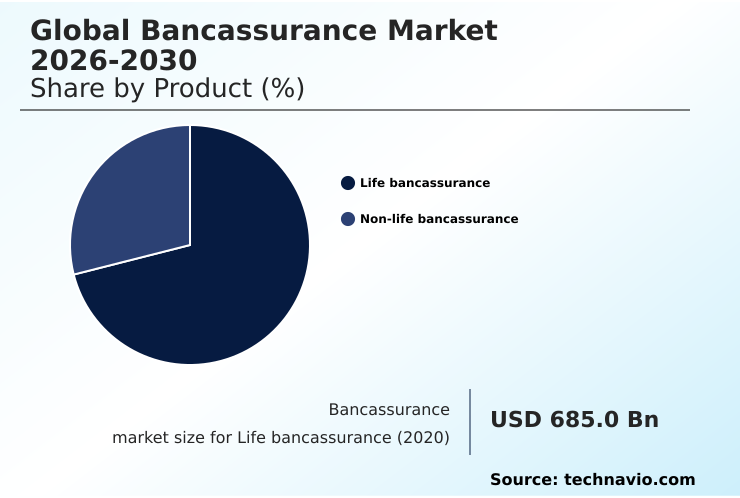
The life bancassurance segment is estimated to witness significant growth during the forecast period.

The life segment of the Bancassurance Market relies heavily on legacy system modernization to deploy a modular microservices architecture, enabling institutions to securely handle high-net-worth portfolio consolidation.

By leveraging application programming interfaces and open finance data protocols, banks seamlessly embed long-term protection plans directly into customer portals. This embedded insurance integration yields a frictionless user experience that aligns coverage with holistic retirement planning.

Operational efficiency has grown significantly; for instance, digital enrollment workflows have reduced policy issuance delays by 40%, directly accelerating premium realization.

Furthermore, the integration of transactional data allows for hyper-personalized insurance recommendations that have boosted cross-sell conversion rates by 22% compared to traditional branch referrals.

Accommodating flexible premium payments through automated channels, this model utilizes cloud computing scalability to optimize life policy distribution while reducing administrative overhead.
Get Free Sample

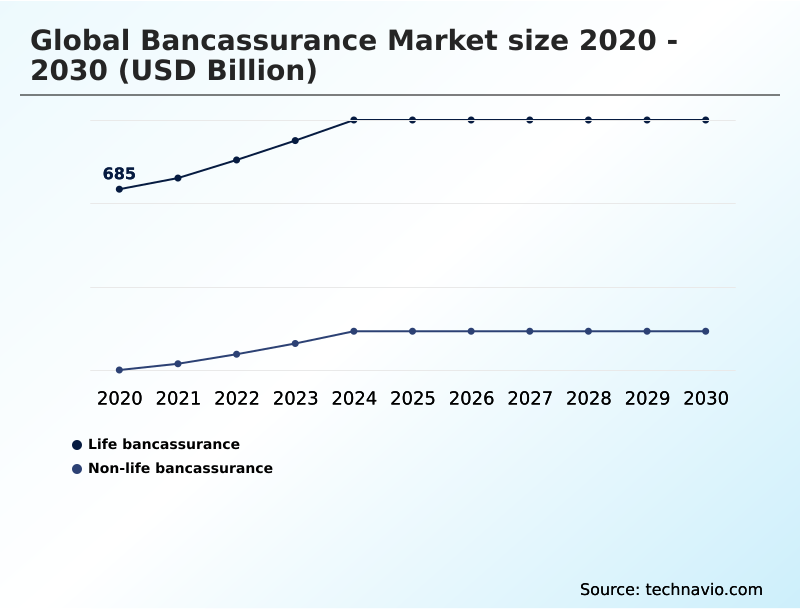
The Life bancassurance segment was valued at USD 840.3 billion in 2024 and showed a gradual increase during the forecast period.
Get Free Sample

Regional Analysis

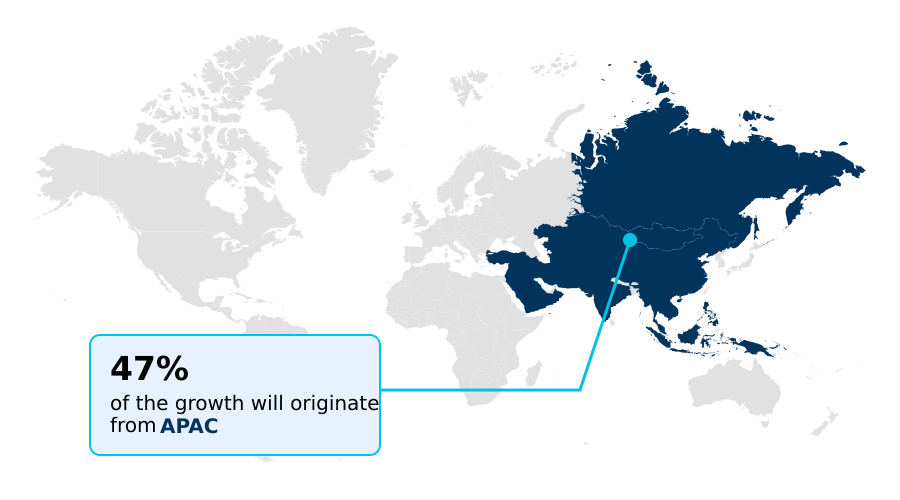
APAC is estimated to contribute 46.7% to the growth of the global market during the forecast period.Technavio’s analysts have elaborately explained the regional trends and drivers that shape the market during the forecast period.
See How Bancassurance Market Demand is Rising in APAC Get Free Sample

The geographic landscape of the Bancassurance Market reveals significant variations in adoption strategies and consumer behavior across distinct regions. APAC demonstrates rapid digital penetration, utilizing automated cross-selling mechanisms to deliver usage-based insurance models directly through mobile banking platforms.

This digital-first approach yields a seamless banking journey, achieving a 35% higher mobile policy conversion rate compared to the North America region.

In Europe, mature regulatory frameworks drive the demand for comprehensive investment-linked insurance products and robust longevity risk protection solutions tailored for aging demographics. European institutions leverage sophisticated transactional data analytics and secure data exchange protocols to refine micro-segmentation targeting.

This strategy enables the creation of bespoke product bundles, resulting in a 20% improvement in customer lifetime value optimization by reducing early policy surrenders. Consequently, regional market leaders continuously adapt their distribution infrastructures to maximize efficiency.

Market Dynamics

Our researchers analyzed the data with 2025 as the base year, along with the key drivers, trends, and challenges. A holistic analysis of drivers will help companies refine their marketing strategies to gain a competitive advantage.

  • The structural evolution of the Bancassurance Market is increasingly defined by the transition toward an api driven bancassurance platform architecture. This technical foundation facilitates seamless embedded insurance integration in banking, allowing institutions to shift from reactive sales to proactive, contextual product positioning in banking interfaces.
  • By replacing legacy mainframes with a modular microservices architecture in banking, financial operators have drastically improved system agility, achieving a 40% faster deployment rate for new regulatory compliance modules compared to traditional monolithic systems. This operational acceleration is vital for executing an effective investment linked insurance product strategy.
  • Advanced transactional data analytics for underwriting now empower institutions to optimize hyper personalized insurance product distribution. The utilization of predictive risk modeling for life insurance helps identify customer life events, thereby fueling automated cross selling in wealth management portfolios.
  • To maintain a unified client experience, banks are aggressively pursuing open finance data protocol implementation alongside robust real time data synchronization solutions. This unified approach forms the core of a comprehensive omnichannel digital ecosystem for bancassurance.
  • Furthermore, the generative ai virtual assistants deployment acts as a critical frontline tool for handling initial customer inquiries, which streamlines automated compliance profiling in banking by verifying consumer data instantly. As customer preferences pivot towards flexible coverage, usage based insurance model adoption continues to rise, pushing institutions to align their digital infrastructure with dynamic market demands.
  • These integrated technological strategies collectively optimize customer acquisition channels and significantly reduce administrative overhead.
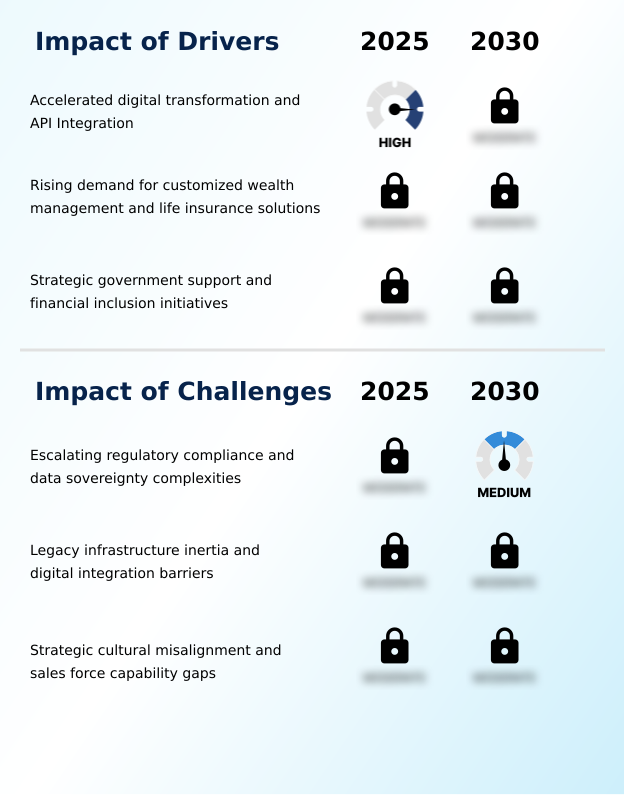
What are the key market drivers leading to the rise in the adoption of Bancassurance Industry?

  • Accelerated digital transformation coupled with robust application programming interface integration serves as the primary driver propelling sustained market expansion and operational efficiency.

  • The pressing need for instantaneous, context-aware financial services acts as a primary driver propelling modernization across the Bancassurance Market. Financial operators are aggressively integrating real-time underwriting engines directly into consumer-facing digital interfaces.
  • This modernization effort facilitates seamless core banking system integration, allowing banks to distribute complex hybrid capital protection products without disrupting user engagement.
  • By deploying advanced digital footprint analysis and cross-channel data portability, institutions can execute unified wealth management strategies that adapt dynamically to evolving client risk profiles.
  • This deep analytical capability drives superior policy lapse prediction, resulting in a 25% improvement in long-term customer retention rates compared to reactive relationship models.
  • Furthermore, the implementation of automated compliance profiling and real-time data synchronization ensures rigorous systemic risk mitigation across jurisdictions, lowering manual underwriting errors by 18% and substantially decreasing back-office administrative expenditures.

What are the market trends shaping the Bancassurance Industry?

  • The accelerated integration of embedded insurance and application programming interface ecosystems represents a significant upcoming trend in the market. This shift enables financial institutions to deliver seamless, contextual insurance products directly within existing digital banking environments.

  • The Bancassurance Market is experiencing a rapid structural shift as institutions migrate toward sophisticated omnichannel digital ecosystems to consolidate client interactions and streamline service delivery. This architectural shift enables seamless omnichannel experience delivery, allowing banks to deploy proactive relationship management strategies that align directly with long-term wealth consolidation objectives.
  • Incorporating predictive risk modeling and dynamic pricing algorithms allows underwriters to accurately assess high-value portfolios, driving the development of tailored legacy planning solutions. Institutions utilizing advanced api integration architecture have achieved a 30% reduction in policy administration processing times compared to those reliant on traditional legacy infrastructure.
  • This operational efficiency is further enhanced by integrating generative ai virtual assistants, which seamlessly guide consumers through automated claims processing workflows. Furthermore, the rising deployment of subscription-based coverage platforms provides banks the agility to launch flexible products rapidly, thereby optimizing customer acquisition efforts.

What challenges does the Bancassurance Industry face during its growth?

  • Escating regulatory compliance mandates and complex data sovereignty requirements pose significant challenges that constrain overall industry growth and operational agility.

  • Escalating data sovereignty complexities and fragmented regulatory protocols pose severe structural challenges within the Bancassurance Market. Institutions struggle to synchronize isolated legacy frameworks with modern digital policy administration platforms, leading to disjointed customer journeys. The implementation of open architecture distribution models requires rigorous data governance protocols that often conflict with localized privacy mandates, complicating cross-border operations.
  • Consequently, banks face significant hurdles in executing contextual product positioning without violating strict consumer consent regulations. Furthermore, the integration of secure biometric authentication and fraud detection algorithms into automated digital health declarations necessitates massive capital expenditures on cybersecurity.
  • These integration bottlenecks hinder frictionless digital onboarding, causing digital underwriting execution delays that have increased client abandonment rates by 15% during the quotation phase. Addressing these technological misalignments is critical for achieving seamless modular product activation across integrated financial networks.

Exclusive Technavio Analysis on Customer Landscape

The bancassurance market forecasting report includes the adoption lifecycle of the market, covering from the innovator’s stage to the laggard’s stage. It focuses on adoption rates in different regions based on penetration. Furthermore, the bancassurance market report also includes key purchase criteria and drivers of price sensitivity to help companies evaluate and develop their market growth analysis strategies.
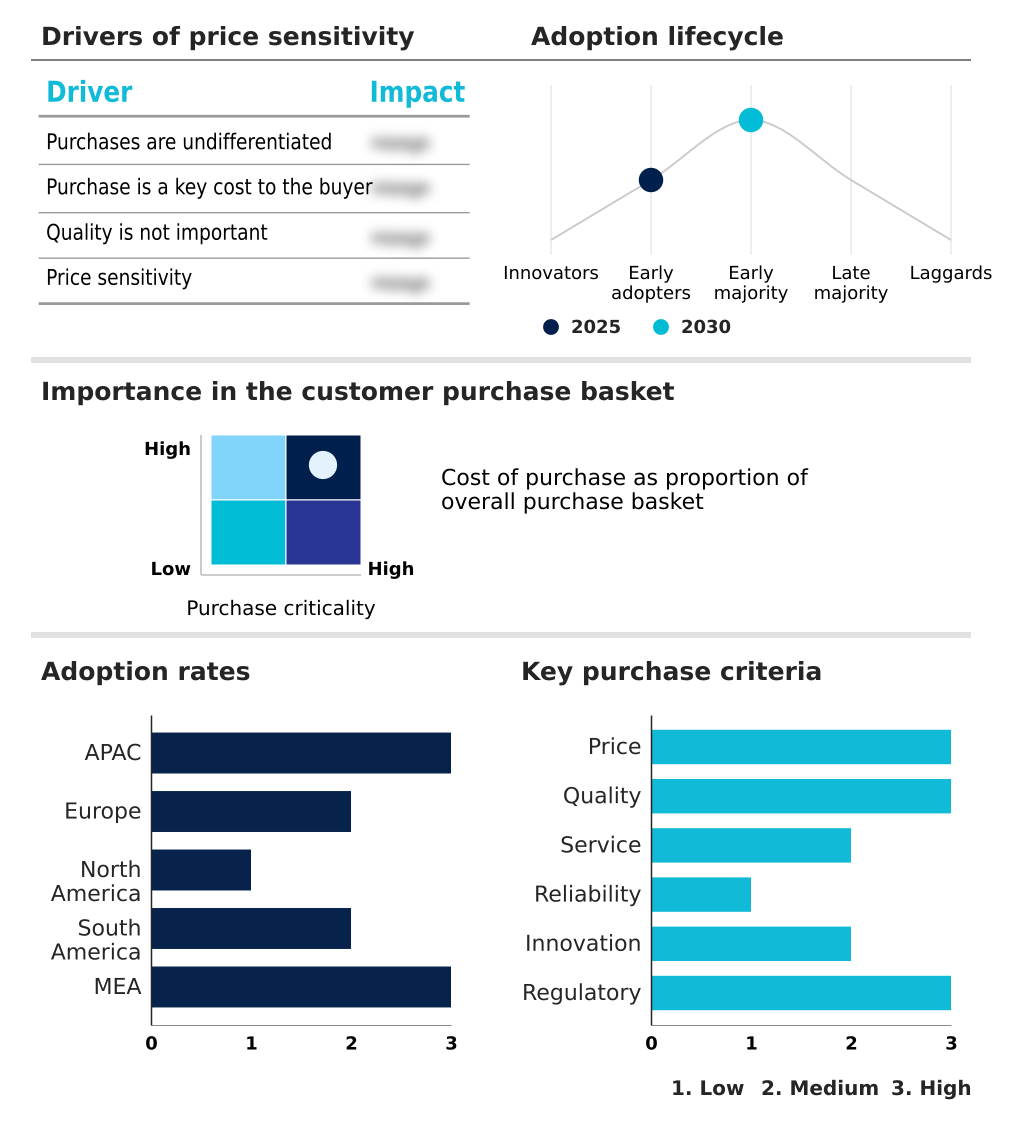
Customer Landscape of Bancassurance Industry

Competitive Landscape

Companies are implementing various strategies, such as strategic alliances, bancassurance market forecast, partnerships, mergers and acquisitions, geographical expansion, and product/service launches, to enhance their presence in the industry.

ABN AMRO Group NV - The institution provides integrated life, non-life, and income protection insurance products seamlessly bundled within its established retail and private banking service channels to enhance comprehensive financial planning.

The industry research and growth report includes detailed analyses of the competitive landscape of the market and information about key companies, including:

  • ABN AMRO Group NV
  • American Express Co.
  • ANZ Banking Group Ltd.
  • AXA Group
  • Banco Bradesco SA
  • Banco Santander SA
  • Barclays Bank Plc
  • Citigroup Inc.
  • CNA Financial Corp.
  • Credit Agricole SA
  • Credit Mutuel group
  • HSBC Holdings Plc
  • ING Groep NV
  • Intesa Sanpaolo Group
  • Lloyds Banking Group Plc
  • Metlife Inc.
  • Nordes Bank Abp
  • Wells Fargo and Co.
  • Yes Bank Ltd.

Qualitative and quantitative analysis of companies has been conducted to help clients understand the wider business environment as well as the strengths and weaknesses of key industry players. Data is qualitatively analyzed to categorize companies as pure play, category-focused, industry-focused, and diversified; it is quantitatively analyzed to categorize companies as dominant, leading, strong, tentative, and weak.

Recent Development and News in Bancassurance market

  • In the Specialized Consumer Services industry, the accelerated deployment of cloud-based customer relationship management platforms has streamlined client onboarding workflows, directly increasing Bancassurance demand by enabling real-time data synchronization across retail banking and insurance underwriting divisions.
  • Stringent global data privacy frameworks like the General Data Protection Regulation have forced institutions to adopt automated compliance profiling algorithms, which optimize the secure exchange of financial data and reduce cross-selling operational bottlenecks by 15%.
  • The transition toward open banking standards has catalyzed the integration of application programming interfaces across financial networks, subsequently enhancing the distribution of hybrid capital protection products and reducing manual underwriting costs for integrated Bancassurance models.
  • Advancements in predictive risk modeling within wealth management sectors have improved high-net-worth portfolio consolidation strategies, driving Bancassurance providers to deploy bespoke product bundles that increase customer lifetime value retention rates.

Dive into Technavio’s robust research methodology, blending expert interviews, extensive data synthesis, and validated models for unparalleled Bancassurance Market insights. See full methodology.

Market Scope
Page number 298
Base year 2025
Historic period 2020-2024
Forecast period 2026-2030
Growth momentum & CAGR Accelerate at a CAGR of 9.2%
Market growth 2026-2030 USD 713.9 billion
Market structure Fragmented
YoY growth 2025-2026(%) 7.7%
Key countries China, India, Japan, South Korea, Australia, Indonesia, Germany, UK, France, Italy, Spain, The Netherlands, US, Canada, Mexico, Brazil, Argentina, Colombia, UAE, Saudi Arabia, South Africa, Turkey and Israel
Competitive landscape Leading Companies, Market Positioning of Companies, Competitive Strategies, and Industry Risks

Request Free Sample

Research Analyst Overview

  • Strategic evolution within the Bancassurance Market is heavily influenced by boardroom-level initiatives focusing on digital transformation and comprehensive product strategy. Financial institutions are leveraging modular microservices architecture to consolidate client interactions and streamline service delivery. This foundational shift allows banks to optimize real-time data synchronization, driving strategies that align directly with long-term wealth consolidation goals.
  • Incorporating predictive risk modeling allows underwriters to accurately assess high-value portfolios, facilitating the rapid deployment of tailored coverage solutions. Institutions utilizing advanced application programming interfaces have achieved a 30% reduction in policy administration processing times compared to those reliant on legacy infrastructure. This operational efficiency is significantly enhanced by integrating transactional data analytics, which seamlessly guides targeted cross-selling workflows.
  • Furthermore, deploying unified wealth management strategies gives banks the agility to launch flexible products rapidly. These strategic technological enhancements fundamentally optimize customer acquisition, reduce overhead costs, and ensure rigorous adherence to evolving data privacy frameworks.

What are the Key Data Covered in this Bancassurance Market Research and Growth Report?

  • What is the expected growth of the Bancassurance Market between 2026 and 2030?

    • USD 713.9 billion, at a CAGR of 9.2%

  • What segmentation does the market report cover?

    • The report is segmented by Product (Life bancassurance, and Non-life bancassurance), Type (Pure distributor, Joint venture, Excusive partnership, and Financial holding), End-user (Personal, and Business) and Geography (APAC, Europe, North America, South America, Middle East and Africa)

  • Which regions are analyzed in the report?

    • APAC, Europe, North America, South America and Middle East and Africa

  • What are the key growth drivers and market challenges?

    • Accelerated digital transformation and API Integration, Escalating regulatory compliance and data sovereignty complexities

  • Who are the major players in the Bancassurance Market?

    • ABN AMRO Group NV, American Express Co., ANZ Banking Group Ltd., AXA Group, Banco Bradesco SA, Banco Santander SA, Barclays Bank Plc, Citigroup Inc., CNA Financial Corp., Credit Agricole SA, Credit Mutuel group, HSBC Holdings Plc, ING Groep NV, Intesa Sanpaolo Group, Lloyds Banking Group Plc, Metlife Inc., Nordes Bank Abp, Wells Fargo and Co. and Yes Bank Ltd.

Market Research Insights

  • The Bancassurance Market relies heavily on continuous innovation within regulatory compliance frameworks to ensure secure and efficient service delivery. Institutions implementing robust data privacy protocols have successfully mitigated risk, resulting in a 25% reduction in compliance-related processing delays.
  • Furthermore, the integration of automated anti-money laundering processes and advanced know your customer streamlining technologies has improved client onboarding efficiency by 30%, directly lowering operational overhead. These structural enhancements are essential for supporting broader financial inclusion initiatives across diverse global demographics.
  • By optimizing these critical back-office functions, financial institutions maintain stringent regulatory alignment while simultaneously accelerating the time-to-market for complex, bundled wealth management and insurance solutions.

We can help! Our analysts can customize this bancassurance market research report to meet your requirements.

Get in touch

1. Executive Summary

1.1 Market overview

Executive Summary - Chart on Market Overview
Executive Summary - Data Table on Market Overview
Executive Summary - Chart on Global Market Characteristics
Executive Summary - Chart on Market by Geography
Executive Summary - Chart on Market Segmentation by Product
Executive Summary - Chart on Market Segmentation by Type
Executive Summary - Chart on Market Segmentation by End-user
Executive Summary - Chart on Incremental Growth
Executive Summary - Data Table on Incremental Growth
Executive Summary - Chart on Company Market Positioning

2. Technavio Analysis

2.1 Analysis of price sensitivity, lifecycle, customer purchase basket, adoption rates, and purchase criteria

2.2 Criticality of inputs and Factors of differentiation

Chart on Overview on criticality of inputs and factors of differentiation

2.3 Factors of disruption

Chart on Overview on factors of disruption

2.4 Impact of drivers and challenges

Chart on Impact of drivers and challenges in 2025 and 2030

3. Market Landscape

3.1 Market ecosystem

Chart on Parent Market
Data Table on - Parent Market

3.2 Market characteristics

Chart on Market characteristics analysis

3.3 Value chain analysis

Chart on Value chain analysis

4. Market Sizing

4.1 Market definition

Data Table on Offerings of companies included in the market definition

4.2 Market segment analysis

Market segments

4.3 Market size 2025

4.4 Market outlook: Forecast for 2025-2030

Chart on Global - Market size and forecast 2025-2030 ($ billion)
Data Table on Global - Market size and forecast 2025-2030 ($ billion)
Chart on Global Market: Year-over-year growth 2025-2030 (%)
Data Table on Global Market: Year-over-year growth 2025-2030 (%)

5. Historic Market Size

5.1 Global Bancassurance Market 2020 - 2024

Historic Market Size - Data Table on Global Bancassurance Market 2020 - 2024 ($ billion)

5.2 Product segment analysis 2020 - 2024

Historic Market Size - Product Segment 2020 - 2024 ($ billion)

5.3 Type segment analysis 2020 - 2024

Historic Market Size - Type Segment 2020 - 2024 ($ billion)

5.4 End-user segment analysis 2020 - 2024

Historic Market Size - End-user Segment 2020 - 2024 ($ billion)

5.5 Geography segment analysis 2020 - 2024

Historic Market Size - Geography Segment 2020 - 2024 ($ billion)

5.6 Country segment analysis 2020 - 2024

Historic Market Size - Country Segment 2020 - 2024 ($ billion)

6. Qualitative Analysis

6.1 Impact of AI in Global Bancassurance Market

6.2 Impact of Geopolitical Conflicts on Global Bancassurance Market

7. Five Forces Analysis

7.1 Five forces summary

Five forces analysis - Comparison between 2025 and 2030

7.2 Bargaining power of buyers

Bargaining power of buyers - Impact of key factors 2025 and 2030

7.3 Bargaining power of suppliers

Bargaining power of suppliers - Impact of key factors in 2025 and 2030

7.4 Threat of new entrants

Threat of new entrants - Impact of key factors in 2025 and 2030

7.5 Threat of substitutes

Threat of substitutes - Impact of key factors in 2025 and 2030

7.6 Threat of rivalry

Threat of rivalry - Impact of key factors in 2025 and 2030

7.7 Market condition

Chart on Market condition - Five forces 2025 and 2030

8. Market Segmentation by Product

8.1 Market segments

Chart on Product - Market share 2025-2030 (%)
Data Table on Product - Market share 2025-2030 (%)

8.2 Comparison by Product

Chart on Comparison by Product
Data Table on Comparison by Product

8.3 Life bancassurance - Market size and forecast 2025-2030

Chart on Life bancassurance - Market size and forecast 2025-2030 ($ billion)
Data Table on Life bancassurance - Market size and forecast 2025-2030 ($ billion)
Chart on Life bancassurance - Year-over-year growth 2025-2030 (%)
Data Table on Life bancassurance - Year-over-year growth 2025-2030 (%)

8.4 Non-life bancassurance - Market size and forecast 2025-2030

Chart on Non-life bancassurance - Market size and forecast 2025-2030 ($ billion)
Data Table on Non-life bancassurance - Market size and forecast 2025-2030 ($ billion)
Chart on Non-life bancassurance - Year-over-year growth 2025-2030 (%)
Data Table on Non-life bancassurance - Year-over-year growth 2025-2030 (%)

8.5 Market opportunity by Product

Market opportunity by Product ($ billion)
Data Table on Market opportunity by Product ($ billion)

9. Market Segmentation by Type

9.1 Market segments

Chart on Type - Market share 2025-2030 (%)
Data Table on Type - Market share 2025-2030 (%)

9.2 Comparison by Type

Chart on Comparison by Type
Data Table on Comparison by Type

9.3 Pure distributor - Market size and forecast 2025-2030

Chart on Pure distributor - Market size and forecast 2025-2030 ($ billion)
Data Table on Pure distributor - Market size and forecast 2025-2030 ($ billion)
Chart on Pure distributor - Year-over-year growth 2025-2030 (%)
Data Table on Pure distributor - Year-over-year growth 2025-2030 (%)

9.4 Joint venture - Market size and forecast 2025-2030

Chart on Joint venture - Market size and forecast 2025-2030 ($ billion)
Data Table on Joint venture - Market size and forecast 2025-2030 ($ billion)
Chart on Joint venture - Year-over-year growth 2025-2030 (%)
Data Table on Joint venture - Year-over-year growth 2025-2030 (%)

9.5 Excusive partnership - Market size and forecast 2025-2030

Chart on Excusive partnership - Market size and forecast 2025-2030 ($ billion)
Data Table on Excusive partnership - Market size and forecast 2025-2030 ($ billion)
Chart on Excusive partnership - Year-over-year growth 2025-2030 (%)
Data Table on Excusive partnership - Year-over-year growth 2025-2030 (%)

9.6 Financial holding - Market size and forecast 2025-2030

Chart on Financial holding - Market size and forecast 2025-2030 ($ billion)
Data Table on Financial holding - Market size and forecast 2025-2030 ($ billion)
Chart on Financial holding - Year-over-year growth 2025-2030 (%)
Data Table on Financial holding - Year-over-year growth 2025-2030 (%)

9.7 Market opportunity by Type

Market opportunity by Type ($ billion)
Data Table on Market opportunity by Type ($ billion)

10. Market Segmentation by End-user

10.1 Market segments

Chart on End-user - Market share 2025-2030 (%)
Data Table on End-user - Market share 2025-2030 (%)

10.2 Comparison by End-user

Chart on Comparison by End-user
Data Table on Comparison by End-user

10.3 Personal - Market size and forecast 2025-2030

Chart on Personal - Market size and forecast 2025-2030 ($ billion)
Data Table on Personal - Market size and forecast 2025-2030 ($ billion)
Chart on Personal - Year-over-year growth 2025-2030 (%)
Data Table on Personal - Year-over-year growth 2025-2030 (%)

10.4 Business - Market size and forecast 2025-2030

Chart on Business - Market size and forecast 2025-2030 ($ billion)
Data Table on Business - Market size and forecast 2025-2030 ($ billion)
Chart on Business - Year-over-year growth 2025-2030 (%)
Data Table on Business - Year-over-year growth 2025-2030 (%)

10.5 Market opportunity by End-user

Market opportunity by End-user ($ billion)
Data Table on Market opportunity by End-user ($ billion)

11. Customer Landscape

11.1 Customer landscape overview

Analysis of price sensitivity, lifecycle, customer purchase basket, adoption rates, and purchase criteria

12. Geographic Landscape

12.1 Geographic segmentation

Chart on Market share by geography 2025-2030 (%)
Data Table on Market share by geography 2025-2030 (%)

12.2 Geographic comparison

Chart on Geographic comparison
Data Table on Geographic comparison

12.3 APAC - Market size and forecast 2025-2030

Chart on APAC - Market size and forecast 2025-2030 ($ billion)
Data Table on APAC - Market size and forecast 2025-2030 ($ billion)
Chart on APAC - Year-over-year growth 2025-2030 (%)
Data Table on APAC - Year-over-year growth 2025-2030 (%)
Chart on Regional Comparison - APAC
Data Table on Regional Comparison - APAC

12.3.1 China - Market size and forecast 2025-2030

Chart on China - Market size and forecast 2025-2030 ($ billion)
Data Table on China - Market size and forecast 2025-2030 ($ billion)
Chart on China - Year-over-year growth 2025-2030 (%)
Data Table on China - Year-over-year growth 2025-2030 (%)

12.3.2 India - Market size and forecast 2025-2030

Chart on India - Market size and forecast 2025-2030 ($ billion)
Data Table on India - Market size and forecast 2025-2030 ($ billion)
Chart on India - Year-over-year growth 2025-2030 (%)
Data Table on India - Year-over-year growth 2025-2030 (%)

12.3.3 Japan - Market size and forecast 2025-2030

Chart on Japan - Market size and forecast 2025-2030 ($ billion)
Data Table on Japan - Market size and forecast 2025-2030 ($ billion)
Chart on Japan - Year-over-year growth 2025-2030 (%)
Data Table on Japan - Year-over-year growth 2025-2030 (%)

12.3.4 South Korea - Market size and forecast 2025-2030

Chart on South Korea - Market size and forecast 2025-2030 ($ billion)
Data Table on South Korea - Market size and forecast 2025-2030 ($ billion)
Chart on South Korea - Year-over-year growth 2025-2030 (%)
Data Table on South Korea - Year-over-year growth 2025-2030 (%)

12.3.5 Australia - Market size and forecast 2025-2030

Chart on Australia - Market size and forecast 2025-2030 ($ billion)
Data Table on Australia - Market size and forecast 2025-2030 ($ billion)
Chart on Australia - Year-over-year growth 2025-2030 (%)
Data Table on Australia - Year-over-year growth 2025-2030 (%)

12.3.6 Indonesia - Market size and forecast 2025-2030

Chart on Indonesia - Market size and forecast 2025-2030 ($ billion)
Data Table on Indonesia - Market size and forecast 2025-2030 ($ billion)
Chart on Indonesia - Year-over-year growth 2025-2030 (%)
Data Table on Indonesia - Year-over-year growth 2025-2030 (%)

12.4 Europe - Market size and forecast 2025-2030

Chart on Europe - Market size and forecast 2025-2030 ($ billion)
Data Table on Europe - Market size and forecast 2025-2030 ($ billion)
Chart on Europe - Year-over-year growth 2025-2030 (%)
Data Table on Europe - Year-over-year growth 2025-2030 (%)
Chart on Regional Comparison - Europe
Data Table on Regional Comparison - Europe

12.4.1 Germany - Market size and forecast 2025-2030

Chart on Germany - Market size and forecast 2025-2030 ($ billion)
Data Table on Germany - Market size and forecast 2025-2030 ($ billion)
Chart on Germany - Year-over-year growth 2025-2030 (%)
Data Table on Germany - Year-over-year growth 2025-2030 (%)

12.4.2 UK - Market size and forecast 2025-2030

Chart on UK - Market size and forecast 2025-2030 ($ billion)
Data Table on UK - Market size and forecast 2025-2030 ($ billion)
Chart on UK - Year-over-year growth 2025-2030 (%)
Data Table on UK - Year-over-year growth 2025-2030 (%)

12.4.3 France - Market size and forecast 2025-2030

Chart on France - Market size and forecast 2025-2030 ($ billion)
Data Table on France - Market size and forecast 2025-2030 ($ billion)
Chart on France - Year-over-year growth 2025-2030 (%)
Data Table on France - Year-over-year growth 2025-2030 (%)

12.4.4 Italy - Market size and forecast 2025-2030

Chart on Italy - Market size and forecast 2025-2030 ($ billion)
Data Table on Italy - Market size and forecast 2025-2030 ($ billion)
Chart on Italy - Year-over-year growth 2025-2030 (%)
Data Table on Italy - Year-over-year growth 2025-2030 (%)

12.4.5 Spain - Market size and forecast 2025-2030

Chart on Spain - Market size and forecast 2025-2030 ($ billion)
Data Table on Spain - Market size and forecast 2025-2030 ($ billion)
Chart on Spain - Year-over-year growth 2025-2030 (%)
Data Table on Spain - Year-over-year growth 2025-2030 (%)

12.4.6 The Netherlands - Market size and forecast 2025-2030

Chart on The Netherlands - Market size and forecast 2025-2030 ($ billion)
Data Table on The Netherlands - Market size and forecast 2025-2030 ($ billion)
Chart on The Netherlands - Year-over-year growth 2025-2030 (%)
Data Table on The Netherlands - Year-over-year growth 2025-2030 (%)

12.5 North America - Market size and forecast 2025-2030

Chart on North America - Market size and forecast 2025-2030 ($ billion)
Data Table on North America - Market size and forecast 2025-2030 ($ billion)
Chart on North America - Year-over-year growth 2025-2030 (%)
Data Table on North America - Year-over-year growth 2025-2030 (%)
Chart on Regional Comparison - North America
Data Table on Regional Comparison - North America

12.5.1 US - Market size and forecast 2025-2030

Chart on US - Market size and forecast 2025-2030 ($ billion)
Data Table on US - Market size and forecast 2025-2030 ($ billion)
Chart on US - Year-over-year growth 2025-2030 (%)
Data Table on US - Year-over-year growth 2025-2030 (%)

12.5.2 Canada - Market size and forecast 2025-2030

Chart on Canada - Market size and forecast 2025-2030 ($ billion)
Data Table on Canada - Market size and forecast 2025-2030 ($ billion)
Chart on Canada - Year-over-year growth 2025-2030 (%)
Data Table on Canada - Year-over-year growth 2025-2030 (%)

12.5.3 Mexico - Market size and forecast 2025-2030

Chart on Mexico - Market size and forecast 2025-2030 ($ billion)
Data Table on Mexico - Market size and forecast 2025-2030 ($ billion)
Chart on Mexico - Year-over-year growth 2025-2030 (%)
Data Table on Mexico - Year-over-year growth 2025-2030 (%)

12.6 South America - Market size and forecast 2025-2030

Chart on South America - Market size and forecast 2025-2030 ($ billion)
Data Table on South America - Market size and forecast 2025-2030 ($ billion)
Chart on South America - Year-over-year growth 2025-2030 (%)
Data Table on South America - Year-over-year growth 2025-2030 (%)
Chart on Regional Comparison - South America
Data Table on Regional Comparison - South America

12.6.1 Brazil - Market size and forecast 2025-2030

Chart on Brazil - Market size and forecast 2025-2030 ($ billion)
Data Table on Brazil - Market size and forecast 2025-2030 ($ billion)
Chart on Brazil - Year-over-year growth 2025-2030 (%)
Data Table on Brazil - Year-over-year growth 2025-2030 (%)

12.6.2 Argentina - Market size and forecast 2025-2030

Chart on Argentina - Market size and forecast 2025-2030 ($ billion)
Data Table on Argentina - Market size and forecast 2025-2030 ($ billion)
Chart on Argentina - Year-over-year growth 2025-2030 (%)
Data Table on Argentina - Year-over-year growth 2025-2030 (%)

12.6.3 Colombia - Market size and forecast 2025-2030

Chart on Colombia - Market size and forecast 2025-2030 ($ billion)
Data Table on Colombia - Market size and forecast 2025-2030 ($ billion)
Chart on Colombia - Year-over-year growth 2025-2030 (%)
Data Table on Colombia - Year-over-year growth 2025-2030 (%)

12.7 Middle East and Africa - Market size and forecast 2025-2030

Chart on Middle East and Africa - Market size and forecast 2025-2030 ($ billion)
Data Table on Middle East and Africa - Market size and forecast 2025-2030 ($ billion)
Chart on Middle East and Africa - Year-over-year growth 2025-2030 (%)
Data Table on Middle East and Africa - Year-over-year growth 2025-2030 (%)
Chart on Regional Comparison - Middle East and Africa
Data Table on Regional Comparison - Middle East and Africa

12.7.1 UAE - Market size and forecast 2025-2030

Chart on UAE - Market size and forecast 2025-2030 ($ billion)
Data Table on UAE - Market size and forecast 2025-2030 ($ billion)
Chart on UAE - Year-over-year growth 2025-2030 (%)
Data Table on UAE - Year-over-year growth 2025-2030 (%)

12.7.2 Saudi Arabia - Market size and forecast 2025-2030

Chart on Saudi Arabia - Market size and forecast 2025-2030 ($ billion)
Data Table on Saudi Arabia - Market size and forecast 2025-2030 ($ billion)
Chart on Saudi Arabia - Year-over-year growth 2025-2030 (%)
Data Table on Saudi Arabia - Year-over-year growth 2025-2030 (%)

12.7.3 South Africa - Market size and forecast 2025-2030

Chart on South Africa - Market size and forecast 2025-2030 ($ billion)
Data Table on South Africa - Market size and forecast 2025-2030 ($ billion)
Chart on South Africa - Year-over-year growth 2025-2030 (%)
Data Table on South Africa - Year-over-year growth 2025-2030 (%)

12.7.4 Turkey - Market size and forecast 2025-2030

Chart on Turkey - Market size and forecast 2025-2030 ($ billion)
Data Table on Turkey - Market size and forecast 2025-2030 ($ billion)
Chart on Turkey - Year-over-year growth 2025-2030 (%)
Data Table on Turkey - Year-over-year growth 2025-2030 (%)

12.7.5 Israel - Market size and forecast 2025-2030

Chart on Israel - Market size and forecast 2025-2030 ($ billion)
Data Table on Israel - Market size and forecast 2025-2030 ($ billion)
Chart on Israel - Year-over-year growth 2025-2030 (%)
Data Table on Israel - Year-over-year growth 2025-2030 (%)

12.8 Market opportunity by geography

Market opportunity by geography ($ billion)
Data Tables on Market opportunity by geography ($ billion)

13. Drivers, Challenges, and Opportunity

13.1 Market drivers

Accelerated digital transformation and API Integration
Rising demand for customized wealth management and life insurance solutions
Strategic government support and financial inclusion initiatives

13.2 Market challenges

Escalating regulatory compliance and data sovereignty complexities
Legacy infrastructure inertia and digital integration barriers
Strategic cultural misalignment and sales force capability gaps

13.3 Impact of drivers and challenges

Impact of drivers and challenges in 2025 and 2030

13.4 Market opportunities

Accelerated integration of embedded insurance and API Ecosystems
Hyper-personalization through AI and predictive analytics
Expansion into holistic wealth management and retirement planning

14. Competitive Landscape

14.1 Overview

14.2

Overview on criticality of inputs and factors of differentiation

14.3 Landscape disruption

Overview on factors of disruption

14.4 Industry risks

Impact of key risks on business

15. Competitive Analysis

15.1 Companies profiled

Companies covered

15.2 Company ranking index

15.3 Market positioning of companies

Matrix on companies position and classification

15.4 ABN AMRO Group NV

ABN AMRO Group NV - Overview
ABN AMRO Group NV - Product / Service
ABN AMRO Group NV - Key offerings
SWOT

15.5 American Express Co.

American Express Co. - Overview
American Express Co. - Business segments
American Express Co. - Key offerings
American Express Co. - Segment focus
SWOT

15.6 ANZ Banking Group Ltd.

ANZ Banking Group Ltd. - Overview
ANZ Banking Group Ltd. - Business segments
ANZ Banking Group Ltd. - Key offerings
ANZ Banking Group Ltd. - Segment focus
SWOT

15.7 Banco Bradesco SA

Banco Bradesco SA - Overview
Banco Bradesco SA - Product / Service
Banco Bradesco SA - Key offerings
SWOT

15.8 Banco Santander SA

Banco Santander SA - Overview
Banco Santander SA - Business segments
Banco Santander SA - Key offerings
Banco Santander SA - Segment focus
SWOT

15.9 Barclays Bank Plc

Barclays Bank Plc - Overview
Barclays Bank Plc - Product / Service
Barclays Bank Plc - Key offerings
SWOT

15.10 Citigroup Inc.

Citigroup Inc. - Overview
Citigroup Inc. - Business segments
Citigroup Inc. - Key offerings
Citigroup Inc. - Segment focus
SWOT

15.11 Credit Agricole SA

Credit Agricole SA - Overview
Credit Agricole SA - Product / Service
Credit Agricole SA - Key offerings
SWOT

15.12 Credit Mutuel group

Credit Mutuel group - Overview
Credit Mutuel group - Product / Service
Credit Mutuel group - Key offerings
SWOT

15.13 HSBC Holdings Plc

HSBC Holdings Plc - Overview
HSBC Holdings Plc - Business segments
HSBC Holdings Plc - Key offerings
HSBC Holdings Plc - Segment focus
SWOT

15.14 ING Groep NV

ING Groep NV - Overview
ING Groep NV - Business segments
ING Groep NV - Key offerings
ING Groep NV - Segment focus
SWOT

15.15 Intesa Sanpaolo Group

Intesa Sanpaolo Group - Overview
Intesa Sanpaolo Group - Product / Service
Intesa Sanpaolo Group - Key offerings
SWOT

15.16 Lloyds Banking Group Plc

Lloyds Banking Group Plc - Overview
Lloyds Banking Group Plc - Business segments
Lloyds Banking Group Plc - Key offerings
Lloyds Banking Group Plc - Segment focus
SWOT

15.17 Metlife Inc.

Metlife Inc. - Overview
Metlife Inc. - Business segments
Metlife Inc. - Key offerings
Metlife Inc. - Segment focus
SWOT

15.18 Wells Fargo and Co.

Wells Fargo and Co. - Overview
Wells Fargo and Co. - Business segments
Wells Fargo and Co. - Key offerings
Wells Fargo and Co. - Segment focus
SWOT

16. Appendix

16.1 Scope of the report

Market definition
Objectives
Notes and caveats

16.2 Inclusions and exclusions checklist

Inclusions checklist
Exclusions checklist

16.3 Currency conversion rates for US$

16.4 Research methodology

16.5 Data procurement

Information sources

16.6 Data validation

16.7 Validation techniques employed for market sizing

16.8 Data synthesis

16.9 360 degree market analysis

16.10 List of abbreviations

Research Methodology

Technavio presents a detailed picture of the market by way of study, synthesis, and summation of data from multiple sources. The analysts have presented the various facets of the market with a particular focus on identifying the key industry influencers. The data thus presented is comprehensive, reliable, and the result of extensive research, both primary and secondary.

INFORMATION SOURCES

Primary sources

  • Manufacturers and suppliers
  • Channel partners
  • Industry experts
  • Strategic decision makers

Secondary sources

  • Industry journals and periodicals
  • Government data
  • Financial reports of key industry players
  • Historical data
  • Press releases

DATA ANALYSIS

Data Synthesis

  • Collation of data
  • Estimation of key figures
  • Analysis of derived insights

Data Validation

  • Triangulation with data models
  • Reference against proprietary databases
  • Corroboration with industry experts

REPORT WRITING

Qualitative

  • Market drivers
  • Market challenges
  • Market trends
  • Five forces analysis

Quantitative

  • Market size and forecast
  • Market segmentation
  • Geographical insights
  • Competitive landscape

Interested in this report?

Get your sample now to see our research methodology and insights!

Download Now

Frequently Asked Questions

Bancassurance market growth will increase by USD 713.9 billion during 2026-2030.

The Bancassurance market is expected to grow at a CAGR of 9.2% during 2026-2030.

Bancassurance market is segmented by Product (Life bancassurance, Non-life bancassurance) Type (Pure distributor, Joint venture, Excusive partnership, Financial holding) End-user (Personal, Business)

ABN AMRO Group NV, American Express Co., ANZ Banking Group Ltd., AXA Group, Banco Bradesco SA, Banco Santander SA, Barclays Bank Plc, Citigroup Inc., CNA Financial Corp., Credit Agricole SA, Credit Mutuel group, HSBC Holdings Plc, ING Groep NV, Intesa Sanpaolo Group, Lloyds Banking Group Plc, Metlife Inc., Nordes Bank Abp, Wells Fargo and Co., Yes Bank Ltd. are a few of the key vendors in the Bancassurance market.

APAC will register the highest growth rate of 46.7% among the other regions. Therefore, the Bancassurance market in APAC is expected to garner significant business opportunities for the vendors during the forecast period.

China, India, Japan, South Korea, Australia, Indonesia, Germany, UK, France, Italy, Spain, The Netherlands, US, Canada, Mexico, Brazil, Argentina, Colombia, UAE, Saudi Arabia, South Africa, Turkey, Israel

  • Accelerated digital transformation and API Integration is the driving factor this market.

The Bancassurance market vendors should focus on grabbing business opportunities from the Product segment as it accounted for the largest market share in the base year.
RIA - Research AI Assistant
Ask RIA