
AI In Energy Management Market Analysis, Size, and Forecast 2026-2030: APAC (China, India, and Japan), North America (US, Canada, and Mexico), Europe (Germany, UK, and France), South America (Brazil, Argentina, and Chile), Middle East and Africa (Saudi Arabia, UAE, and Turkey), and Rest of World (ROW)

AI In Energy Management Market Analysis, Size, and Forecast 2026-2030:
APAC (China, India, and Japan), North America (US, Canada, and Mexico), Europe (Germany, UK, and France), South America (Brazil, Argentina, and Chile), Middle East and Africa (Saudi Arabia, UAE, and Turkey), and Rest of World (ROW)

Published: Nov 2026 320 Pages SKU: IRTNTR81047

Market Overview at a Glance

$22.27 B
Market Opportunity
23.1%
CAGR 2025 - 2030
43.5%
APAC Growth
$2.96 B
Renewable energy management segment 2024

Ai In Energy Management Market Size 2026-2030

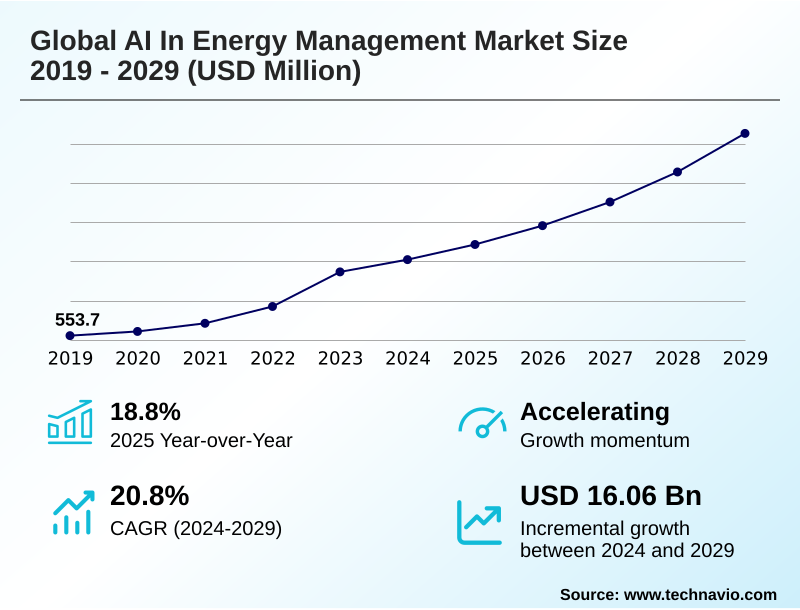
The ai in energy management market size is valued to increase by USD 22.27 billion, at a CAGR of 23.1% from 2025 to 2030. Rising energy consumption across data centers and digital infrastructure will drive the ai in energy management market.

Major Market Trends & Insights

  • APAC dominated the market and accounted for a 43.5% growth during the forecast period.
  • By Application - Renewable energy management segment was valued at USD 2.96 billion in 2024
  • By Technology - Machine learning segment accounted for the largest market revenue share in 2024

Market Size & Forecast

  • Market Opportunities: USD 33.34 billion
  • Market Future Opportunities: USD 22.27 billion
  • CAGR from 2025 to 2030 : 23.1%

Market Summary

  • The AI In Energy Management Market demonstrates robust expansion as digital intelligence increasingly dictates infrastructure efficiency. Enterprises are shifting from traditional monitoring toward autonomous agentic systems capable of predictive analytics and real-time execution. In complex data center operations, integrating deep learning frameworks and smart meter telemetry enables continuous thermal comfort regulation and facility cooling optimization.
  • This approach allows facility managers to reduce cooling-related power consumption by 18% compared to conventional reactive controls. Rising electricity demand across digital infrastructure drives the immediate need for distributed energy orchestration and automated load balancing. However, integrating these advanced neural network architectures with aging utility frameworks introduces high integration complexity.
  • Legacy infrastructure connectivity often requires substantial custom engineering, creating deployment delays and restricting seamless data privacy compliance. Despite these interoperability challenges, the continuous deployment of edge computing nodes and cloud-based analytics platforms provides actionable insights that directly align consumption patterns with stringent decarbonization targets.

What will be the Size of the Ai In Energy Management Market during the forecast period?
Get Key Insights on Market Forecast (PDF) Get Free Sample

How is the Ai In Energy Management Market Segmented?

The ai in energy management industry research report provides comprehensive data (region-wise segment analysis), with forecasts and estimates in "USD million" for the period 2026-2030, as well as historical data from 2020-2024 for the following segments.

  • Application
    • Renewable energy management
    • Demand forecasting
    • Grid management
    • Energy consumption optimization
    • Predictive maintenance
  • Technology
    • Machine learning
    • Predictive analytics
    • NLP
    • Computer vision
  • End-user
    • Utilities
    • Manufacturing
    • Residential
    • Retail
  • Geography
    • APAC
      • China
      • India
      • Japan
      • South Korea
      • Australia
      • Indonesia
    • North America
      • US
      • Canada
      • Mexico
    • Europe
      • Germany
      • UK
      • France
      • Italy
      • Spain
      • The Netherlands
    • South America
      • Brazil
      • Argentina
      • Chile
    • Middle East and Africa
      • Saudi Arabia
      • UAE
      • Turkey
      • South Africa
      • Israel

By Application Insights

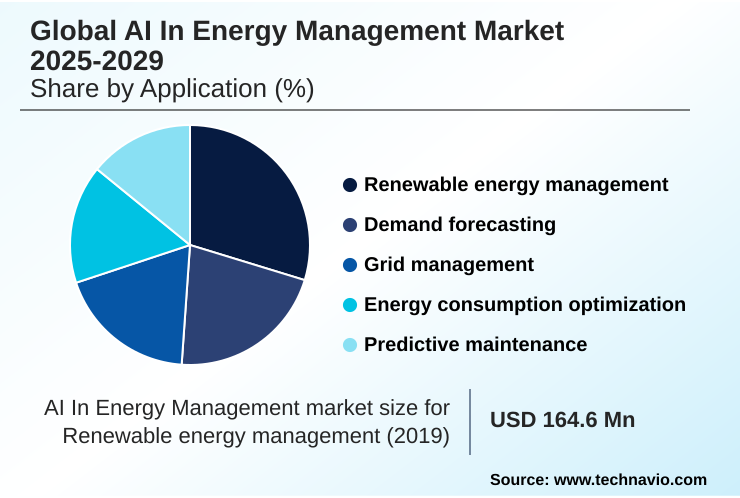
The renewable energy management segment is estimated to witness significant growth during the forecast period.

The application segment focuses heavily on coordinating variable power assets through precise renewable generation forecasting and continuous sensor data ingestion. Solar and wind installations experience fluctuating output due to complex weather condition telemetry and shifting supply demand equilibrium.

Intelligent platforms bypass legacy infrastructure connectivity issues to support automated load balancing and dynamic energy routing. By leveraging predictive analytics engines, operators identify underperformance and prioritize corrective actions seamlessly.

This data-driven approach enhances operational workflows, improving overall asset utilization rates by up to 15%. Integrating anomaly detection models allows facilities to recognize developing risks and adjust dispatch planning efficiently, ultimately strengthening grid resilience enhancement across geographically dispersed networks.
Get Free Sample

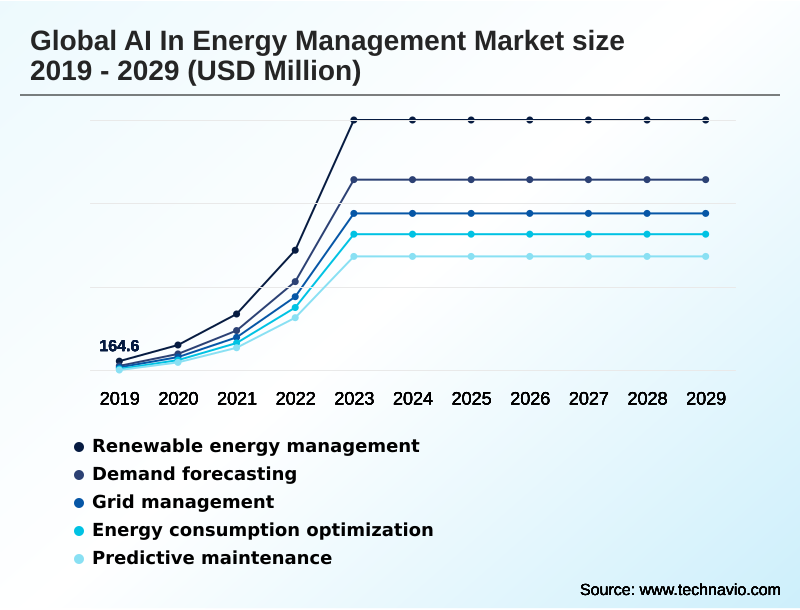
The Renewable energy management segment was valued at USD 2.96 billion in 2024 and showed a gradual increase during the forecast period.
Get Free Sample

Regional Analysis

APAC is estimated to contribute 43.5% to the growth of the global market during the forecast period.Technavio’s analysts have elaborately explained the regional trends and drivers that shape the market during the forecast period.
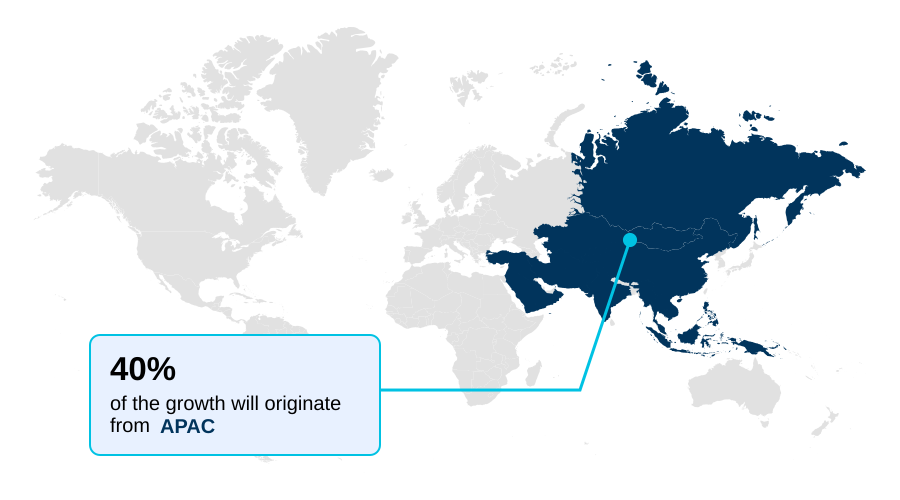
See How Ai In Energy Management Market Demand is Rising in APAC Get Free Sample

The geographic adoption of the AI In Energy Management Market reveals distinct operational priorities, particularly when comparing North America and APAC.

North America exhibits accelerated deployment of cloud based analytics platforms and decentralized grid management, achieving a 24% higher adoption rate of smart grid interoperability than APAC.

This difference stems from stringent regulatory pressures and extensive integration requirements in the United States and Canada. Conversely, APAC focuses heavily on rapid industrial facility automation and variable supply integration to support booming manufacturing sectors.

Enterprises in APAC have improved their fault isolation systems by 19% through aggressive investments in battery storage optimization and edge computing nodes.

By addressing unique regional supply chain requirements, businesses proactively mitigate predictive equipment failure to ensure continuous stability and maximize equipment lifecycle extension across critical energy infrastructure.

Market Dynamics

Our researchers analyzed the data with 2025 as the base year, along with the key drivers, trends, and challenges. A holistic analysis of drivers will help companies refine their marketing strategies to gain a competitive advantage.

  • The continuous evolution of the AI In Energy Management Market demonstrates how sophisticated digital tools are transforming industrial and utility operations. Organizations are increasingly adopting agentic autonomous energy infrastructure control to reduce human intervention and streamline facility planning. By leveraging digital twin integration for microgrids, grid operators can simulate complex scenarios, identifying operational bottlenecks before they affect physical assets.
  • This virtual modeling capability enhances supply chain and compliance strategies, allowing businesses to map regulatory constraints directly into their power distribution workflows. Furthermore, implementing machine learning based load forecasting enables utility providers to anticipate consumption spikes with high precision, optimizing their procurement strategies.
  • Compared to traditional statistical models, these advanced predictive engines improve resource allocation efficiency by over 20%, ensuring stable power delivery during peak demand. Field technicians are also benefiting from natural language operational data querying, which drastically accelerates the retrieval of critical equipment logs and maintenance records during urgent compliance audits.
  • Additionally, deploying computer vision for grid inspection allows utilities to detect physical degradation across thousands of miles of transmission lines without deploying manual survey teams. This convergence of advanced technologies ultimately strengthens operational planning, ensuring infrastructure remains resilient and highly adaptive to changing environmental conditions.
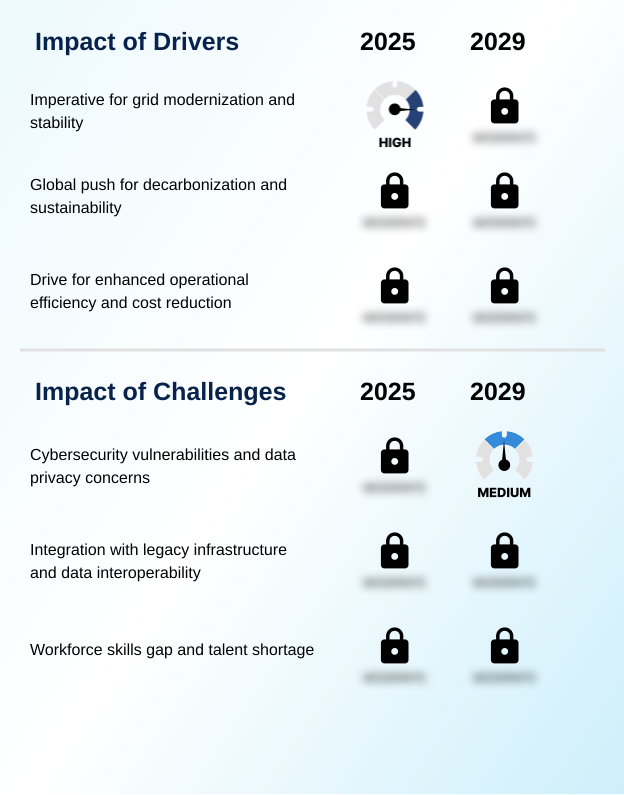
What are the key market drivers leading to the rise in the adoption of Ai In Energy Management Industry?

  • Rising energy consumption across data centers and expanding digital infrastructure acts as a primary catalyst accelerating the implementation of intelligent operational software.

  • The escalating power demands of digital infrastructure serve as a primary catalyst propelling the AI In Energy Management Market. Facilities are under immense pressure to execute precise facility cooling optimization and rigorous thermal comfort regulation to meet internal sustainability targets.
  • Because traditional logic cannot manage sudden thermal spikes, operators are rapidly deploying neural network architectures to process smart meter telemetry locally.
  • This localized intelligence allows businesses to lower overall energy use by 12% and improve energy usage telemetry accuracy by over 20%.
  • By automatically integrating deep learning frameworks with utility network coordination, organizations ensure accurate carbon emission tracking and continuous hvac energy reduction. These advanced predictive maintenance protocols significantly reduce overhead costs while safeguarding critical IT infrastructure against heat-related disruptions.

What are the market trends shaping the Ai In Energy Management Industry?

  • The growing adoption of agentic AI for autonomous operations represents a critical shift in modern infrastructure control. This advancement enables automated decision-making and dynamic resource allocation across complex operational environments.

  • A defining trend within the AI In Energy Management Market is the accelerated shift toward autonomous agentic systems and comprehensive digital twin simulations. Organizations are moving beyond basic monitoring, utilizing machine learning algorithms to automate distributed energy orchestration and continuous asset performance management.
  • This technological evolution is driven by the increasing complexity of grid architectures, requiring facilities to balance peak load shedding and automated alert generation dynamically. Consequently, operators leveraging these advanced environments have improved forecast accuracy by 18% and reduced unpredicted downtime during microgrid synchronization by nearly 30%. This proactive approach empowers enterprises to execute operational efficiency optimization seamlessly.
  • Such intelligent automation directly impacts business resilience, allowing organizations to maintain stringent power quality monitoring while adapting to evolving operational standards.

What challenges does the Ai In Energy Management Industry face during its growth?

  • High integration complexity across legacy infrastructure remains a significant structural barrier hindering seamless system interoperability and widespread technology deployment.

  • High integration complexity across fragmented legacy networks acts as a formidable structural challenge restraining the AI In Energy Management Market. Many industrial environments rely on outdated hardware lacking the robust cybersecurity protocol enforcement and data privacy compliance required for modern analytics.
  • Because connecting computer vision inspection tools and natural language processing interfaces to older controllers demands extensive custom engineering, organizations frequently encounter prolonged deployment cycles. Consequently, these interoperability bottlenecks have delayed real time demand response implementation, reducing anticipated efficiency gains by up to 15% in complex multi-site rollouts.
  • Furthermore, executing accurate historical consumption baselining across disconnected platforms increases integration overhead by roughly 25%. These technological barriers force businesses to invest heavily in intelligent building automation middleware before they can achieve secure voltage fluctuation control.

Exclusive Technavio Analysis on Customer Landscape

The ai in energy management market forecasting report includes the adoption lifecycle of the market, covering from the innovator’s stage to the laggard’s stage. It focuses on adoption rates in different regions based on penetration. Furthermore, the ai in energy management market report also includes key purchase criteria and drivers of price sensitivity to help companies evaluate and develop their market growth analysis strategies.
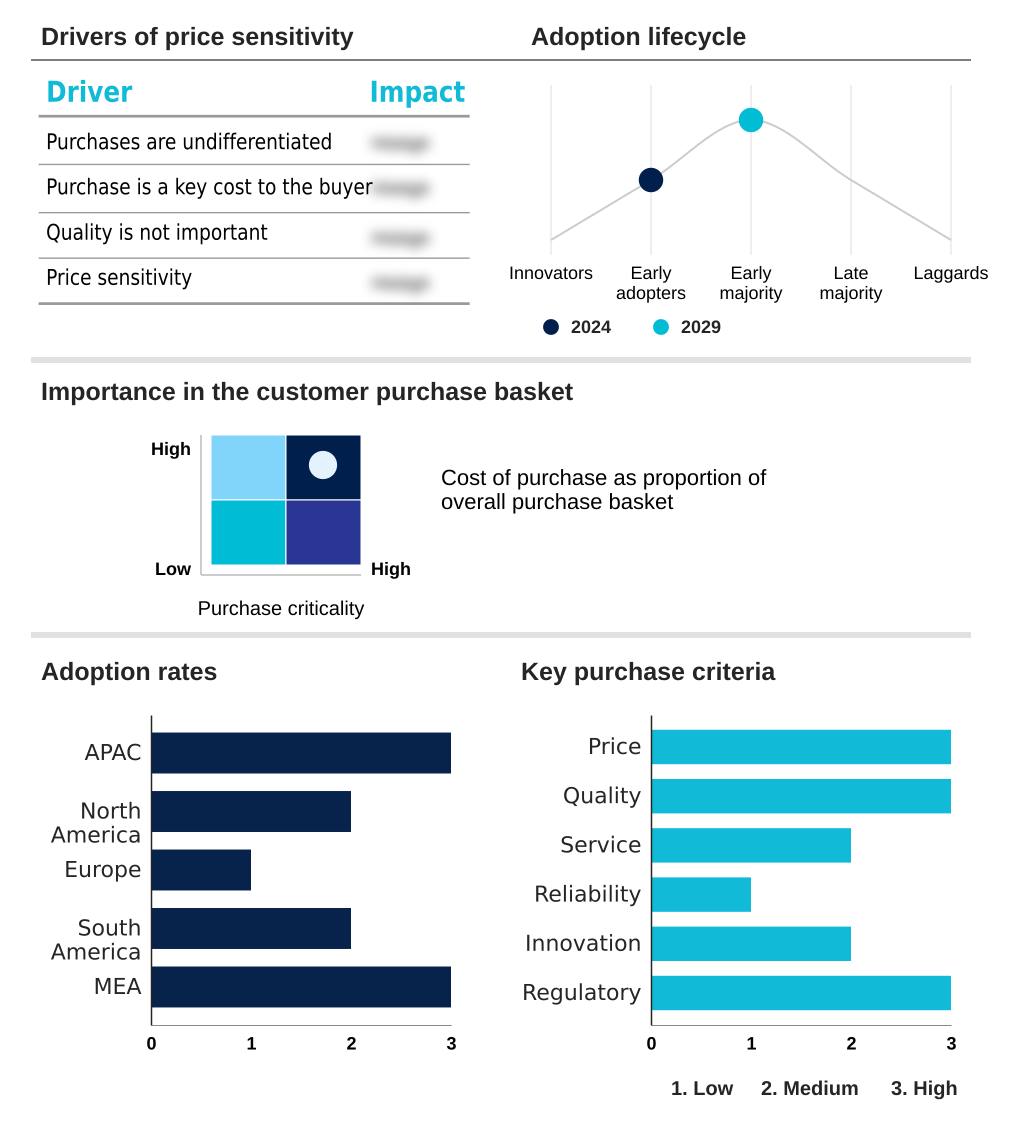
Customer Landscape of Ai In Energy Management Industry

Competitive Landscape

Companies are implementing various strategies, such as strategic alliances, ai in energy management market forecast, partnerships, mergers and acquisitions, geographical expansion, and product/service launches, to enhance their presence in the industry.

ABB Ltd. - The enterprise provides AI-driven electricity demand forecasting, predictive maintenance, and industrial automation software to optimize energy consumption and enhance asset performance management across digital infrastructure.

The industry research and growth report includes detailed analyses of the competitive landscape of the market and information about key companies, including:

  • ABB Ltd.
  • Amperon Inc.
  • Ardra AI
  • Arkco.ai
  • C3.ai Inc.
  • Elements Energies
  • Emerson Electric Co.
  • Ento
  • etalytics GmbH
  • GE Vernova Inc.
  • Hitachi Ltd.
  • Honeywell International Inc.
  • Johnson Controls International
  • Mitsubishi Electric Corp.
  • Rockwell Automation Inc.
  • Schneider Electric SE
  • Siemens AG
  • Tata Power Co. Ltd.
  • Trane Technologies Plc
  • Uplight Inc.

Qualitative and quantitative analysis of companies has been conducted to help clients understand the wider business environment as well as the strengths and weaknesses of key industry players. Data is qualitatively analyzed to categorize companies as pure play, category-focused, industry-focused, and diversified; it is quantitatively analyzed to categorize companies as dominant, leading, strong, tentative, and weak.

Recent Development and News in Ai in energy management market

  • In the Application Software industry, the transition toward cloud-based enterprise platforms has accelerated data processing capabilities, directly impacting AI In Energy Management demand by enabling dynamic energy routing mechanisms with latency reduced by over 25%.
  • The implementation of stringent data privacy compliance frameworks within digital environments has forced developers to embed decentralized security protocols into core architectures, securing operational energy usage telemetry processing for utility providers.
  • Advancements in workflow interoperability standards have facilitated seamless legacy infrastructure connectivity, allowing intelligent automation systems to integrate predictive algorithms and achieve up to a 20% improvement in historical consumption baselining.
  • The shift toward autonomous agentic systems in enterprise automation has reduced manual intervention in operational efficiency optimization, driving the adoption of edge computing to support predictive equipment failure detection with 99% uptime guarantees.

Dive into Technavio’s robust research methodology, blending expert interviews, extensive data synthesis, and validated models for unparalleled Ai In Energy Management Market insights. See full methodology.

Market Scope
Page number 320
Base year 2025
Historic period 2020-2024
Forecast period 2026-2030
Growth momentum & CAGR Accelerate at a CAGR of 23.1%
Market growth 2026-2030 USD 22273.6 million
Market structure Fragmented
YoY growth 2025-2026(%) 20.3%
Key countries China, India, Japan, South Korea, Australia, Indonesia, US, Canada, Mexico, Germany, UK, France, Italy, Spain, The Netherlands, Brazil, Argentina, Chile, Saudi Arabia, UAE, Turkey, South Africa and Israel
Competitive landscape Leading Companies, Market Positioning of Companies, Competitive Strategies, and Industry Risks

Request Free Sample

Research Analyst Overview

  • The AI In Energy Management Market is undergoing a structural transformation as enterprises transition from static monitoring to dynamic, predictive control systems. The integration of digital twin simulations and anomaly detection models enables operators to visualize asset health and automate complex distribution workflows.
  • Strategic decision-making in compliance and product planning is increasingly driven by carbon emission tracking capabilities, allowing organizations to align energy consumption directly with strict sustainability mandates. Companies utilizing these intelligent building automation systems have achieved a 30% reduction in data processing time during peak load management scenarios compared to legacy control frameworks.
  • This measurable acceleration in decision-making allows utilities to execute real-time demand response programs with unprecedented accuracy. Furthermore, deploying natural language processing interfaces and computer vision inspection tools streamlines maintenance scheduling and reduces unnecessary field dispatches. By embedding deep learning frameworks into their core infrastructure, energy providers continuously optimize asset performance management and fortify grid resilience against volatile supply conditions.

What are the Key Data Covered in this Ai In Energy Management Market Research and Growth Report?

  • What is the expected growth of the Ai In Energy Management Market between 2026 and 2030?

    • USD 22.27 billion, at a CAGR of 23.1%

  • What segmentation does the market report cover?

    • The report is segmented by Application (Renewable energy management, Demand forecasting, Grid management, Energy consumption optimization, and Predictive maintenance), Technology (Machine learning, Predictive analytics, NLP, and Computer vision), End-user (Utilities, Manufacturing, Residential, and Retail) and Geography (APAC, North America, Europe, South America, Middle East and Africa)

  • Which regions are analyzed in the report?

    • APAC, North America, Europe, South America and Middle East and Africa

  • What are the key growth drivers and market challenges?

    • Rising energy consumption across data centers and digital infrastructure, High integration complexity across legacy energy infrastructure

  • Who are the major players in the Ai In Energy Management Market?

    • ABB Ltd., Amperon Inc., Ardra AI, Arkco.ai, C3.ai Inc., Elements Energies, Emerson Electric Co., Ento, etalytics GmbH, GE Vernova Inc., Hitachi Ltd., Honeywell International Inc., Johnson Controls International, Mitsubishi Electric Corp., Rockwell Automation Inc., Schneider Electric SE, Siemens AG, Tata Power Co. Ltd., Trane Technologies Plc and Uplight Inc.

Market Research Insights

  • The AI In Energy Management Market is evolving rapidly as utilities and industrial enterprises prioritize operational efficiency optimization. By leveraging weather condition telemetry and historical consumption baselining, organizations can execute dynamic energy routing and peak load shedding seamlessly. Deployments of intelligent systems have improved fault isolation systems by 22%, significantly reducing costly operational downtime.
  • Additionally, integrating these platforms has enhanced HVAC energy reduction efforts, enabling facilities to decrease baseline power usage by up to 15% while maintaining strict data privacy compliance. These measurable improvements in supply demand equilibrium illustrate the critical transition from passive monitoring to proactive, data-driven resource orchestration.

We can help! Our analysts can customize this ai in energy management market research report to meet your requirements.

Get in touch

1. Executive Summary

1.1 Market overview

Executive Summary - Chart on Market Overview
Executive Summary - Data Table on Market Overview
Executive Summary - Chart on Global Market Characteristics
Executive Summary - Chart on Market by Geography
Executive Summary - Chart on Market Segmentation by Application
Executive Summary - Chart on Market Segmentation by Technology
Executive Summary - Chart on Market Segmentation by End-user
Executive Summary - Chart on Incremental Growth
Executive Summary - Data Table on Incremental Growth
Executive Summary - Chart on Company Market Positioning

2. Technavio Analysis

2.1 Analysis of price sensitivity, lifecycle, customer purchase basket, adoption rates, and purchase criteria

2.2 Criticality of inputs and Factors of differentiation

Chart on Overview on criticality of inputs and factors of differentiation

2.3 Factors of disruption

Chart on Overview on factors of disruption

2.4 Impact of drivers and challenges

Chart on Impact of drivers and challenges in 2025 and 2030

3. Market Landscape

3.1 Market ecosystem

Chart on Parent Market
Data Table on - Parent Market

3.2 Market characteristics

Chart on Market characteristics analysis

3.3 Value chain analysis

Chart on Value chain analysis

4. Market Sizing

4.1 Market definition

Data Table on Offerings of companies included in the market definition

4.2 Market segment analysis

Market segments

4.3 Market size 2025

4.4 Market outlook: Forecast for 2025-2030

Chart on Global - Market size and forecast 2025-2030 ($ million)
Data Table on Global - Market size and forecast 2025-2030 ($ million)
Chart on Global Market: Year-over-year growth 2025-2030 (%)
Data Table on Global Market: Year-over-year growth 2025-2030 (%)

5. Historic Market Size

5.1 Global AI In Energy Management Market 2020 - 2024

Historic Market Size - Data Table on Global AI In Energy Management Market 2020 - 2024 ($ million)

5.2 Application segment analysis 2020 - 2024

Historic Market Size - Application Segment 2020 - 2024 ($ million)

5.3 Technology segment analysis 2020 - 2024

Historic Market Size - Technology Segment 2020 - 2024 ($ million)

5.4 End-user segment analysis 2020 - 2024

Historic Market Size - End-user Segment 2020 - 2024 ($ million)

5.5 Geography segment analysis 2020 - 2024

Historic Market Size - Geography Segment 2020 - 2024 ($ million)

5.6 Country segment analysis 2020 - 2024

Historic Market Size - Country Segment 2020 - 2024 ($ million)

6. Qualitative Analysis

6.1 Impact of Geopolitical Conflicts on Global AI in Energy Management Market

7. Five Forces Analysis

7.1 Five forces summary

Five forces analysis - Comparison between 2025 and 2030

7.2 Bargaining power of buyers

Bargaining power of buyers - Impact of key factors 2025 and 2030

7.3 Bargaining power of suppliers

Bargaining power of suppliers - Impact of key factors in 2025 and 2030

7.4 Threat of new entrants

Threat of new entrants - Impact of key factors in 2025 and 2030

7.5 Threat of substitutes

Threat of substitutes - Impact of key factors in 2025 and 2030

7.6 Threat of rivalry

Threat of rivalry - Impact of key factors in 2025 and 2030

7.7 Market condition

Chart on Market condition - Five forces 2025 and 2030

8. Market Segmentation by Application

8.1 Market segments

Chart on Application - Market share 2025-2030 (%)
Data Table on Application - Market share 2025-2030 (%)

8.2 Comparison by Application

Chart on Comparison by Application
Data Table on Comparison by Application

8.3 Renewable energy management - Market size and forecast 2025-2030

Chart on Renewable energy management - Market size and forecast 2025-2030 ($ million)
Data Table on Renewable energy management - Market size and forecast 2025-2030 ($ million)
Chart on Renewable energy management - Year-over-year growth 2025-2030 (%)
Data Table on Renewable energy management - Year-over-year growth 2025-2030 (%)

8.4 Demand forecasting - Market size and forecast 2025-2030

Chart on Demand forecasting - Market size and forecast 2025-2030 ($ million)
Data Table on Demand forecasting - Market size and forecast 2025-2030 ($ million)
Chart on Demand forecasting - Year-over-year growth 2025-2030 (%)
Data Table on Demand forecasting - Year-over-year growth 2025-2030 (%)

8.5 Grid management - Market size and forecast 2025-2030

Chart on Grid management - Market size and forecast 2025-2030 ($ million)
Data Table on Grid management - Market size and forecast 2025-2030 ($ million)
Chart on Grid management - Year-over-year growth 2025-2030 (%)
Data Table on Grid management - Year-over-year growth 2025-2030 (%)

8.6 Energy consumption optimization - Market size and forecast 2025-2030

Chart on Energy consumption optimization - Market size and forecast 2025-2030 ($ million)
Data Table on Energy consumption optimization - Market size and forecast 2025-2030 ($ million)
Chart on Energy consumption optimization - Year-over-year growth 2025-2030 (%)
Data Table on Energy consumption optimization - Year-over-year growth 2025-2030 (%)

8.7 Predictive maintenance - Market size and forecast 2025-2030

Chart on Predictive maintenance - Market size and forecast 2025-2030 ($ million)
Data Table on Predictive maintenance - Market size and forecast 2025-2030 ($ million)
Chart on Predictive maintenance - Year-over-year growth 2025-2030 (%)
Data Table on Predictive maintenance - Year-over-year growth 2025-2030 (%)

8.8 Market opportunity by Application

Market opportunity by Application ($ million)
Data Table on Market opportunity by Application ($ million)

9. Market Segmentation by Technology

9.1 Market segments

Chart on Technology - Market share 2025-2030 (%)
Data Table on Technology - Market share 2025-2030 (%)

9.2 Comparison by Technology

Chart on Comparison by Technology
Data Table on Comparison by Technology

9.3 Machine learning - Market size and forecast 2025-2030

Chart on Machine learning - Market size and forecast 2025-2030 ($ million)
Data Table on Machine learning - Market size and forecast 2025-2030 ($ million)
Chart on Machine learning - Year-over-year growth 2025-2030 (%)
Data Table on Machine learning - Year-over-year growth 2025-2030 (%)

9.4 Predictive analytics - Market size and forecast 2025-2030

Chart on Predictive analytics - Market size and forecast 2025-2030 ($ million)
Data Table on Predictive analytics - Market size and forecast 2025-2030 ($ million)
Chart on Predictive analytics - Year-over-year growth 2025-2030 (%)
Data Table on Predictive analytics - Year-over-year growth 2025-2030 (%)

9.5 NLP - Market size and forecast 2025-2030

Chart on NLP - Market size and forecast 2025-2030 ($ million)
Data Table on NLP - Market size and forecast 2025-2030 ($ million)
Chart on NLP - Year-over-year growth 2025-2030 (%)
Data Table on NLP - Year-over-year growth 2025-2030 (%)

9.6 Computer vision - Market size and forecast 2025-2030

Chart on Computer vision - Market size and forecast 2025-2030 ($ million)
Data Table on Computer vision - Market size and forecast 2025-2030 ($ million)
Chart on Computer vision - Year-over-year growth 2025-2030 (%)
Data Table on Computer vision - Year-over-year growth 2025-2030 (%)

9.7 Market opportunity by Technology

Market opportunity by Technology ($ million)
Data Table on Market opportunity by Technology ($ million)

10. Market Segmentation by End-user

10.1 Market segments

Chart on End-user - Market share 2025-2030 (%)
Data Table on End-user - Market share 2025-2030 (%)

10.2 Comparison by End-user

Chart on Comparison by End-user
Data Table on Comparison by End-user

10.3 Utilities - Market size and forecast 2025-2030

Chart on Utilities - Market size and forecast 2025-2030 ($ million)
Data Table on Utilities - Market size and forecast 2025-2030 ($ million)
Chart on Utilities - Year-over-year growth 2025-2030 (%)
Data Table on Utilities - Year-over-year growth 2025-2030 (%)

10.4 Manufacturing - Market size and forecast 2025-2030

Chart on Manufacturing - Market size and forecast 2025-2030 ($ million)
Data Table on Manufacturing - Market size and forecast 2025-2030 ($ million)
Chart on Manufacturing - Year-over-year growth 2025-2030 (%)
Data Table on Manufacturing - Year-over-year growth 2025-2030 (%)

10.5 Residential - Market size and forecast 2025-2030

Chart on Residential - Market size and forecast 2025-2030 ($ million)
Data Table on Residential - Market size and forecast 2025-2030 ($ million)
Chart on Residential - Year-over-year growth 2025-2030 (%)
Data Table on Residential - Year-over-year growth 2025-2030 (%)

10.6 Retail - Market size and forecast 2025-2030

Chart on Retail - Market size and forecast 2025-2030 ($ million)
Data Table on Retail - Market size and forecast 2025-2030 ($ million)
Chart on Retail - Year-over-year growth 2025-2030 (%)
Data Table on Retail - Year-over-year growth 2025-2030 (%)

10.7 Market opportunity by End-user

Market opportunity by End-user ($ million)
Data Table on Market opportunity by End-user ($ million)

11. Customer Landscape

11.1 Customer landscape overview

Analysis of price sensitivity, lifecycle, customer purchase basket, adoption rates, and purchase criteria

12. Geographic Landscape

12.1 Geographic segmentation

Chart on Market share by geography 2025-2030 (%)
Data Table on Market share by geography 2025-2030 (%)

12.2 Geographic comparison

Chart on Geographic comparison
Data Table on Geographic comparison

12.3 APAC - Market size and forecast 2025-2030

Chart on APAC - Market size and forecast 2025-2030 ($ million)
Data Table on APAC - Market size and forecast 2025-2030 ($ million)
Chart on APAC - Year-over-year growth 2025-2030 (%)
Data Table on APAC - Year-over-year growth 2025-2030 (%)
Chart on Regional Comparison - APAC
Data Table on Regional Comparison - APAC

12.3.1 China - Market size and forecast 2025-2030

Chart on China - Market size and forecast 2025-2030 ($ million)
Data Table on China - Market size and forecast 2025-2030 ($ million)
Chart on China - Year-over-year growth 2025-2030 (%)
Data Table on China - Year-over-year growth 2025-2030 (%)

12.3.2 India - Market size and forecast 2025-2030

Chart on India - Market size and forecast 2025-2030 ($ million)
Data Table on India - Market size and forecast 2025-2030 ($ million)
Chart on India - Year-over-year growth 2025-2030 (%)
Data Table on India - Year-over-year growth 2025-2030 (%)

12.3.3 Japan - Market size and forecast 2025-2030

Chart on Japan - Market size and forecast 2025-2030 ($ million)
Data Table on Japan - Market size and forecast 2025-2030 ($ million)
Chart on Japan - Year-over-year growth 2025-2030 (%)
Data Table on Japan - Year-over-year growth 2025-2030 (%)

12.3.4 South Korea - Market size and forecast 2025-2030

Chart on South Korea - Market size and forecast 2025-2030 ($ million)
Data Table on South Korea - Market size and forecast 2025-2030 ($ million)
Chart on South Korea - Year-over-year growth 2025-2030 (%)
Data Table on South Korea - Year-over-year growth 2025-2030 (%)

12.3.5 Australia - Market size and forecast 2025-2030

Chart on Australia - Market size and forecast 2025-2030 ($ million)
Data Table on Australia - Market size and forecast 2025-2030 ($ million)
Chart on Australia - Year-over-year growth 2025-2030 (%)
Data Table on Australia - Year-over-year growth 2025-2030 (%)

12.3.6 Indonesia - Market size and forecast 2025-2030

Chart on Indonesia - Market size and forecast 2025-2030 ($ million)
Data Table on Indonesia - Market size and forecast 2025-2030 ($ million)
Chart on Indonesia - Year-over-year growth 2025-2030 (%)
Data Table on Indonesia - Year-over-year growth 2025-2030 (%)

12.4 North America - Market size and forecast 2025-2030

Chart on North America - Market size and forecast 2025-2030 ($ million)
Data Table on North America - Market size and forecast 2025-2030 ($ million)
Chart on North America - Year-over-year growth 2025-2030 (%)
Data Table on North America - Year-over-year growth 2025-2030 (%)
Chart on Regional Comparison - North America
Data Table on Regional Comparison - North America

12.4.1 US - Market size and forecast 2025-2030

Chart on US - Market size and forecast 2025-2030 ($ million)
Data Table on US - Market size and forecast 2025-2030 ($ million)
Chart on US - Year-over-year growth 2025-2030 (%)
Data Table on US - Year-over-year growth 2025-2030 (%)

12.4.2 Canada - Market size and forecast 2025-2030

Chart on Canada - Market size and forecast 2025-2030 ($ million)
Data Table on Canada - Market size and forecast 2025-2030 ($ million)
Chart on Canada - Year-over-year growth 2025-2030 (%)
Data Table on Canada - Year-over-year growth 2025-2030 (%)

12.4.3 Mexico - Market size and forecast 2025-2030

Chart on Mexico - Market size and forecast 2025-2030 ($ million)
Data Table on Mexico - Market size and forecast 2025-2030 ($ million)
Chart on Mexico - Year-over-year growth 2025-2030 (%)
Data Table on Mexico - Year-over-year growth 2025-2030 (%)

12.5 Europe - Market size and forecast 2025-2030

Chart on Europe - Market size and forecast 2025-2030 ($ million)
Data Table on Europe - Market size and forecast 2025-2030 ($ million)
Chart on Europe - Year-over-year growth 2025-2030 (%)
Data Table on Europe - Year-over-year growth 2025-2030 (%)
Chart on Regional Comparison - Europe
Data Table on Regional Comparison - Europe

12.5.1 Germany - Market size and forecast 2025-2030

Chart on Germany - Market size and forecast 2025-2030 ($ million)
Data Table on Germany - Market size and forecast 2025-2030 ($ million)
Chart on Germany - Year-over-year growth 2025-2030 (%)
Data Table on Germany - Year-over-year growth 2025-2030 (%)

12.5.2 UK - Market size and forecast 2025-2030

Chart on UK - Market size and forecast 2025-2030 ($ million)
Data Table on UK - Market size and forecast 2025-2030 ($ million)
Chart on UK - Year-over-year growth 2025-2030 (%)
Data Table on UK - Year-over-year growth 2025-2030 (%)

12.5.3 France - Market size and forecast 2025-2030

Chart on France - Market size and forecast 2025-2030 ($ million)
Data Table on France - Market size and forecast 2025-2030 ($ million)
Chart on France - Year-over-year growth 2025-2030 (%)
Data Table on France - Year-over-year growth 2025-2030 (%)

12.5.4 Italy - Market size and forecast 2025-2030

Chart on Italy - Market size and forecast 2025-2030 ($ million)
Data Table on Italy - Market size and forecast 2025-2030 ($ million)
Chart on Italy - Year-over-year growth 2025-2030 (%)
Data Table on Italy - Year-over-year growth 2025-2030 (%)

12.5.5 Spain - Market size and forecast 2025-2030

Chart on Spain - Market size and forecast 2025-2030 ($ million)
Data Table on Spain - Market size and forecast 2025-2030 ($ million)
Chart on Spain - Year-over-year growth 2025-2030 (%)
Data Table on Spain - Year-over-year growth 2025-2030 (%)

12.5.6 The Netherlands - Market size and forecast 2025-2030

Chart on The Netherlands - Market size and forecast 2025-2030 ($ million)
Data Table on The Netherlands - Market size and forecast 2025-2030 ($ million)
Chart on The Netherlands - Year-over-year growth 2025-2030 (%)
Data Table on The Netherlands - Year-over-year growth 2025-2030 (%)

12.6 South America - Market size and forecast 2025-2030

Chart on South America - Market size and forecast 2025-2030 ($ million)
Data Table on South America - Market size and forecast 2025-2030 ($ million)
Chart on South America - Year-over-year growth 2025-2030 (%)
Data Table on South America - Year-over-year growth 2025-2030 (%)
Chart on Regional Comparison - South America
Data Table on Regional Comparison - South America

12.6.1 Brazil - Market size and forecast 2025-2030

Chart on Brazil - Market size and forecast 2025-2030 ($ million)
Data Table on Brazil - Market size and forecast 2025-2030 ($ million)
Chart on Brazil - Year-over-year growth 2025-2030 (%)
Data Table on Brazil - Year-over-year growth 2025-2030 (%)

12.6.2 Argentina - Market size and forecast 2025-2030

Chart on Argentina - Market size and forecast 2025-2030 ($ million)
Data Table on Argentina - Market size and forecast 2025-2030 ($ million)
Chart on Argentina - Year-over-year growth 2025-2030 (%)
Data Table on Argentina - Year-over-year growth 2025-2030 (%)

12.6.3 Chile - Market size and forecast 2025-2030

Chart on Chile - Market size and forecast 2025-2030 ($ million)
Data Table on Chile - Market size and forecast 2025-2030 ($ million)
Chart on Chile - Year-over-year growth 2025-2030 (%)
Data Table on Chile - Year-over-year growth 2025-2030 (%)

12.7 Middle East and Africa - Market size and forecast 2025-2030

Chart on Middle East and Africa - Market size and forecast 2025-2030 ($ million)
Data Table on Middle East and Africa - Market size and forecast 2025-2030 ($ million)
Chart on Middle East and Africa - Year-over-year growth 2025-2030 (%)
Data Table on Middle East and Africa - Year-over-year growth 2025-2030 (%)
Chart on Regional Comparison - Middle East and Africa
Data Table on Regional Comparison - Middle East and Africa

12.7.1 Saudi Arabia - Market size and forecast 2025-2030

Chart on Saudi Arabia - Market size and forecast 2025-2030 ($ million)
Data Table on Saudi Arabia - Market size and forecast 2025-2030 ($ million)
Chart on Saudi Arabia - Year-over-year growth 2025-2030 (%)
Data Table on Saudi Arabia - Year-over-year growth 2025-2030 (%)

12.7.2 UAE - Market size and forecast 2025-2030

Chart on UAE - Market size and forecast 2025-2030 ($ million)
Data Table on UAE - Market size and forecast 2025-2030 ($ million)
Chart on UAE - Year-over-year growth 2025-2030 (%)
Data Table on UAE - Year-over-year growth 2025-2030 (%)

12.7.3 Turkey - Market size and forecast 2025-2030

Chart on Turkey - Market size and forecast 2025-2030 ($ million)
Data Table on Turkey - Market size and forecast 2025-2030 ($ million)
Chart on Turkey - Year-over-year growth 2025-2030 (%)
Data Table on Turkey - Year-over-year growth 2025-2030 (%)

12.7.4 South Africa - Market size and forecast 2025-2030

Chart on South Africa - Market size and forecast 2025-2030 ($ million)
Data Table on South Africa - Market size and forecast 2025-2030 ($ million)
Chart on South Africa - Year-over-year growth 2025-2030 (%)
Data Table on South Africa - Year-over-year growth 2025-2030 (%)

12.7.5 Israel - Market size and forecast 2025-2030

Chart on Israel - Market size and forecast 2025-2030 ($ million)
Data Table on Israel - Market size and forecast 2025-2030 ($ million)
Chart on Israel - Year-over-year growth 2025-2030 (%)
Data Table on Israel - Year-over-year growth 2025-2030 (%)

12.8 Market opportunity by geography

Market opportunity by geography ($ million)
Data Tables on Market opportunity by geography ($ million)

13. Drivers, Challenges, and Opportunity

13.1 Market drivers

Rising energy consumption across data centers and digital infrastructure
Increasing focus on sustainability and decarbonization objectives
Expansion of smart grids and distributed energy resources

13.2 Market challenges

High integration complexity across legacy energy infrastructure
Limited availability of skilled workforce and technical expertise
Cybersecurity and data privacy risks

13.3 Impact of drivers and challenges

Impact of drivers and challenges in 2025 and 2030

13.4 Market opportunities

Growing adoption of agentic AI for autonomous energy operations
Expansion of digital twin integration within energy management platforms
Transition toward unified energy intelligence ecosystems

14. Competitive Landscape

14.1 Overview

14.2

Overview on criticality of inputs and factors of differentiation

14.3 Landscape disruption

Overview on factors of disruption

14.4 Industry risks

Impact of key risks on business

15. Competitive Analysis

15.1 Companies profiled

Companies covered

15.2 Company ranking index

15.3 Market positioning of companies

Matrix on companies position and classification

15.4 ABB Ltd.

ABB Ltd. - Overview
ABB Ltd. - Business segments
ABB Ltd. - Key news
ABB Ltd. - Key offerings
ABB Ltd. - Segment focus
SWOT

15.5 Amperon Inc.

Amperon Inc. - Overview
Amperon Inc. - Product / Service
Amperon Inc. - Key offerings
SWOT

15.6 C3.ai Inc.

C3.ai Inc. - Overview
C3.ai Inc. - Product / Service
C3.ai Inc. - Key news
C3.ai Inc. - Key offerings
SWOT

15.7 Emerson Electric Co.

Emerson Electric Co. - Overview
Emerson Electric Co. - Business segments
Emerson Electric Co. - Key news
Emerson Electric Co. - Key offerings
Emerson Electric Co. - Segment focus
SWOT

15.8 GE Vernova Inc.

GE Vernova Inc. - Overview
GE Vernova Inc. - Business segments
GE Vernova Inc. - Key offerings
GE Vernova Inc. - Segment focus
SWOT

15.9 Hitachi Ltd.

Hitachi Ltd. - Overview
Hitachi Ltd. - Business segments
Hitachi Ltd. - Key offerings
Hitachi Ltd. - Segment focus
SWOT

15.10 Honeywell International Inc.

Honeywell International Inc. - Overview
Honeywell International Inc. - Business segments
Honeywell International Inc. - Key news
Honeywell International Inc. - Key offerings
Honeywell International Inc. - Segment focus
SWOT

15.11 Johnson Controls International

Johnson Controls International - Overview
Johnson Controls International - Business segments
Johnson Controls International - Key news
Johnson Controls International - Key offerings
Johnson Controls International - Segment focus
SWOT

15.12 Mitsubishi Electric Corp.

Mitsubishi Electric Corp. - Overview
Mitsubishi Electric Corp. - Business segments
Mitsubishi Electric Corp. - Key offerings
Mitsubishi Electric Corp. - Segment focus
SWOT

15.13 Rockwell Automation Inc.

Rockwell Automation Inc. - Overview
Rockwell Automation Inc. - Business segments
Rockwell Automation Inc. - Key news
Rockwell Automation Inc. - Key offerings
Rockwell Automation Inc. - Segment focus
SWOT

15.14 Schneider Electric SE

Schneider Electric SE - Overview
Schneider Electric SE - Business segments
Schneider Electric SE - Key news
Schneider Electric SE - Key offerings
Schneider Electric SE - Segment focus
SWOT

15.15 Siemens AG

Siemens AG - Overview
Siemens AG - Business segments
Siemens AG - Key news
Siemens AG - Key offerings
Siemens AG - Segment focus
SWOT

15.16 Tata Power Co. Ltd.

Tata Power Co. Ltd. - Overview
Tata Power Co. Ltd. - Business segments
Tata Power Co. Ltd. - Key news
Tata Power Co. Ltd. - Key offerings
Tata Power Co. Ltd. - Segment focus
SWOT

15.17 Trane Technologies Plc

Trane Technologies Plc - Overview
Trane Technologies Plc - Business segments
Trane Technologies Plc - Key offerings
Trane Technologies Plc - Segment focus
SWOT

15.18 Uplight Inc.

Uplight Inc. - Overview
Uplight Inc. - Product / Service
Uplight Inc. - Key offerings
SWOT

16. Appendix

16.1 Scope of the report

Market definition
Objectives
Notes and caveats

16.2 Inclusions and exclusions checklist

Inclusions checklist
Exclusions checklist

16.3 Currency conversion rates for US$

16.4 Research methodology

16.5 Data procurement

Information sources

16.6 Data validation

16.7 Validation techniques employed for market sizing

16.8 Data synthesis

16.9 360 degree market analysis

16.10 List of abbreviations

Research Methodology

Technavio presents a detailed picture of the market by way of study, synthesis, and summation of data from multiple sources. The analysts have presented the various facets of the market with a particular focus on identifying the key industry influencers. The data thus presented is comprehensive, reliable, and the result of extensive research, both primary and secondary.

INFORMATION SOURCES

Primary sources

  • Manufacturers and suppliers
  • Channel partners
  • Industry experts
  • Strategic decision makers

Secondary sources

  • Industry journals and periodicals
  • Government data
  • Financial reports of key industry players
  • Historical data
  • Press releases

DATA ANALYSIS

Data Synthesis

  • Collation of data
  • Estimation of key figures
  • Analysis of derived insights

Data Validation

  • Triangulation with data models
  • Reference against proprietary databases
  • Corroboration with industry experts

REPORT WRITING

Qualitative

  • Market drivers
  • Market challenges
  • Market trends
  • Five forces analysis

Quantitative

  • Market size and forecast
  • Market segmentation
  • Geographical insights
  • Competitive landscape

Interested in this report?

Get your sample now to see our research methodology and insights!

Download Now

Frequently Asked Questions

Ai In Energy Management market growth will increase by USD 22273.6 million during 2026-2030.

The Ai In Energy Management market is expected to grow at a CAGR of 23.1% during 2026-2030.

Ai In Energy Management market is segmented by Application (Renewable energy management, Demand forecasting, Grid management, Energy consumption optimization, Predictive maintenance) Technology (Machine learning, Predictive analytics, NLP, Computer vision) End-user (Utilities, Manufacturing, Residential, Retail)

ABB Ltd., Amperon Inc., Ardra AI, Arkco.ai, C3.ai Inc., Elements Energies, Emerson Electric Co., Ento, etalytics GmbH, GE Vernova Inc., Hitachi Ltd., Honeywell International Inc., Johnson Controls International, Mitsubishi Electric Corp., Rockwell Automation Inc., Schneider Electric SE, Siemens AG, Tata Power Co. Ltd., Trane Technologies Plc, Uplight Inc. are a few of the key vendors in the Ai In Energy Management market.

APAC will register the highest growth rate of 43.5% among the other regions. Therefore, the Ai In Energy Management market in APAC is expected to garner significant business opportunities for the vendors during the forecast period.

China, India, Japan, South Korea, Australia, Indonesia, US, Canada, Mexico, Germany, UK, France, Italy, Spain, The Netherlands, Brazil, Argentina, Chile, Saudi Arabia, UAE, Turkey, South Africa, Israel

  • Rising energy consumption across data centers and digital infrastructure is the driving factor this market.

The Ai In Energy Management market vendors should focus on grabbing business opportunities from the Application segment as it accounted for the largest market share in the base year.
RIA - Research AI Assistant
Ask RIA