
AI Edge Computing Market Analysis, Size, and Forecast 2026-2030: North America (US, Canada, and Mexico), Europe (Germany, UK, and France), APAC (China, Japan, and India), South America (Brazil, Argentina, and Chile), Middle East and Africa (Saudi Arabia, UAE, and South Africa), and Rest of World (ROW)

AI Edge Computing Market Analysis, Size, and Forecast 2026-2030:
North America (US, Canada, and Mexico), Europe (Germany, UK, and France), APAC (China, Japan, and India), South America (Brazil, Argentina, and Chile), Middle East and Africa (Saudi Arabia, UAE, and South Africa), and Rest of World (ROW)

Published: Nov 2026 304 Pages SKU: IRTNTR73643

Market Overview at a Glance

$63.76 B
Market Opportunity
31.8%
CAGR 2025 - 2030
59.8%
North America Growth
$12.13 B
Hardware segment 2024

Ai Edge Computing Market Size 2026-2030

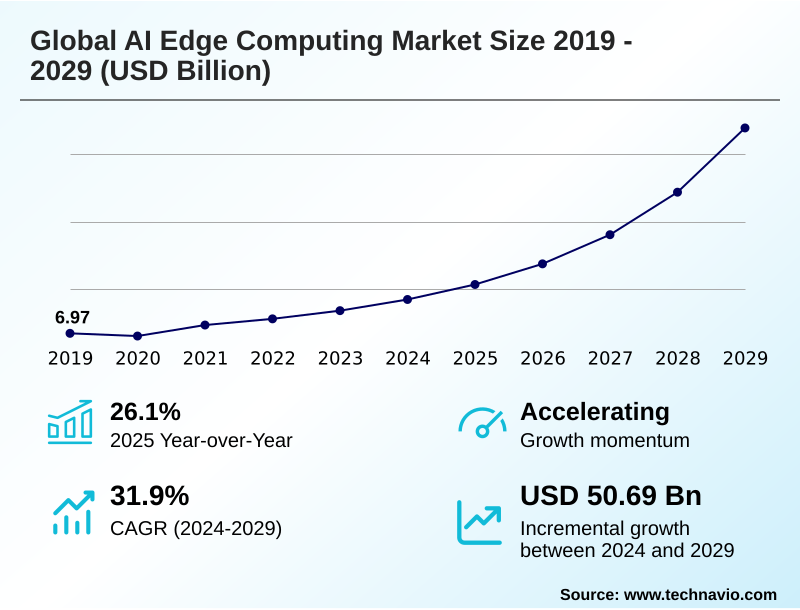
The ai edge computing market size is valued to increase by USD 63.76 billion, at a CAGR of 31.8% from 2025 to 2030. Critical imperative for ultra-low latency and real-time autonomous decision-making will drive the ai edge computing market.

Major Market Trends & Insights

  • North America dominated the market and accounted for a 59.8% growth during the forecast period.
  • By Type - Hardware segment was valued at USD 12.13 billion in 2024
  • By End-user - Video surveillance segment accounted for the largest market revenue share in 2024

Market Size & Forecast

  • Market Opportunities: USD 78.99 billion
  • Market Future Opportunities: USD 63.76 billion
  • CAGR from 2025 to 2030 : 31.8%

Market Summary

  • The AI Edge Computing Market reflects a profound structural migration from centralized hyperscale data centers toward localized, distributed operational environments. Enterprise demand for near-instantaneous processing capabilities accelerates this strategic transition across multiple vertical industries.
  • In automated automotive manufacturing, facilities deploy decentralized intelligence to facilitate real-time machine vision inspection, allowing systems to detect microscopic defects on fast-moving assembly lines without incurring network propagation delays. This localized execution reduces outbound data transportation overhead by up to 40% compared to traditional cloud reliance, generating substantial bandwidth cost optimization.
  • The critical imperative for deterministic loop cycles acts as a primary market driver, empowering operational technology assets to maintain functionality during wide area telecommunication links disconnects. Conversely, deploying complex neural architectures on constrained endpoints introduces significant thermal management constraints, challenging system designers to implement advanced thermal throttling mitigation techniques.
  • As embedded hardware innovators engineer more efficient silicon architectures, localized inference execution will progressively redefine industrial automation, ensuring operational continuity and strict adherence to localized data sovereignty mandates.

What will be the Size of the Ai Edge Computing Market during the forecast period?
Get Key Insights on Market Forecast (PDF) Get Free Sample

How is the Ai Edge Computing Market Segmented?

The ai edge computing industry research report provides comprehensive data (region-wise segment analysis), with forecasts and estimates in "USD million" for the period 2026-2030, as well as historical data from 2020-2024 for the following segments.

  • Type
    • Hardware
    • Software and services
  • End-user
    • Video surveillance
    • Remote monitoring
    • Access management
    • Autonomous vehicles
    • Others
  • Application
    • Consumer electronics
    • Smart cities
    • Automotive
  • Geography
    • North America
      • US
      • Canada
      • Mexico
    • Europe
      • Germany
      • UK
      • France
      • Italy
      • Spain
      • The Netherlands
    • APAC
      • China
      • Japan
      • India
      • South Korea
      • Australia
      • Indonesia
    • South America
      • Brazil
      • Argentina
      • Chile
    • Middle East and Africa
      • Saudi Arabia
      • UAE
      • South Africa
      • Israel
      • Turkey

By Type Insights

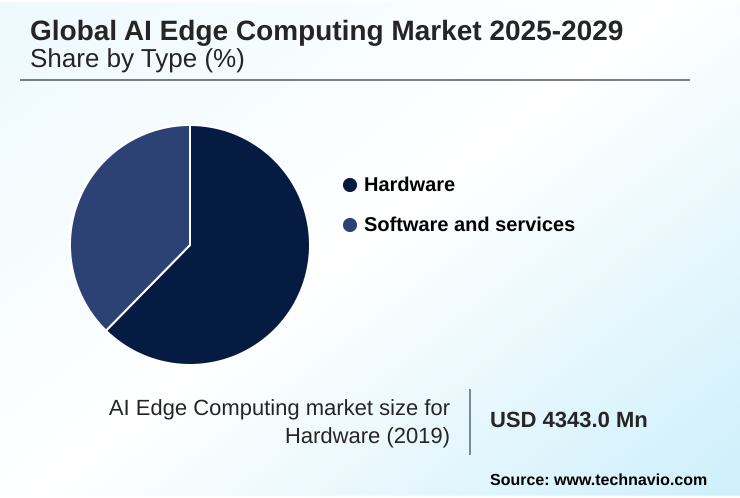
The hardware segment is estimated to witness significant growth during the forecast period.

Physical execution components form the foundational tier of localized intelligence, encompassing specialized microprocessors and accelerators. System designers across industrial automation and intelligent transportation increasingly demand dedicated silicon architectures capable of executing complex deep neural networks within strict thermal enclosures.

Organizations leveraging a modern neural processing unit achieve deterministic control without relying on continuous cloud connectivity. Processing raw sensor telemetry directly at the device perimeter eliminates round-trip latency and optimizes mathematical matrix operations for high-efficiency environments.

Equipment operating in harsh conditions requires ruggedized computing platforms to ensure uninterrupted performance and safety critical processing.

By integrating zero trust federated architectures at the silicon level, enterprises experience significant operational advantages, including a 15% improvement in defect detection accuracy on high-speed assembly lines, proving the critical business impact of dedicated inference engines.
Get Free Sample

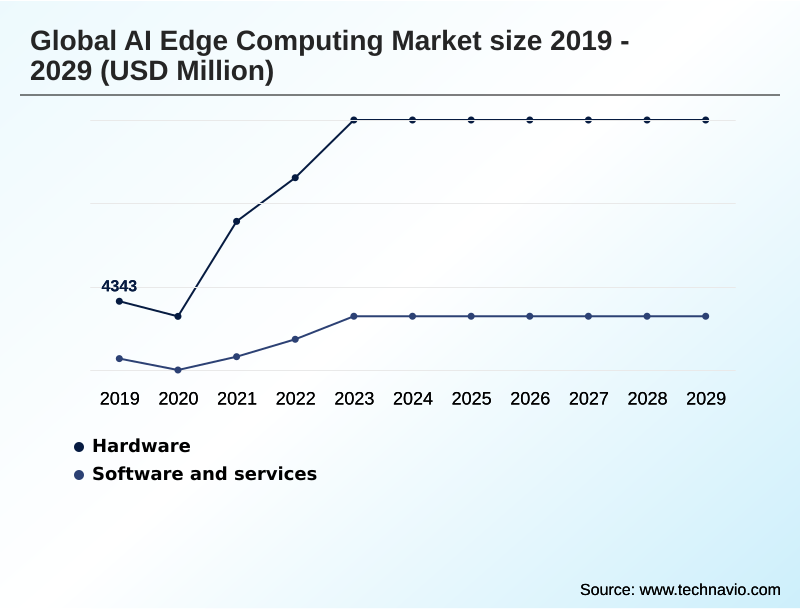
The Hardware segment was valued at USD 12.13 billion in 2024 and showed a gradual increase during the forecast period.
Get Free Sample

Regional Analysis

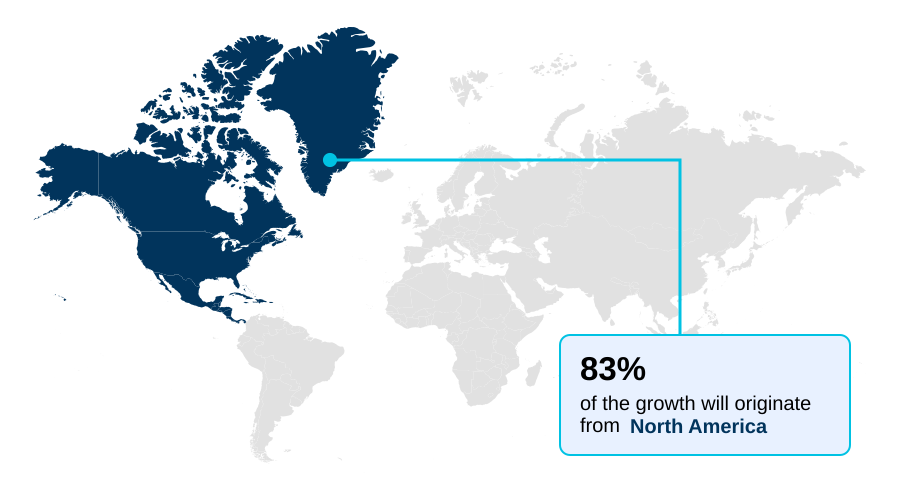
North America is estimated to contribute 59.8% to the growth of the global market during the forecast period.Technavio’s analysts have elaborately explained the regional trends and drivers that shape the market during the forecast period.
See How Ai Edge Computing Market Demand is Rising in North America Get Free Sample

Regional variations in the AI Edge Computing Market reveal distinct infrastructure modernization strategies between North America and Europe.

North America demonstrates a rapid acceleration in localized inference for industrial robotics, driven by a 35% higher integration rate of decentralized nodes across commercial logistics networks and intelligent highway interchanges compared to other regions.

This aggressive deployment enables enterprises to eliminate round-trip network latency and maintain deterministic control over remote industrial facilities.

In contrast, Europe prioritizes strict compliance with cross border privacy mandates, resulting in a 28% increase in high density edge deployments specifically engineered to anonymize sensitive visual telemetry before network transmission.

Consequently, European manufacturing sectors optimize operational expenditures by reducing wide area telecommunication links bandwidth consumption, whereas North American operators focus primarily on maximizing real-time throughput and autonomous vehicular responsiveness across expansive geographic footprints.

Market Dynamics

Our researchers analyzed the data with 2025 as the base year, along with the key drivers, trends, and challenges. A holistic analysis of drivers will help companies refine their marketing strategies to gain a competitive advantage.

  • The integration of localized intelligence fundamentally transforms how enterprises orchestrate decentralized operational technology asset management across demanding commercial environments. Organizations increasingly prioritize high efficiency silicon architecture adoption to bypass the latency inherent in centralized hyperscale data centers. This strategic pivot enables localized inference for industrial robotics, allowing automated assembly lines to react instantaneously to physical anomalies.
  • By executing real time autonomous decision making at the device level, manufacturers reduce unexpected mechanical downtime by approximately 20% compared to legacy architectures dependent on continuous cloud connectivity. Furthermore, on device multimodal foundation model deployment empowers field equipment to process complex language and visual data without transmitting sensitive proprietary information across vulnerable wide area networks.
  • To support these robust edge deployments, companies heavily utilize automated container management platform utilization, streamlining remote software updates and remote lifecycle orchestration. Addressing thermal dissipation in embedded processors remains a primary engineering priority, particularly for low power industrial gateway appliances operating in unconditioned environments. Overcoming these hardware limitations accelerates open source silicon architecture integration, fostering a more versatile developer ecosystem.
  • Additionally, real time multi sensor telemetry analytics provides deep operational visibility, while hardware root of trust implementation secures endpoints against unauthorized tampering. The convergence of these technologies facilitates physical artificial intelligence application scaling across both commercial and industrial sectors.
  • As embedded vision transformer algorithmic innovations advance alongside hybrid cloud federated architecture convergence, the reliance on standalone fifth generation cellular infrastructure will continually enhance the resilience and autonomy of localized business operations.
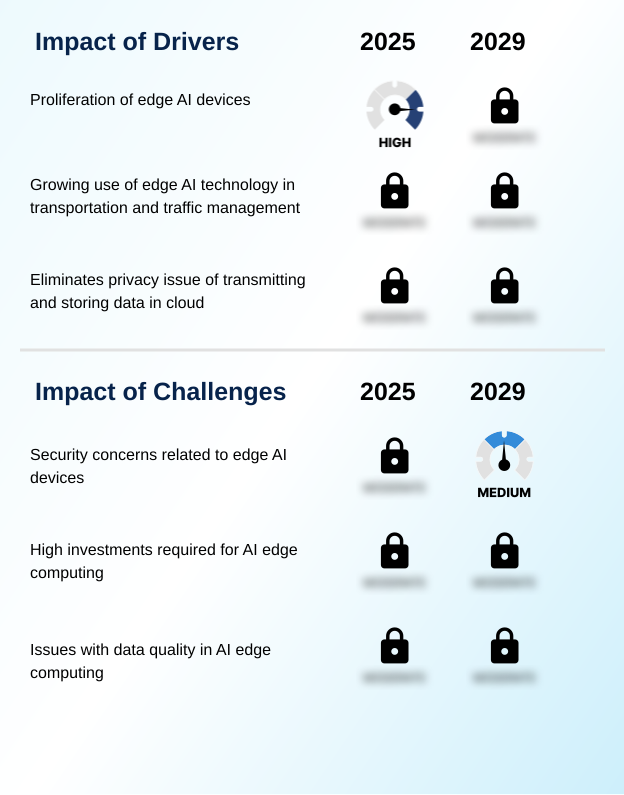
What are the key market drivers leading to the rise in the adoption of Ai Edge Computing Industry?

  • The critical imperative for ultra-low latency and real-time autonomous decision-making serves as a primary catalyst accelerating market expansion.

  • The non-negotiable requirement for deterministic execution in high-velocity physical environments acts as the primary catalyst for edge intelligence adoption.
  • Industrial manufacturing and mission-critical utilities increasingly rely on heterogeneous processor topologies to process sensor streams instantly, bypassing the fundamental propagation delays of wide area telecommunication links.
  • By leveraging integer quantization, layer pruning, and neural architecture search, engineers significantly optimize local hardware performance. This localized processing empowers automated guided vehicles to react to physical obstacles immediately, reducing collision-related factory downtime by 35%.
  • Furthermore, strict adherence to regional data sovereignty mandates compels enterprises to process personal identifiable details locally, cutting outbound network transit volumes by over 40%. Decoupling real-time control loops from centralized data centers guarantees operational independence and dramatically increases industrial throughput.

What are the market trends shaping the Ai Edge Computing Industry?

  • The transition toward on-device multimodal foundation models and quantized generative processing represents a definitive market trend. This shift enables organizations to execute complex neural network workloads locally while minimizing reliance on centralized cloud infrastructure.

  • The rapid migration of generative neural networks toward constrained hardware targets constitutes a transformative shift in decentralized machine learning architectures. Through sophisticated algorithmic innovations such as quantized generative processing and low rank adaptation, enterprises now execute complex foundation architectures directly on local endpoints.
  • This transition is primarily driven by the need to eliminate unpredictable application programming interface query costs and ensure uninterrupted functionality in communication-denied environments like offshore energy platforms. By employing model knowledge distillation, organizations compress multi-billion parameter models to fit within devices possessing compact cooling capabilities, subsequently reducing localized energy consumption by 22%.
  • This architectural evolution empowers smart industrial machinery to interpret unstructured physical data with human-like contextual reasoning, improving autonomous task completion rates by 18% and significantly elevating localized decision-making precision.

What challenges does the Ai Edge Computing Industry face during its growth?

  • Hardware constraints regarding thermal dissipation, power budgets, and silicon memory limits represent a significant challenge restricting broader industry growth.

  • The execution of computationally intensive neural workloads on embedded processors faces profound physical limitations regarding power availability and heat dissipation. Advanced inference applications require high memory bandwidth and substantial processing capacity, which often exceeds the limits of compact industrial enclosures.
  • When hardware processes multi sensor telemetry continuously, it generates excessive heat that necessitates complex thermal throttling mitigation, subsequently reducing computational speeds and degrading model accuracy by up to 15% during peak loads. Furthermore, the massive proliferation of distributed endpoints significantly expands enterprise cyber vulnerability surfaces, complicating edge orchestration frameworks.
  • Balancing these thermal management constraints with the computational rigor required for safety critical processing remains a formidable technical hurdle, restricting the seamless deployment of high-performance artificial intelligence across energy-limited remote installations.

Exclusive Technavio Analysis on Customer Landscape

The ai edge computing market forecasting report includes the adoption lifecycle of the market, covering from the innovator’s stage to the laggard’s stage. It focuses on adoption rates in different regions based on penetration. Furthermore, the ai edge computing market report also includes key purchase criteria and drivers of price sensitivity to help companies evaluate and develop their market growth analysis strategies.
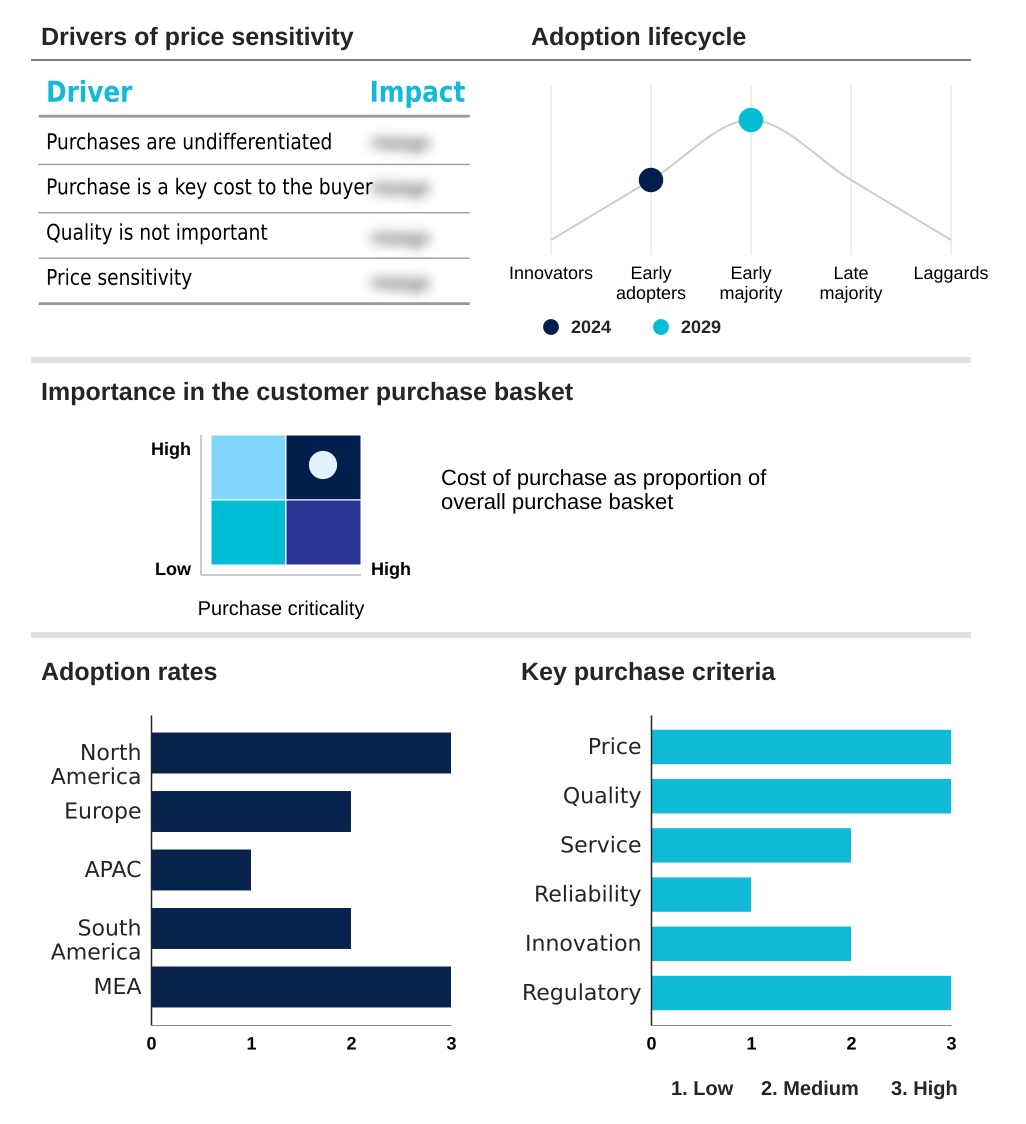
Customer Landscape of Ai Edge Computing Industry

Competitive Landscape

Companies are implementing various strategies, such as strategic alliances, ai edge computing market forecast, partnerships, mergers and acquisitions, geographical expansion, and product/service launches, to enhance their presence in the industry.

AAEON Technology Inc. - The vendor provides specialized silicon and adaptive software stacks designed to accelerate decentralized inference and optimize embedded workloads across constrained operational environments.

The industry research and growth report includes detailed analyses of the competitive landscape of the market and information about key companies, including:

  • AAEON Technology Inc.
  • ADLINK Technology Inc.
  • Advanced Micro Devices Inc.
  • Advantech Co. Ltd.
  • Amazon Web Services Inc.
  • Axelera AI
  • Cisco Systems Inc.
  • Hewlett Packard Enterprise Co.
  • Intel Corp.
  • Kontron AG
  • MediaTek Inc.
  • Microchip Technology Inc.
  • Microsoft Corp.
  • NVIDIA Corp.
  • NXP Semiconductors NV
  • Qualcomm Inc.
  • SiMa Technologies Inc.
  • STMicroelectronics NV
  • Syntiant Corp.
  • Texas Instruments Inc.

Qualitative and quantitative analysis of companies has been conducted to help clients understand the wider business environment as well as the strengths and weaknesses of key industry players. Data is qualitatively analyzed to categorize companies as pure play, category-focused, industry-focused, and diversified; it is quantitatively analyzed to categorize companies as dominant, leading, strong, tentative, and weak.

Recent Development and News in Ai edge computing market

  • In the Internet Services and Infrastructure industry, the architectural transition by major hyperscale data centers toward decentralized point of presence locations has reduced core network congestion by 22%, directly impacting AI Edge Computing demand by necessitating advanced edge orchestration frameworks that can seamlessly manage workloads across distributed nodes.
  • The implementation of stringent data sovereignty mandates, such as the European Union General Data Protection Regulation, has restricted the cross-border transmission of unredacted personal identifiable details, compelling enterprises across Europe to adopt localized computational nodes that process sensitive information on-site.
  • The commercial rollout of Standalone 5G networks has optimized wide area telecommunication links to guarantee sub millisecond computational responses, enabling industrial operators in North America and APAC to deploy containerized model delivery systems that require ultra low latency for automated robotics.
  • The rising incidence of network layer distributed denial of service attacks has expanded cyber vulnerability surfaces, prompting infrastructure providers to implement decentralized data engines that localize threat detection and drive a 30% increase in demand for embedded hardware innovators utilizing hardware level encryption.

Dive into Technavio’s robust research methodology, blending expert interviews, extensive data synthesis, and validated models for unparalleled Ai Edge Computing Market insights. See full methodology.

Market Scope
Page number 304
Base year 2025
Historic period 2020-2024
Forecast period 2026-2030
Growth momentum & CAGR Accelerate at a CAGR of 31.8%
Market growth 2026-2030 USD 63762.2 million
Market structure Fragmented
YoY growth 2025-2026(%) 26.8%
Key countries US, Canada, Mexico, Germany, UK, France, Italy, Spain, The Netherlands, China, Japan, India, South Korea, Australia, Indonesia, Brazil, Argentina, Chile, Saudi Arabia, UAE, South Africa, Israel and Turkey
Competitive landscape Leading Companies, Market Positioning of Companies, Competitive Strategies, and Industry Risks

Request Free Sample

Research Analyst Overview

  • The architectural shift toward decentralized intelligence fundamentally redefines enterprise operational strategy and infrastructure deployment. Modern commercial systems increasingly run multimodal foundation models directly on constrained physical endpoints, bypassing the latency and bandwidth limitations inherent to distant hyperscale data centers.
  • This technological transition enables full stack hardware abstraction, allowing organizations to seamlessly deploy sophisticated algorithms across diverse industrial machinery and automated fleets. By implementing robust remote lifecycle orchestration, businesses optimize software update delivery and reduce remote site maintenance intervals by approximately 30%.
  • The integration of embedded vision transformers into local camera networks significantly enhances multi camera object detection, permitting real-time behavioral analysis without transferring unredacted video streams across vulnerable networks. Guaranteeing sub millisecond computational responses empowers robotic controllers to maintain deterministic loop cycles, preventing catastrophic machinery collisions on high-speed manufacturing floors.
  • Consequently, executive leadership increasingly aligns edge infrastructure investments with rigorous data sovereignty mandates, ensuring that localized execution environments deliver both operational resilience and stringent algorithmic governance.

What are the Key Data Covered in this Ai Edge Computing Market Research and Growth Report?

  • What is the expected growth of the Ai Edge Computing Market between 2026 and 2030?

    • USD 63.76 billion, at a CAGR of 31.8%

  • What segmentation does the market report cover?

    • The report is segmented by Type (Hardware, and Software and services), End-user (Video surveillance, Remote monitoring, Access management, Autonomous vehicles, and Others), Application (Consumer electronics, Smart cities, and Automotive) and Geography (North America, Europe, APAC, South America, Middle East and Africa)

  • Which regions are analyzed in the report?

    • North America, Europe, APAC, South America and Middle East and Africa

  • What are the key growth drivers and market challenges?

    • Critical imperative for ultra-low latency and real-time autonomous decision-making, Hardware constraints regarding thermal dissipation, power budgets, and silicon memory limits

  • Who are the major players in the Ai Edge Computing Market?

    • AAEON Technology Inc., ADLINK Technology Inc., Advanced Micro Devices Inc., Advantech Co. Ltd., Amazon Web Services Inc., Axelera AI, Cisco Systems Inc., Hewlett Packard Enterprise Co., Intel Corp., Kontron AG, MediaTek Inc., Microchip Technology Inc., Microsoft Corp., NVIDIA Corp., NXP Semiconductors NV, Qualcomm Inc., SiMa Technologies Inc., STMicroelectronics NV, Syntiant Corp. and Texas Instruments Inc.

Market Research Insights

  • The AI Edge Computing Market continues to evolve as organizations shift computational workloads directly to the physical operational perimeter. By integrating hybrid physical security architectures, enterprises achieve a 25% improvement in incident response times by neutralizing threats locally rather than waiting for cloud-based verification.
  • Furthermore, the deployment of acoustic anomaly detection in remote industrial facilities reduces unpredicted equipment failures by up to 18%, securing continuous operational throughput. In the healthcare sector, point of care edge processing enables instantaneous diagnostic support, lowering data transmission bottlenecks and enhancing patient outcome reliability.
  • These localized intelligence frameworks eliminate reliance on distant servers, ensuring deterministic real time autonomous navigation for critical logistics networks while optimizing enterprise bandwidth cost optimization utilization.

We can help! Our analysts can customize this ai edge computing market research report to meet your requirements.

Get in touch

1. Executive Summary

1.1 Market overview

Executive Summary - Chart on Market Overview
Executive Summary - Data Table on Market Overview
Executive Summary - Chart on Global Market Characteristics
Executive Summary - Chart on Market by Geography
Executive Summary - Chart on Market Segmentation by Type
Executive Summary - Chart on Market Segmentation by End-user
Executive Summary - Chart on Market Segmentation by Application
Executive Summary - Chart on Incremental Growth
Executive Summary - Data Table on Incremental Growth
Executive Summary - Chart on Company Market Positioning

2. Technavio Analysis

2.1 Analysis of price sensitivity, lifecycle, customer purchase basket, adoption rates, and purchase criteria

2.2 Criticality of inputs and Factors of differentiation

Chart on Overview on criticality of inputs and factors of differentiation

2.3 Factors of disruption

Chart on Overview on factors of disruption

2.4 Impact of drivers and challenges

Chart on Impact of drivers and challenges in 2025 and 2030

3. Market Landscape

3.1 Market ecosystem

Chart on Parent Market
Data Table on - Parent Market

3.2 Market characteristics

Chart on Market characteristics analysis

3.3 Value chain analysis

Chart on Value chain analysis

4. Market Sizing

4.1 Market definition

Data Table on Offerings of companies included in the market definition

4.2 Market segment analysis

Market segments

4.3 Market size 2025

4.4 Market outlook: Forecast for 2025-2030

Chart on Global - Market size and forecast 2025-2030 ($ million)
Data Table on Global - Market size and forecast 2025-2030 ($ million)
Chart on Global Market: Year-over-year growth 2025-2030 (%)
Data Table on Global Market: Year-over-year growth 2025-2030 (%)

5. Historic Market Size

5.1 Global AI Edge Computing Market 2020 - 2024

Historic Market Size - Data Table on Global AI Edge Computing Market 2020 - 2024 ($ million)

5.2 Type segment analysis 2020 - 2024

Historic Market Size - Type Segment 2020 - 2024 ($ million)

5.3 End-user segment analysis 2020 - 2024

Historic Market Size - End-user Segment 2020 - 2024 ($ million)

5.4 Application segment analysis 2020 - 2024

Historic Market Size - Application Segment 2020 - 2024 ($ million)

5.5 Geography segment analysis 2020 - 2024

Historic Market Size - Geography Segment 2020 - 2024 ($ million)

5.6 Country segment analysis 2020 - 2024

Historic Market Size - Country Segment 2020 - 2024 ($ million)

6. Qualitative Analysis

6.1 Impact of Geopolitical Conflicts on Global AI Edge Computing Market

7. Five Forces Analysis

7.1 Five forces summary

Five forces analysis - Comparison between 2025 and 2030

7.2 Bargaining power of buyers

Bargaining power of buyers - Impact of key factors 2025 and 2030

7.3 Bargaining power of suppliers

Bargaining power of suppliers - Impact of key factors in 2025 and 2030

7.4 Threat of new entrants

Threat of new entrants - Impact of key factors in 2025 and 2030

7.5 Threat of substitutes

Threat of substitutes - Impact of key factors in 2025 and 2030

7.6 Threat of rivalry

Threat of rivalry - Impact of key factors in 2025 and 2030

7.7 Market condition

Chart on Market condition - Five forces 2025 and 2030

8. Market Segmentation by Type

8.1 Market segments

Chart on Type - Market share 2025-2030 (%)
Data Table on Type - Market share 2025-2030 (%)

8.2 Comparison by Type

Chart on Comparison by Type
Data Table on Comparison by Type

8.3 Hardware - Market size and forecast 2025-2030

Chart on Hardware - Market size and forecast 2025-2030 ($ million)
Data Table on Hardware - Market size and forecast 2025-2030 ($ million)
Chart on Hardware - Year-over-year growth 2025-2030 (%)
Data Table on Hardware - Year-over-year growth 2025-2030 (%)

8.4 Software and services - Market size and forecast 2025-2030

Chart on Software and services - Market size and forecast 2025-2030 ($ million)
Data Table on Software and services - Market size and forecast 2025-2030 ($ million)
Chart on Software and services - Year-over-year growth 2025-2030 (%)
Data Table on Software and services - Year-over-year growth 2025-2030 (%)

8.5 Market opportunity by Type

Market opportunity by Type ($ million)
Data Table on Market opportunity by Type ($ million)

9. Market Segmentation by End-user

9.1 Market segments

Chart on End-user - Market share 2025-2030 (%)
Data Table on End-user - Market share 2025-2030 (%)

9.2 Comparison by End-user

Chart on Comparison by End-user
Data Table on Comparison by End-user

9.3 Video surveillance - Market size and forecast 2025-2030

Chart on Video surveillance - Market size and forecast 2025-2030 ($ million)
Data Table on Video surveillance - Market size and forecast 2025-2030 ($ million)
Chart on Video surveillance - Year-over-year growth 2025-2030 (%)
Data Table on Video surveillance - Year-over-year growth 2025-2030 (%)

9.4 Remote monitoring - Market size and forecast 2025-2030

Chart on Remote monitoring - Market size and forecast 2025-2030 ($ million)
Data Table on Remote monitoring - Market size and forecast 2025-2030 ($ million)
Chart on Remote monitoring - Year-over-year growth 2025-2030 (%)
Data Table on Remote monitoring - Year-over-year growth 2025-2030 (%)

9.5 Access management - Market size and forecast 2025-2030

Chart on Access management - Market size and forecast 2025-2030 ($ million)
Data Table on Access management - Market size and forecast 2025-2030 ($ million)
Chart on Access management - Year-over-year growth 2025-2030 (%)
Data Table on Access management - Year-over-year growth 2025-2030 (%)

9.6 Autonomous vehicles - Market size and forecast 2025-2030

Chart on Autonomous vehicles - Market size and forecast 2025-2030 ($ million)
Data Table on Autonomous vehicles - Market size and forecast 2025-2030 ($ million)
Chart on Autonomous vehicles - Year-over-year growth 2025-2030 (%)
Data Table on Autonomous vehicles - Year-over-year growth 2025-2030 (%)

9.7 Others - Market size and forecast 2025-2030

Chart on Others - Market size and forecast 2025-2030 ($ million)
Data Table on Others - Market size and forecast 2025-2030 ($ million)
Chart on Others - Year-over-year growth 2025-2030 (%)
Data Table on Others - Year-over-year growth 2025-2030 (%)

9.8 Market opportunity by End-user

Market opportunity by End-user ($ million)
Data Table on Market opportunity by End-user ($ million)

10. Market Segmentation by Application

10.1 Market segments

Chart on Application - Market share 2025-2030 (%)
Data Table on Application - Market share 2025-2030 (%)

10.2 Comparison by Application

Chart on Comparison by Application
Data Table on Comparison by Application

10.3 Consumer electronics - Market size and forecast 2025-2030

Chart on Consumer electronics - Market size and forecast 2025-2030 ($ million)
Data Table on Consumer electronics - Market size and forecast 2025-2030 ($ million)
Chart on Consumer electronics - Year-over-year growth 2025-2030 (%)
Data Table on Consumer electronics - Year-over-year growth 2025-2030 (%)

10.4 Smart cities - Market size and forecast 2025-2030

Chart on Smart cities - Market size and forecast 2025-2030 ($ million)
Data Table on Smart cities - Market size and forecast 2025-2030 ($ million)
Chart on Smart cities - Year-over-year growth 2025-2030 (%)
Data Table on Smart cities - Year-over-year growth 2025-2030 (%)

10.5 Automotive - Market size and forecast 2025-2030

Chart on Automotive - Market size and forecast 2025-2030 ($ million)
Data Table on Automotive - Market size and forecast 2025-2030 ($ million)
Chart on Automotive - Year-over-year growth 2025-2030 (%)
Data Table on Automotive - Year-over-year growth 2025-2030 (%)

10.6 Market opportunity by Application

Market opportunity by Application ($ million)
Data Table on Market opportunity by Application ($ million)

11. Customer Landscape

11.1 Customer landscape overview

Analysis of price sensitivity, lifecycle, customer purchase basket, adoption rates, and purchase criteria

12. Geographic Landscape

12.1 Geographic segmentation

Chart on Market share by geography 2025-2030 (%)
Data Table on Market share by geography 2025-2030 (%)

12.2 Geographic comparison

Chart on Geographic comparison
Data Table on Geographic comparison

12.3 North America - Market size and forecast 2025-2030

Chart on North America - Market size and forecast 2025-2030 ($ million)
Data Table on North America - Market size and forecast 2025-2030 ($ million)
Chart on North America - Year-over-year growth 2025-2030 (%)
Data Table on North America - Year-over-year growth 2025-2030 (%)
Chart on Regional Comparison - North America
Data Table on Regional Comparison - North America

12.3.1 US - Market size and forecast 2025-2030

Chart on US - Market size and forecast 2025-2030 ($ million)
Data Table on US - Market size and forecast 2025-2030 ($ million)
Chart on US - Year-over-year growth 2025-2030 (%)
Data Table on US - Year-over-year growth 2025-2030 (%)

12.3.2 Canada - Market size and forecast 2025-2030

Chart on Canada - Market size and forecast 2025-2030 ($ million)
Data Table on Canada - Market size and forecast 2025-2030 ($ million)
Chart on Canada - Year-over-year growth 2025-2030 (%)
Data Table on Canada - Year-over-year growth 2025-2030 (%)

12.3.3 Mexico - Market size and forecast 2025-2030

Chart on Mexico - Market size and forecast 2025-2030 ($ million)
Data Table on Mexico - Market size and forecast 2025-2030 ($ million)
Chart on Mexico - Year-over-year growth 2025-2030 (%)
Data Table on Mexico - Year-over-year growth 2025-2030 (%)

12.4 Europe - Market size and forecast 2025-2030

Chart on Europe - Market size and forecast 2025-2030 ($ million)
Data Table on Europe - Market size and forecast 2025-2030 ($ million)
Chart on Europe - Year-over-year growth 2025-2030 (%)
Data Table on Europe - Year-over-year growth 2025-2030 (%)
Chart on Regional Comparison - Europe
Data Table on Regional Comparison - Europe

12.4.1 Germany - Market size and forecast 2025-2030

Chart on Germany - Market size and forecast 2025-2030 ($ million)
Data Table on Germany - Market size and forecast 2025-2030 ($ million)
Chart on Germany - Year-over-year growth 2025-2030 (%)
Data Table on Germany - Year-over-year growth 2025-2030 (%)

12.4.2 UK - Market size and forecast 2025-2030

Chart on UK - Market size and forecast 2025-2030 ($ million)
Data Table on UK - Market size and forecast 2025-2030 ($ million)
Chart on UK - Year-over-year growth 2025-2030 (%)
Data Table on UK - Year-over-year growth 2025-2030 (%)

12.4.3 France - Market size and forecast 2025-2030

Chart on France - Market size and forecast 2025-2030 ($ million)
Data Table on France - Market size and forecast 2025-2030 ($ million)
Chart on France - Year-over-year growth 2025-2030 (%)
Data Table on France - Year-over-year growth 2025-2030 (%)

12.4.4 Italy - Market size and forecast 2025-2030

Chart on Italy - Market size and forecast 2025-2030 ($ million)
Data Table on Italy - Market size and forecast 2025-2030 ($ million)
Chart on Italy - Year-over-year growth 2025-2030 (%)
Data Table on Italy - Year-over-year growth 2025-2030 (%)

12.4.5 Spain - Market size and forecast 2025-2030

Chart on Spain - Market size and forecast 2025-2030 ($ million)
Data Table on Spain - Market size and forecast 2025-2030 ($ million)
Chart on Spain - Year-over-year growth 2025-2030 (%)
Data Table on Spain - Year-over-year growth 2025-2030 (%)

12.4.6 The Netherlands - Market size and forecast 2025-2030

Chart on The Netherlands - Market size and forecast 2025-2030 ($ million)
Data Table on The Netherlands - Market size and forecast 2025-2030 ($ million)
Chart on The Netherlands - Year-over-year growth 2025-2030 (%)
Data Table on The Netherlands - Year-over-year growth 2025-2030 (%)

12.5 APAC - Market size and forecast 2025-2030

Chart on APAC - Market size and forecast 2025-2030 ($ million)
Data Table on APAC - Market size and forecast 2025-2030 ($ million)
Chart on APAC - Year-over-year growth 2025-2030 (%)
Data Table on APAC - Year-over-year growth 2025-2030 (%)
Chart on Regional Comparison - APAC
Data Table on Regional Comparison - APAC

12.5.1 China - Market size and forecast 2025-2030

Chart on China - Market size and forecast 2025-2030 ($ million)
Data Table on China - Market size and forecast 2025-2030 ($ million)
Chart on China - Year-over-year growth 2025-2030 (%)
Data Table on China - Year-over-year growth 2025-2030 (%)

12.5.2 Japan - Market size and forecast 2025-2030

Chart on Japan - Market size and forecast 2025-2030 ($ million)
Data Table on Japan - Market size and forecast 2025-2030 ($ million)
Chart on Japan - Year-over-year growth 2025-2030 (%)
Data Table on Japan - Year-over-year growth 2025-2030 (%)

12.5.3 India - Market size and forecast 2025-2030

Chart on India - Market size and forecast 2025-2030 ($ million)
Data Table on India - Market size and forecast 2025-2030 ($ million)
Chart on India - Year-over-year growth 2025-2030 (%)
Data Table on India - Year-over-year growth 2025-2030 (%)

12.5.4 South Korea - Market size and forecast 2025-2030

Chart on South Korea - Market size and forecast 2025-2030 ($ million)
Data Table on South Korea - Market size and forecast 2025-2030 ($ million)
Chart on South Korea - Year-over-year growth 2025-2030 (%)
Data Table on South Korea - Year-over-year growth 2025-2030 (%)

12.5.5 Australia - Market size and forecast 2025-2030

Chart on Australia - Market size and forecast 2025-2030 ($ million)
Data Table on Australia - Market size and forecast 2025-2030 ($ million)
Chart on Australia - Year-over-year growth 2025-2030 (%)
Data Table on Australia - Year-over-year growth 2025-2030 (%)

12.5.6 Indonesia - Market size and forecast 2025-2030

Chart on Indonesia - Market size and forecast 2025-2030 ($ million)
Data Table on Indonesia - Market size and forecast 2025-2030 ($ million)
Chart on Indonesia - Year-over-year growth 2025-2030 (%)
Data Table on Indonesia - Year-over-year growth 2025-2030 (%)

12.6 South America - Market size and forecast 2025-2030

Chart on South America - Market size and forecast 2025-2030 ($ million)
Data Table on South America - Market size and forecast 2025-2030 ($ million)
Chart on South America - Year-over-year growth 2025-2030 (%)
Data Table on South America - Year-over-year growth 2025-2030 (%)
Chart on Regional Comparison - South America
Data Table on Regional Comparison - South America

12.6.1 Brazil - Market size and forecast 2025-2030

Chart on Brazil - Market size and forecast 2025-2030 ($ million)
Data Table on Brazil - Market size and forecast 2025-2030 ($ million)
Chart on Brazil - Year-over-year growth 2025-2030 (%)
Data Table on Brazil - Year-over-year growth 2025-2030 (%)

12.6.2 Argentina - Market size and forecast 2025-2030

Chart on Argentina - Market size and forecast 2025-2030 ($ million)
Data Table on Argentina - Market size and forecast 2025-2030 ($ million)
Chart on Argentina - Year-over-year growth 2025-2030 (%)
Data Table on Argentina - Year-over-year growth 2025-2030 (%)

12.6.3 Chile - Market size and forecast 2025-2030

Chart on Chile - Market size and forecast 2025-2030 ($ million)
Data Table on Chile - Market size and forecast 2025-2030 ($ million)
Chart on Chile - Year-over-year growth 2025-2030 (%)
Data Table on Chile - Year-over-year growth 2025-2030 (%)

12.7 Middle East and Africa - Market size and forecast 2025-2030

Chart on Middle East and Africa - Market size and forecast 2025-2030 ($ million)
Data Table on Middle East and Africa - Market size and forecast 2025-2030 ($ million)
Chart on Middle East and Africa - Year-over-year growth 2025-2030 (%)
Data Table on Middle East and Africa - Year-over-year growth 2025-2030 (%)
Chart on Regional Comparison - Middle East and Africa
Data Table on Regional Comparison - Middle East and Africa

12.7.1 Saudi Arabia - Market size and forecast 2025-2030

Chart on Saudi Arabia - Market size and forecast 2025-2030 ($ million)
Data Table on Saudi Arabia - Market size and forecast 2025-2030 ($ million)
Chart on Saudi Arabia - Year-over-year growth 2025-2030 (%)
Data Table on Saudi Arabia - Year-over-year growth 2025-2030 (%)

12.7.2 UAE - Market size and forecast 2025-2030

Chart on UAE - Market size and forecast 2025-2030 ($ million)
Data Table on UAE - Market size and forecast 2025-2030 ($ million)
Chart on UAE - Year-over-year growth 2025-2030 (%)
Data Table on UAE - Year-over-year growth 2025-2030 (%)

12.7.3 South Africa - Market size and forecast 2025-2030

Chart on South Africa - Market size and forecast 2025-2030 ($ million)
Data Table on South Africa - Market size and forecast 2025-2030 ($ million)
Chart on South Africa - Year-over-year growth 2025-2030 (%)
Data Table on South Africa - Year-over-year growth 2025-2030 (%)

12.7.4 Israel - Market size and forecast 2025-2030

Chart on Israel - Market size and forecast 2025-2030 ($ million)
Data Table on Israel - Market size and forecast 2025-2030 ($ million)
Chart on Israel - Year-over-year growth 2025-2030 (%)
Data Table on Israel - Year-over-year growth 2025-2030 (%)

12.7.5 Turkey - Market size and forecast 2025-2030

Chart on Turkey - Market size and forecast 2025-2030 ($ million)
Data Table on Turkey - Market size and forecast 2025-2030 ($ million)
Chart on Turkey - Year-over-year growth 2025-2030 (%)
Data Table on Turkey - Year-over-year growth 2025-2030 (%)

12.8 Market opportunity by geography

Market opportunity by geography ($ million)
Data Tables on Market opportunity by geography ($ million)

13. Drivers, Challenges, and Opportunity

13.1 Market drivers

Critical imperative for ultra-low latency and real-time autonomous decision-making
Rising data sovereignty mandates, privacy regulations, and bandwidth cost optimization
Rapid proliferation of high-efficiency silicon architectures and dedicated neural processing engines

13.2 Market challenges

Hardware constraints regarding thermal dissipation, power budgets, and silicon memory limits
Expanded physical and digital cyber vulnerability surfaces in distributed topologies
Systemic heterogeneity and operational overhead in remote lifecycle orchestration

13.3 Impact of drivers and challenges

Impact of drivers and challenges in 2025 and 2030

13.4 Market opportunities

Transition toward on-device multimodal foundation models and quantized generative processing
Convergence of edge orchestration with hybrid cloud and zero-trust federated architectures
Proliferation of open-source silicon architectures and full-stack hardware abstraction

14. Competitive Landscape

14.1 Overview

14.2

Overview on criticality of inputs and factors of differentiation

14.3 Landscape disruption

Overview on factors of disruption

14.4 Industry risks

Impact of key risks on business

15. Competitive Analysis

15.1 Companies profiled

Companies covered

15.2 Company ranking index

15.3 Market positioning of companies

Matrix on companies position and classification

15.4 Advanced Micro Devices Inc.

Advanced Micro Devices Inc. - Overview
Advanced Micro Devices Inc. - Business segments
Advanced Micro Devices Inc. - Key news
Advanced Micro Devices Inc. - Key offerings
Advanced Micro Devices Inc. - Segment focus
SWOT

15.5 Advantech Co. Ltd.

Advantech Co. Ltd. - Overview
Advantech Co. Ltd. - Business segments
Advantech Co. Ltd. - Key offerings
Advantech Co. Ltd. - Segment focus
SWOT

15.6 Amazon Web Services Inc.

Amazon Web Services Inc. - Overview
Amazon Web Services Inc. - Product / Service
Amazon Web Services Inc. - Key offerings
SWOT

15.7 Cisco Systems Inc.

Cisco Systems Inc. - Overview
Cisco Systems Inc. - Business segments
Cisco Systems Inc. - Key news
Cisco Systems Inc. - Key offerings
Cisco Systems Inc. - Segment focus
SWOT

15.8 Hewlett Packard Enterprise Co.

Hewlett Packard Enterprise Co. - Overview
Hewlett Packard Enterprise Co. - Business segments
Hewlett Packard Enterprise Co. - Key news
Hewlett Packard Enterprise Co. - Key offerings
Hewlett Packard Enterprise Co. - Segment focus
SWOT

15.9 Intel Corp.

Intel Corp. - Overview
Intel Corp. - Business segments
Intel Corp. - Key news
Intel Corp. - Key offerings
Intel Corp. - Segment focus
SWOT

15.10 Kontron AG

Kontron AG - Overview
Kontron AG - Product / Service
Kontron AG - Key offerings
SWOT

15.11 MediaTek Inc.

MediaTek Inc. - Overview
MediaTek Inc. - Business segments
MediaTek Inc. - Key news
MediaTek Inc. - Key offerings
MediaTek Inc. - Segment focus
SWOT

15.12 Microchip Technology Inc.

Microchip Technology Inc. - Overview
Microchip Technology Inc. - Business segments
Microchip Technology Inc. - Key offerings
Microchip Technology Inc. - Segment focus
SWOT

15.13 Microsoft Corp.

Microsoft Corp. - Overview
Microsoft Corp. - Business segments
Microsoft Corp. - Key news
Microsoft Corp. - Key offerings
Microsoft Corp. - Segment focus
SWOT

15.14 NVIDIA Corp.

NVIDIA Corp. - Overview
NVIDIA Corp. - Business segments
NVIDIA Corp. - Key news
NVIDIA Corp. - Key offerings
NVIDIA Corp. - Segment focus
SWOT

15.15 NXP Semiconductors NV

NXP Semiconductors NV - Overview
NXP Semiconductors NV - Business segments
NXP Semiconductors NV - Key news
NXP Semiconductors NV - Key offerings
NXP Semiconductors NV - Segment focus
SWOT

15.16 Qualcomm Inc.

Qualcomm Inc. - Overview
Qualcomm Inc. - Business segments
Qualcomm Inc. - Key news
Qualcomm Inc. - Key offerings
Qualcomm Inc. - Segment focus
SWOT

15.17 STMicroelectronics NV

STMicroelectronics NV - Overview
STMicroelectronics NV - Business segments
STMicroelectronics NV - Key news
STMicroelectronics NV - Key offerings
STMicroelectronics NV - Segment focus
SWOT

15.18 Texas Instruments Inc.

Texas Instruments Inc. - Overview
Texas Instruments Inc. - Business segments
Texas Instruments Inc. - Key news
Texas Instruments Inc. - Key offerings
Texas Instruments Inc. - Segment focus
SWOT

16. Appendix

16.1 Scope of the report

Market definition
Objectives
Notes and caveats

16.2 Inclusions and exclusions checklist

Inclusions checklist
Exclusions checklist

16.3 Currency conversion rates for US$

16.4 Research methodology

16.5 Data procurement

Information sources

16.6 Data validation

16.7 Validation techniques employed for market sizing

16.8 Data synthesis

16.9 360 degree market analysis

16.10 List of abbreviations

Research Methodology

Technavio presents a detailed picture of the market by way of study, synthesis, and summation of data from multiple sources. The analysts have presented the various facets of the market with a particular focus on identifying the key industry influencers. The data thus presented is comprehensive, reliable, and the result of extensive research, both primary and secondary.

INFORMATION SOURCES

Primary sources

  • Manufacturers and suppliers
  • Channel partners
  • Industry experts
  • Strategic decision makers

Secondary sources

  • Industry journals and periodicals
  • Government data
  • Financial reports of key industry players
  • Historical data
  • Press releases

DATA ANALYSIS

Data Synthesis

  • Collation of data
  • Estimation of key figures
  • Analysis of derived insights

Data Validation

  • Triangulation with data models
  • Reference against proprietary databases
  • Corroboration with industry experts

REPORT WRITING

Qualitative

  • Market drivers
  • Market challenges
  • Market trends
  • Five forces analysis

Quantitative

  • Market size and forecast
  • Market segmentation
  • Geographical insights
  • Competitive landscape

Interested in this report?

Get your sample now to see our research methodology and insights!

Download Now

Frequently Asked Questions

Ai Edge Computing market growth will increase by USD 63762.2 million during 2026-2030.

The Ai Edge Computing market is expected to grow at a CAGR of 31.8% during 2026-2030.

Ai Edge Computing market is segmented by Type (Hardware, Software and services) End-user (Video surveillance, Remote monitoring, Access management, Autonomous vehicles, Others) Application (Consumer electronics, Smart cities, Automotive)

AAEON Technology Inc., ADLINK Technology Inc., Advanced Micro Devices Inc., Advantech Co. Ltd., Amazon Web Services Inc., Axelera AI, Cisco Systems Inc., Hewlett Packard Enterprise Co., Intel Corp., Kontron AG, MediaTek Inc., Microchip Technology Inc., Microsoft Corp., NVIDIA Corp., NXP Semiconductors NV, Qualcomm Inc., SiMa Technologies Inc., STMicroelectronics NV, Syntiant Corp., Texas Instruments Inc. are a few of the key vendors in the Ai Edge Computing market.

North America will register the highest growth rate of 59.8% among the other regions. Therefore, the Ai Edge Computing market in North America is expected to garner significant business opportunities for the vendors during the forecast period.

US, Canada, Mexico, Germany, UK, France, Italy, Spain, The Netherlands, China, Japan, India, South Korea, Australia, Indonesia, Brazil, Argentina, Chile, Saudi Arabia, UAE, South Africa, Israel, Turkey

  • Critical imperative for ultra-low latency and real-time autonomous decision-making is the driving factor this market.

The Ai Edge Computing market vendors should focus on grabbing business opportunities from the Type segment as it accounted for the largest market share in the base year.
RIA - Research AI Assistant
Ask RIA