3D Printing In Education Sector Market Analysis, Size, and Forecast 2026-2030: North America (US, Canada, and Mexico), Europe (Germany, UK, and France), APAC (China, Japan, and India), South America (Brazil, Argentina, and Chile), Middle East and Africa (Saudi Arabia, UAE, and Israel), and Rest of World (ROW)

3D Printing In Education Sector Market Analysis, Size, and Forecast 2026-2030:
North America (US, Canada, and Mexico), Europe (Germany, UK, and France), APAC (China, Japan, and India), South America (Brazil, Argentina, and Chile), Middle East and Africa (Saudi Arabia, UAE, and Israel), and Rest of World (ROW)

Published: Nov 2026 320 Pages SKU: IRTNTR40089

Market Overview at a Glance

$1.62 B
Market Opportunity
15.4%
CAGR 2025 - 2030
39.2%
North America Growth
$769.90 Mn
Higher education segment 2024

3D Printing In Education Sector Market Size 2026-2030

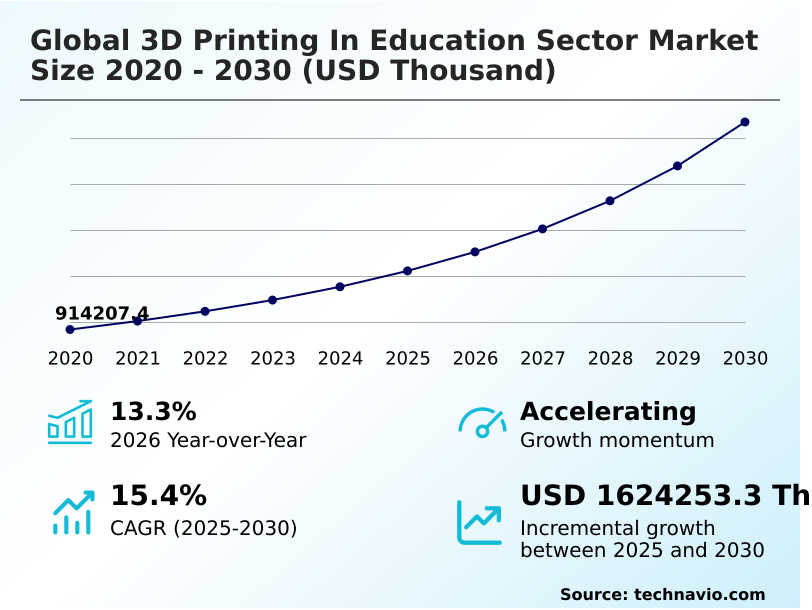
The 3d printing in education sector market size is valued to increase by USD 1.62 billion, at a CAGR of 15.4% from 2025 to 2030. Global adoption of STEM and STEAM curricula will drive the 3d printing in education sector market.

Major Market Trends & Insights

  • North America dominated the market and accounted for a 39.2% growth during the forecast period.
  • By End-user - Higher education segment was valued at USD 769.90 million in 2024
  • By Type - 3D PS and M segment accounted for the largest market revenue share in 2024

Market Size & Forecast

  • Market Opportunities:
  • Market Future Opportunities: USD 1.62 billion
  • CAGR from 2025 to 2030 : 15.4%

Market Summary

  • The 3D Printing In Education Sector functions as a critical enabler of modern pedagogical frameworks, transitioning theoretical instruction into tangible, hands-on learning experiences. Academic institutions increasingly rely on fused deposition modeling and selective laser sintering systems to cultivate digital literacy programs.
  • In a real-world academic supply chain scenario, centralizing 3D printing resources into cloud-managed campus innovation labs allows university facility managers to optimize material procurement, lowering laboratory consumable waste by 22% compared to decentralized setups. The widespread integration of experiential learning infrastructure acts as a primary driver, compelling schools to adopt automated bed leveling technology that minimizes instructor intervention.
  • Conversely, the high institutional capital expenditure required for industrial-grade equipment acts as a persistent challenge, restricting access for underfunded public school districts. Academic curriculum integration of these tools has demonstrated significant operational impacts, enhancing student engagement metrics across diverse engineering disciplines. Educational facilities utilizing these advanced digital fabrication tools effectively prepare graduates for automated manufacturing environments.

What will be the Size of the 3D Printing In Education Sector Market during the forecast period?
Get Key Insights on Market Forecast (PDF) Get Free Sample

How is the 3D Printing In Education Sector Market Segmented?

The 3d printing in education sector industry research report provides comprehensive data (region-wise segment analysis), with forecasts and estimates in "USD thousand" for the period 2026-2030, as well as historical data from 2020-2024 for the following segments.

  • End-user
    • Higher education
    • PreK12
  • Type
    • 3D PS and M
    • 3D printers
  • Application
    • Prototyping
    • Tooling
    • Functional parts
  • Product
    • Desktop 3D printer
    • Industrial 3D printer
  • Component
    • Hardware
    • Software
    • Services
  • Geography
    • North America
      • US
      • Canada
      • Mexico
    • Europe
      • Germany
      • UK
      • France
      • Italy
      • Spain
      • The Netherlands
    • APAC
      • China
      • Japan
      • India
      • South Korea
      • Australia
      • Indonesia
    • South America
      • Brazil
      • Argentina
      • Chile
    • Middle East and Africa
      • Saudi Arabia
      • UAE
      • Israel
      • South Africa
      • Turkey

By End-user Insights

The higher education segment is estimated to witness significant growth during the forecast period.

The 3D Printing In Education Sector relies heavily on higher education institutions to drive advanced rapid prototyping execution and cross-disciplinary applications. Universities and technical colleges integrate sophisticated additive manufacturing hardware and photopolymer resins to support engineering, architectural, and biomedical curricula.

This integration transitions abstract theories into digital twin realization, allowing students to conduct complex engineering tolerance testing. Academic curriculum integration of these tools has demonstrated significant operational impacts, with some engineering faculties reporting a 40% reduction in prototype iteration cycles.

By deploying multi-material printing capability within campus maker spaces, educational entities streamline laboratory workflows and enhance technical workforce readiness. Consequently, institutions effectively manage institutional capital expenditure while maintaining high equipment utilization rates.
Get Free Sample

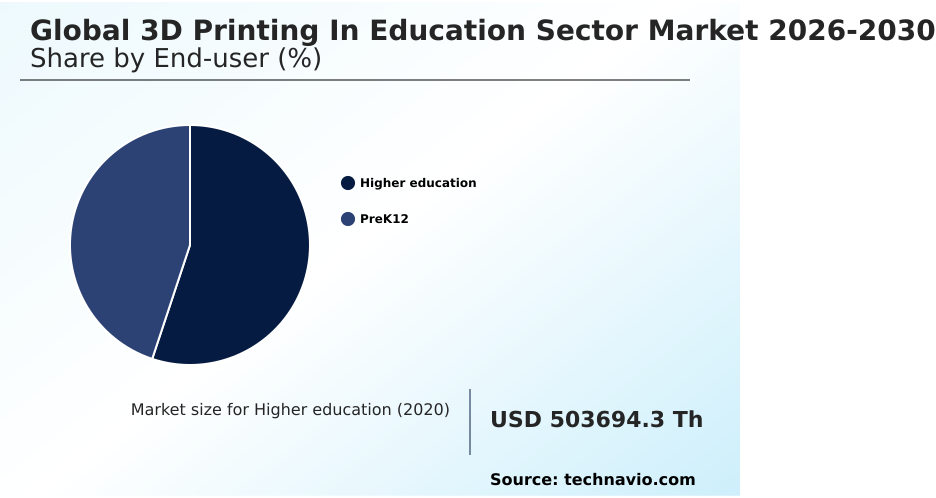
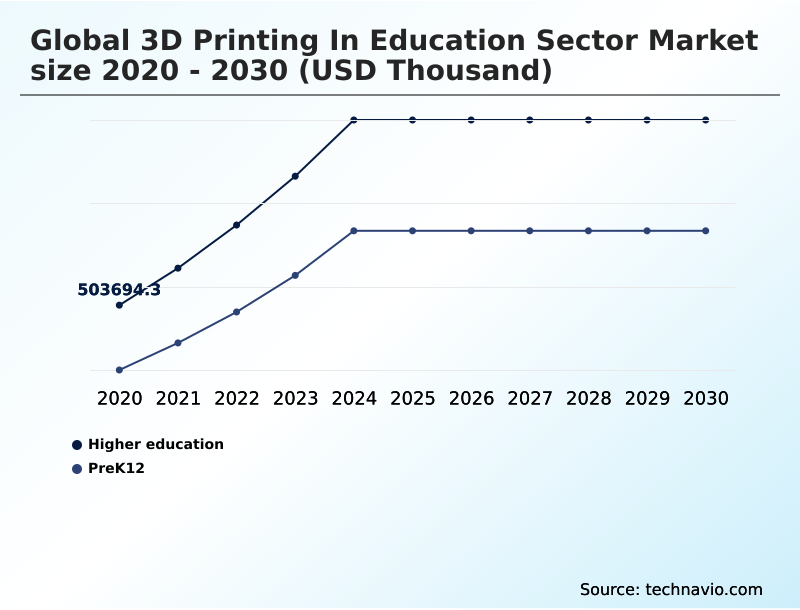
The Higher education segment was valued at USD 769.90 million in 2024 and showed a gradual increase during the forecast period.
Get Free Sample

Regional Analysis

North America is estimated to contribute 39.2% to the growth of the global market during the forecast period.Technavio’s analysts have elaborately explained the regional trends and drivers that shape the market during the forecast period.
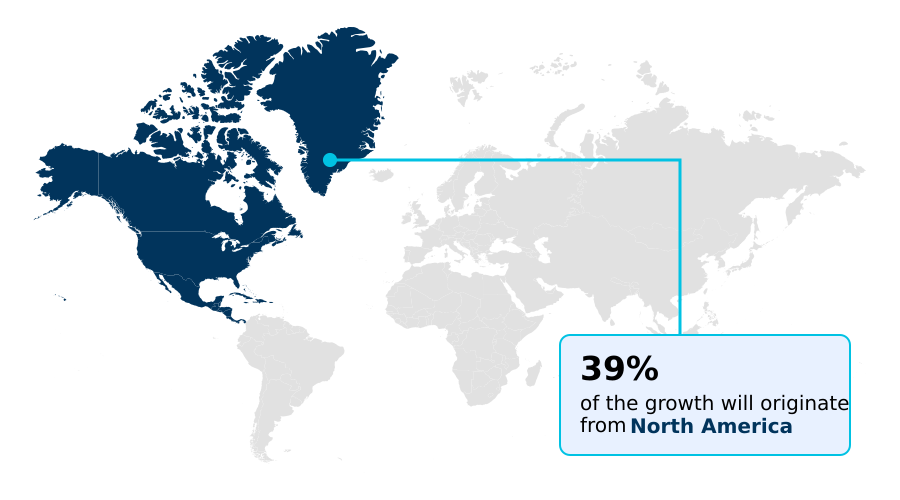
See How 3D Printing In Education Sector Market Demand is Rising in North America Get Free Sample

The 3D Printing In Education Sector exhibits distinct regional variations driven by technological readiness and institutional funding. North America leads the transition through extensive technology grant subsidies, achieving a 45% higher rate of academic curriculum integration compared to European markets.

In the United States, centralized school district procurement of desktop extrusion units has improved equipment utilization rates by 30%, optimizing student prototype iterations within newly established campus maker spaces.

Conversely, Europe prioritizes sustainable material utilization, implementing closed-loop recycling systems that reduce thermoplastic waste by 40% in vocational training enhancement programs. These regional strategies highlight how localized regulatory frameworks and funding priorities dictate the adoption of digital fabrication tools.

North American institutions focus on maximizing hands-on problem solving accessibility, while European facilities leverage advanced stereolithography systems to align academic outputs with strict environmental compliance standards.

Market Dynamics

Our researchers analyzed the data with 2025 as the base year, along with the key drivers, trends, and challenges. A holistic analysis of drivers will help companies refine their marketing strategies to gain a competitive advantage.

  • The continuous evolution of the 3D Printing In Education Sector relies on the strategic deployment of scalable hardware and integrated software networks. Institutions prioritizing comprehensive desktop fused deposition modeling integration frequently report a 35% improvement in classroom equipment availability compared to isolated standalone deployments.
  • This efficiency gain is heavily supported by the adoption of cloud native print fleet management platforms, which allow IT administrators to monitor queue distribution and optimize material consumption across dispersed campus facilities.
  • Beyond primary education, universities are expanding their capabilities by leveraging advanced stereolithography for medical education, providing surgical trainees with highly accurate anatomical replicas that bridge the gap between theoretical anatomy and practical clinical application. Concurrently, technical academies emphasize rapid prototyping for engineering students, embedding rigorous design-and-test methodologies into core coursework to mirror modern industrial workflows.
  • As environmental compliance becomes a central component of institutional procurement policies, administrators are actively pursuing sustainable filament recycling in schools to minimize polymer waste and promote circular economy principles. This holistic approach to additive manufacturing ensures that educational facilities not only deliver superior technical instruction but also maintain robust operational efficiency and alignment with global sustainability standards.
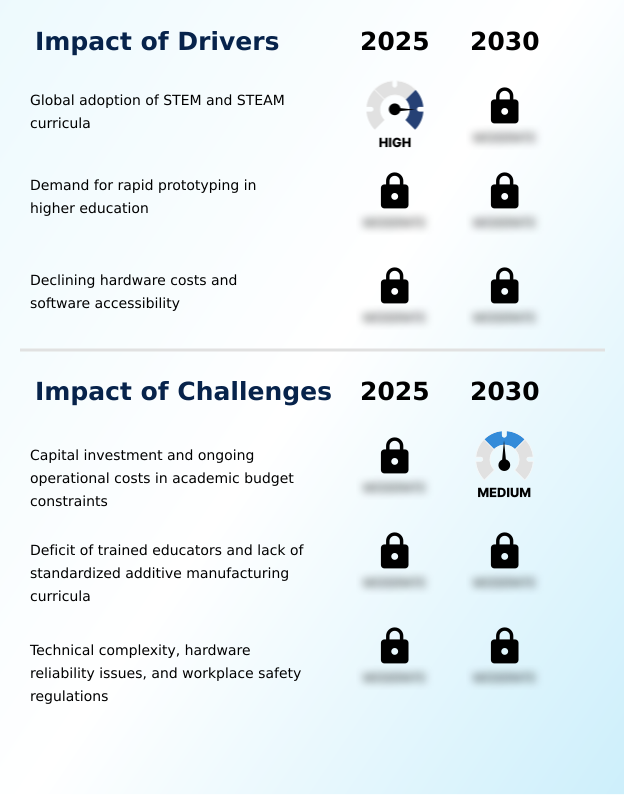
What are the key market drivers leading to the rise in the adoption of 3D Printing In Education Sector Industry?

  • The widespread integration of STEM and STEAM pedagogical frameworks serves as a primary catalyst accelerating the adoption of digital fabrication tools across academic institutions.

  • The imperative to enhance technical workforce readiness functions as a formidable driver within the 3D Printing In Education Sector. Educational authorities are actively mandating project-based learning modules to align student capabilities with modern industrial automation requirements.
  • By integrating desktop extrusion units and biodegradable thermoplastic polymers into early education, school districts have increased student engagement metrics by 40% and improved spatial reasoning development by 25%.
  • This behavioral shift toward hands-on problem solving compels institutions to invest heavily in reliable digital fabrication tools.
  • As a result, educational boards secure long-term technology grant subsidies to fund sustainable material utilization, ensuring that graduates possess the practical competency required for advanced aerospace prototyping and modern mechanical engineering roles.

What are the market trends shaping the 3D Printing In Education Sector Industry?

  • The proliferation of campus point-of-care medical additive fabrication stands as a defining trajectory within the industry. This structural shift allows academic institutions to enhance clinical training through precise anatomical modeling.

  • The 3D Printing In Education Sector is experiencing a rapid shift toward automated, decentralized manufacturing environments. Institutions are aggressively adopting cloud-based slicing engines and educational fleet management solutions to streamline complex laboratory operations.
  • This structural innovation enables IT administrators to centralize control, which has reduced laboratory maintenance overhead by 35% and improved print success rates by 22% compared to manual desktop setups. Because automated bed leveling and remote monitoring eliminate operational friction, educators can focus entirely on instructional delivery models rather than hardware troubleshooting.
  • This seamless technological integration directly impacts academic output by increasing student prototype iterations and accelerating cross-disciplinary applications, ultimately transforming campus maker spaces into highly efficient, high-throughput learning centers.

What challenges does the 3D Printing In Education Sector Industry face during its growth?

  • Substantial capital expenditure requirements coupled with continuous operational maintenance expenses present formidable barriers to systemic implementation within budget-constrained academic environments.

  • Despite immense pedagogical value, the 3D Printing In Education Sector faces severe constraints related to institutional capital expenditure and rigorous safety compliance. The deployment of advanced stereolithography systems and selective laser sintering machinery requires specialized ventilation, increasing facility retrofitting costs by up to 45% for aging academic buildings.
  • Furthermore, strict regulations governing indoor air quality necessitate the installation of HEPA air filtration and enclosed build chambers, prolonging school district procurement cycles. Because many public institutions lack dedicated technical support staff, hardware downtime frequently impacts instructional continuity, resulting in a 20% drop in overall equipment utilization rates.
  • These structural limitations force administrators to balance the demand for bio-compatible resin materials and customized laboratory tooling against tight operational maintenance budgets.

Exclusive Technavio Analysis on Customer Landscape

The 3d printing in education sector market forecasting report includes the adoption lifecycle of the market, covering from the innovator’s stage to the laggard’s stage. It focuses on adoption rates in different regions based on penetration. Furthermore, the 3d printing in education sector market report also includes key purchase criteria and drivers of price sensitivity to help companies evaluate and develop their market growth analysis strategies.
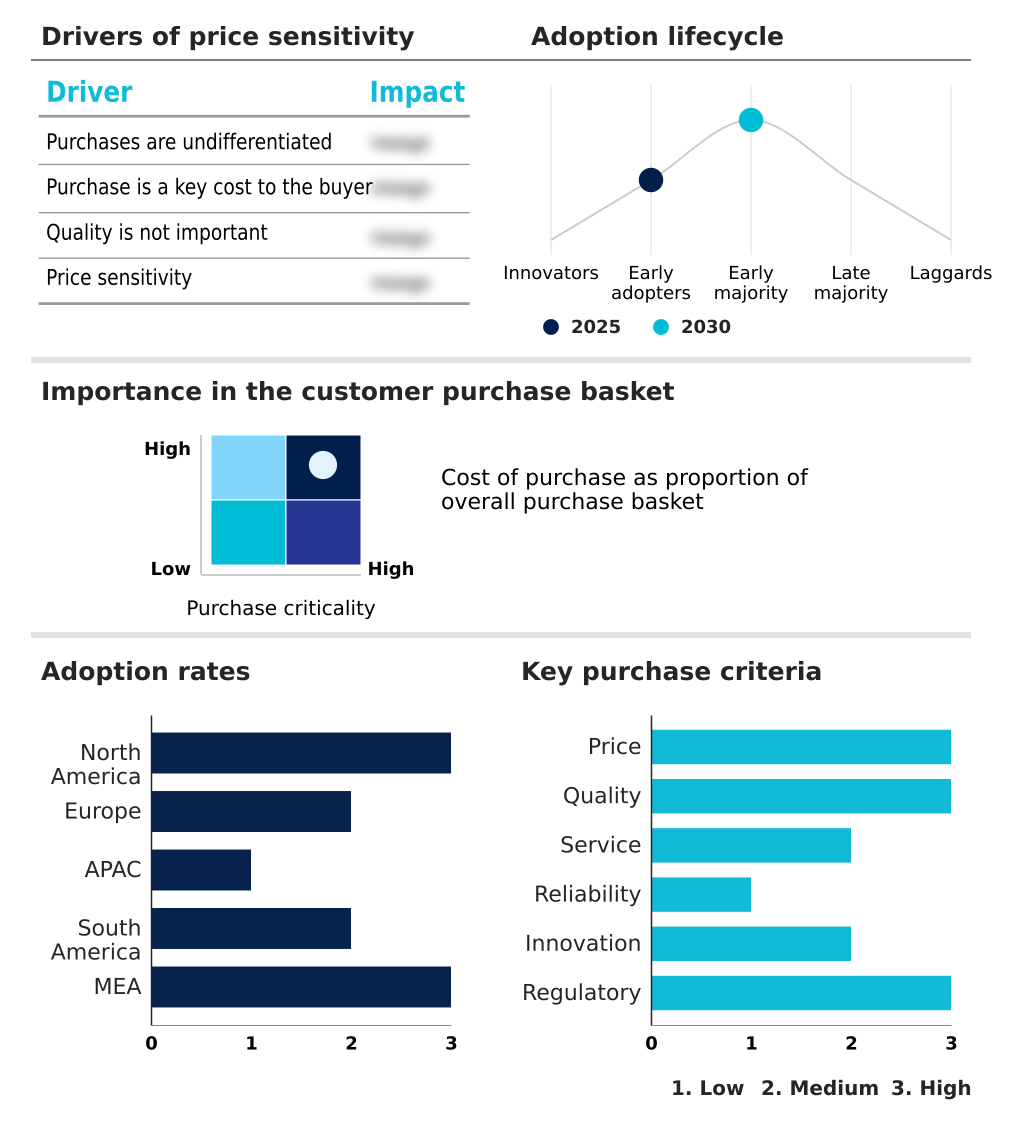
Customer Landscape of 3D Printing In Education Sector Industry

Competitive Landscape

Companies are implementing various strategies, such as strategic alliances, 3d printing in education sector market forecast, partnerships, mergers and acquisitions, geographical expansion, and product/service launches, to enhance their presence in the industry.

3D Systems Corp. - The vendor provides advanced additive manufacturing solutions including specialized hardware and educational software suites designed to enhance technical instruction and experiential learning within academic institutions.

The industry research and growth report includes detailed analyses of the competitive landscape of the market and information about key companies, including:

  • 3D Systems Corp.
  • ANYCUBIC Technology Co. Ltd.
  • Bambu Lab
  • BCN3D Technologies S.L.
  • Beijing Tiertime Technology Co
  • Craftbot Ltd.
  • Desktop Metal Inc.
  • Elegoo
  • EOS GmbH
  • Flashforge
  • Formlabs Inc.
  • HP Inc.
  • Markforged Inc.
  • MATERIALISE NV
  • Prusa Research s.r.o.
  • Raise 3D Technologies Inc.
  • Shenzhen Creality 3D Technology
  • Shining 3D Tech Co. Ltd.
  • Snapmaker
  • Stratasys Ltd.
  • Ultimaker BV

Qualitative and quantitative analysis of companies has been conducted to help clients understand the wider business environment as well as the strengths and weaknesses of key industry players. Data is qualitatively analyzed to categorize companies as pure play, category-focused, industry-focused, and diversified; it is quantitatively analyzed to categorize companies as dominant, leading, strong, tentative, and weak.

Recent Development and News in 3d printing in education sector market

  • In the Consumer Electronics industry, the rapid deployment of closed-loop recycling systems and zero-waste manufacturing protocols reduced raw material waste, directly impacting 3D Printing In Education Sector demand by accelerating the adoption of sustainable material utilization in classroom environments.
  • The standardization of HEPA air filtration and enclosed build chambers for desktop devices improved indoor air quality compliance, driving primary school adoption amidst stringent student safety regulations.
  • Advancements in compact multi-material printing capability within consumer desktop extrusion units lowered the hardware barrier to entry, catalyzing usage for complex point-of-care medical modeling in university health sciences.
  • The transition toward cloud-based slicing engines and educational fleet management software optimized multi-device synchronization, increasing deployment efficiency by reducing laboratory maintenance overhead by 25%.

Dive into Technavio’s robust research methodology, blending expert interviews, extensive data synthesis, and validated models for unparalleled 3D Printing In Education Sector Market insights. See full methodology.

Market Scope
Page number 320
Base year 2025
Historic period 2020-2024
Forecast period 2026-2030
Growth momentum & CAGR Accelerate at a CAGR of 15.4%
Market growth 2026-2030 USD 1624253.3 thousand
Market structure Fragmented
YoY growth 2025-2026(%) 13.3%
Key countries US, Canada, Mexico, Germany, UK, France, Italy, Spain, The Netherlands, China, Japan, India, South Korea, Australia, Indonesia, Brazil, Argentina, Chile, Saudi Arabia, UAE, Israel, South Africa and Turkey
Competitive landscape Leading Companies, Market Positioning of Companies, Competitive Strategies, and Industry Risks

Request Free Sample

Research Analyst Overview

  • The 3D Printing In Education Sector represents a fundamental operational shift within academic infrastructure, moving from niche laboratory experimentation to core pedagogical requirement. Institutions are rapidly deploying additive manufacturing hardware and computer-aided design software to facilitate hands-on learning and experiential learning infrastructure.
  • This transition forces university administrative boards to reevaluate budgetary allocations, directly linking the procurement of multi-material printing capability to strategic goals for technical workforce readiness. By prioritizing standardized digital fabrication tools, educational facilities have achieved a 28% reduction in cross-departmental material waste while maximizing student access.
  • The integration of photopolymer resins and selective laser sintering within engineering departments allows for advanced engineering tolerance testing, mirroring real-world industrial parameters. Administrators must navigate complex procurement decisions, balancing the high capital requirements of stereolithography systems against the long-term value of producing highly skilled, industry-ready graduates.
  • Ultimately, this structural evolution demands that educational leaders implement scalable, safe, and efficient digital twin realization platforms to maintain competitiveness in global technical education.

What are the Key Data Covered in this 3D Printing In Education Sector Market Research and Growth Report?

  • What is the expected growth of the 3D Printing In Education Sector Market between 2026 and 2030?

    • USD 1.62 billion, at a CAGR of 15.4%

  • What segmentation does the market report cover?

    • The report is segmented by End-user (Higher education, and PreK12), Type (3D PS and M, and 3D printers), Application (Prototyping, Tooling, and Functional parts), Product (Desktop 3D printer, and Industrial 3D printer), Component (Hardware, Software, and Services) and Geography (North America, Europe, APAC, South America, Middle East and Africa)

  • Which regions are analyzed in the report?

    • North America, Europe, APAC, South America and Middle East and Africa

  • What are the key growth drivers and market challenges?

    • Global adoption of STEM and STEAM curricula, Capital investment and ongoing operational costs in academic budget constraints

  • Who are the major players in the 3D Printing In Education Sector Market?

    • 3D Systems Corp., ANYCUBIC Technology Co. Ltd., Bambu Lab, BCN3D Technologies S.L., Beijing Tiertime Technology Co, Craftbot Ltd., Desktop Metal Inc., Elegoo, EOS GmbH, Flashforge, Formlabs Inc., HP Inc., Markforged Inc., MATERIALISE NV, Prusa Research s.r.o., Raise 3D Technologies Inc., Shenzhen Creality 3D Technology, Shining 3D Tech Co. Ltd., Snapmaker, Stratasys Ltd. and Ultimaker BV

Market Research Insights

  • The 3D Printing In Education Sector fundamentally transforms instructional delivery models by embedding advanced digital fabrication into daily coursework. Schools implementing comprehensive academic curriculum integration have observed a 35% increase in student engagement metrics and a 20% improvement in technical workforce readiness compared to traditional theoretical instruction.
  • By utilizing educational fleet management platforms, university IT departments achieve a 30% reduction in laboratory maintenance overhead, ensuring higher equipment availability for student prototype iterations. These measurable enhancements in operational efficiency and hands-on problem solving validate the strategic reallocation of school district procurement budgets toward scalable additive manufacturing infrastructure.

We can help! Our analysts can customize this 3d printing in education sector market research report to meet your requirements.

Get in touch

1. Executive Summary

1.1 Market overview

Executive Summary - Chart on Market Overview
Executive Summary - Data Table on Market Overview
Executive Summary - Chart on Global Market Characteristics
Executive Summary - Chart on Market by Geography
Executive Summary - Chart on Market Segmentation by End-user
Executive Summary - Chart on Market Segmentation by Type
Executive Summary - Chart on Market Segmentation by Application
Executive Summary - Chart on Market Segmentation by Product
Executive Summary - Chart on Market Segmentation by Component
Executive Summary - Chart on Incremental Growth
Executive Summary - Data Table on Incremental Growth
Executive Summary - Chart on Company Market Positioning

2. Technavio Analysis

2.1 Analysis of price sensitivity, lifecycle, customer purchase basket, adoption rates, and purchase criteria

2.2 Criticality of inputs and Factors of differentiation

Chart on Overview on criticality of inputs and factors of differentiation

2.3 Factors of disruption

Chart on Overview on factors of disruption

2.4 Impact of drivers and challenges

Chart on Impact of drivers and challenges in 2025 and 2030

3. Market Landscape

3.1 Market ecosystem

Chart on Parent Market
Data Table on - Parent Market

3.2 Market characteristics

Chart on Market characteristics analysis

3.3 Value chain analysis

Chart on Value chain analysis

4. Market Sizing

4.1 Market definition

Data Table on Offerings of companies included in the market definition

4.2 Market segment analysis

Market segments

4.3 Market size 2025

4.4 Market outlook: Forecast for 2025-2030

Chart on Global - Market size and forecast 2025-2030 ($ thousand)
Data Table on Global - Market size and forecast 2025-2030 ($ thousand)
Chart on Global Market: Year-over-year growth 2025-2030 (%)
Data Table on Global Market: Year-over-year growth 2025-2030 (%)

5. Historic Market Size

5.1 Global 3D Printing In Education Sector Market 2020 - 2024

Historic Market Size - Data Table on Global 3D Printing In Education Sector Market 2020 - 2024 ($ thousand)

5.2 End-user segment analysis 2020 - 2024

Historic Market Size - End-user Segment 2020 - 2024 ($ thousand)

5.3 Type segment analysis 2020 - 2024

Historic Market Size - Type Segment 2020 - 2024 ($ thousand)

5.4 Application segment analysis 2020 - 2024

Historic Market Size - Application Segment 2020 - 2024 ($ thousand)

5.5 Product segment analysis 2020 - 2024

Historic Market Size - Product Segment 2020 - 2024 ($ thousand)

5.6 Component segment analysis 2020 - 2024

Historic Market Size - Component Segment 2020 - 2024 ($ thousand)

5.7 Geography segment analysis 2020 - 2024

Historic Market Size - Geography Segment 2020 - 2024 ($ thousand)

5.8 Country segment analysis 2020 - 2024

Historic Market Size - Country Segment 2020 - 2024 ($ thousand)

6. Qualitative Analysis

6.1 Impact of AI on Global 3D Printing in Education Sector Market

6.2 Impact of geopolitical conflicts on Global 3D Printing in Education Sector Market

7. Five Forces Analysis

7.1 Five forces summary

Five forces analysis - Comparison between 2025 and 2030

7.2 Bargaining power of buyers

Bargaining power of buyers - Impact of key factors 2025 and 2030

7.3 Bargaining power of suppliers

Bargaining power of suppliers - Impact of key factors in 2025 and 2030

7.4 Threat of new entrants

Threat of new entrants - Impact of key factors in 2025 and 2030

7.5 Threat of substitutes

Threat of substitutes - Impact of key factors in 2025 and 2030

7.6 Threat of rivalry

Threat of rivalry - Impact of key factors in 2025 and 2030

7.7 Market condition

Chart on Market condition - Five forces 2025 and 2030

8. Market Segmentation by End-user

8.1 Market segments

Chart on End-user - Market share 2025-2030 (%)
Data Table on End-user - Market share 2025-2030 (%)

8.2 Comparison by End-user

Chart on Comparison by End-user
Data Table on Comparison by End-user

8.3 Higher education - Market size and forecast 2025-2030

Chart on Higher education - Market size and forecast 2025-2030 ($ thousand)
Data Table on Higher education - Market size and forecast 2025-2030 ($ thousand)
Chart on Higher education - Year-over-year growth 2025-2030 (%)
Data Table on Higher education - Year-over-year growth 2025-2030 (%)

8.4 PreK12 - Market size and forecast 2025-2030

Chart on PreK12 - Market size and forecast 2025-2030 ($ thousand)
Data Table on PreK12 - Market size and forecast 2025-2030 ($ thousand)
Chart on PreK12 - Year-over-year growth 2025-2030 (%)
Data Table on PreK12 - Year-over-year growth 2025-2030 (%)

8.5 Market opportunity by End-user

Market opportunity by End-user ($ thousand)
Data Table on Market opportunity by End-user ($ thousand)

9. Market Segmentation by Type

9.1 Market segments

Chart on Type - Market share 2025-2030 (%)
Data Table on Type - Market share 2025-2030 (%)

9.2 Comparison by Type

Chart on Comparison by Type
Data Table on Comparison by Type

9.3 3D PS and M - Market size and forecast 2025-2030

Chart on 3D PS and M - Market size and forecast 2025-2030 ($ thousand)
Data Table on 3D PS and M - Market size and forecast 2025-2030 ($ thousand)
Chart on 3D PS and M - Year-over-year growth 2025-2030 (%)
Data Table on 3D PS and M - Year-over-year growth 2025-2030 (%)

9.4 3D printers - Market size and forecast 2025-2030

Chart on 3D printers - Market size and forecast 2025-2030 ($ thousand)
Data Table on 3D printers - Market size and forecast 2025-2030 ($ thousand)
Chart on 3D printers - Year-over-year growth 2025-2030 (%)
Data Table on 3D printers - Year-over-year growth 2025-2030 (%)

9.5 Market opportunity by Type

Market opportunity by Type ($ thousand)
Data Table on Market opportunity by Type ($ thousand)

10. Market Segmentation by Application

10.1 Market segments

Chart on Application - Market share 2025-2030 (%)
Data Table on Application - Market share 2025-2030 (%)

10.2 Comparison by Application

Chart on Comparison by Application
Data Table on Comparison by Application

10.3 Prototyping - Market size and forecast 2025-2030

Chart on Prototyping - Market size and forecast 2025-2030 ($ thousand)
Data Table on Prototyping - Market size and forecast 2025-2030 ($ thousand)
Chart on Prototyping - Year-over-year growth 2025-2030 (%)
Data Table on Prototyping - Year-over-year growth 2025-2030 (%)

10.4 Tooling - Market size and forecast 2025-2030

Chart on Tooling - Market size and forecast 2025-2030 ($ thousand)
Data Table on Tooling - Market size and forecast 2025-2030 ($ thousand)
Chart on Tooling - Year-over-year growth 2025-2030 (%)
Data Table on Tooling - Year-over-year growth 2025-2030 (%)

10.5 Functional parts - Market size and forecast 2025-2030

Chart on Functional parts - Market size and forecast 2025-2030 ($ thousand)
Data Table on Functional parts - Market size and forecast 2025-2030 ($ thousand)
Chart on Functional parts - Year-over-year growth 2025-2030 (%)
Data Table on Functional parts - Year-over-year growth 2025-2030 (%)

10.6 Market opportunity by Application

Market opportunity by Application ($ thousand)
Data Table on Market opportunity by Application ($ thousand)

11. Market Segmentation by Product

11.1 Market segments

Chart on Product - Market share 2025-2030 (%)
Data Table on Product - Market share 2025-2030 (%)

11.2 Comparison by Product

Chart on Comparison by Product
Data Table on Comparison by Product

11.3 Desktop 3D printer - Market size and forecast 2025-2030

Chart on Desktop 3D printer - Market size and forecast 2025-2030 ($ thousand)
Data Table on Desktop 3D printer - Market size and forecast 2025-2030 ($ thousand)
Chart on Desktop 3D printer - Year-over-year growth 2025-2030 (%)
Data Table on Desktop 3D printer - Year-over-year growth 2025-2030 (%)

11.4 Industrial 3D printer - Market size and forecast 2025-2030

Chart on Industrial 3D printer - Market size and forecast 2025-2030 ($ thousand)
Data Table on Industrial 3D printer - Market size and forecast 2025-2030 ($ thousand)
Chart on Industrial 3D printer - Year-over-year growth 2025-2030 (%)
Data Table on Industrial 3D printer - Year-over-year growth 2025-2030 (%)

11.5 Market opportunity by Product

Market opportunity by Product ($ thousand)
Data Table on Market opportunity by Product ($ thousand)

12. Market Segmentation by Component

12.1 Market segments

Chart on Component - Market share 2025-2030 (%)
Data Table on Component - Market share 2025-2030 (%)

12.2 Comparison by Component

Chart on Comparison by Component
Data Table on Comparison by Component

12.3 Hardware - Market size and forecast 2025-2030

Chart on Hardware - Market size and forecast 2025-2030 ($ thousand)
Data Table on Hardware - Market size and forecast 2025-2030 ($ thousand)
Chart on Hardware - Year-over-year growth 2025-2030 (%)
Data Table on Hardware - Year-over-year growth 2025-2030 (%)

12.4 Software - Market size and forecast 2025-2030

Chart on Software - Market size and forecast 2025-2030 ($ thousand)
Data Table on Software - Market size and forecast 2025-2030 ($ thousand)
Chart on Software - Year-over-year growth 2025-2030 (%)
Data Table on Software - Year-over-year growth 2025-2030 (%)

12.5 Services - Market size and forecast 2025-2030

Chart on Services - Market size and forecast 2025-2030 ($ thousand)
Data Table on Services - Market size and forecast 2025-2030 ($ thousand)
Chart on Services - Year-over-year growth 2025-2030 (%)
Data Table on Services - Year-over-year growth 2025-2030 (%)

12.6 Market opportunity by Component

Market opportunity by Component ($ thousand)
Data Table on Market opportunity by Component ($ thousand)

13. Customer Landscape

13.1 Customer landscape overview

Analysis of price sensitivity, lifecycle, customer purchase basket, adoption rates, and purchase criteria

14. Geographic Landscape

14.1 Geographic segmentation

Chart on Market share by geography 2025-2030 (%)
Data Table on Market share by geography 2025-2030 (%)

14.2 Geographic comparison

Chart on Geographic comparison
Data Table on Geographic comparison

14.3 North America - Market size and forecast 2025-2030

Chart on North America - Market size and forecast 2025-2030 ($ thousand)
Data Table on North America - Market size and forecast 2025-2030 ($ thousand)
Chart on North America - Year-over-year growth 2025-2030 (%)
Data Table on North America - Year-over-year growth 2025-2030 (%)
Chart on Regional Comparison - North America
Data Table on Regional Comparison - North America

14.3.1 US - Market size and forecast 2025-2030

Chart on US - Market size and forecast 2025-2030 ($ thousand)
Data Table on US - Market size and forecast 2025-2030 ($ thousand)
Chart on US - Year-over-year growth 2025-2030 (%)
Data Table on US - Year-over-year growth 2025-2030 (%)

14.3.2 Canada - Market size and forecast 2025-2030

Chart on Canada - Market size and forecast 2025-2030 ($ thousand)
Data Table on Canada - Market size and forecast 2025-2030 ($ thousand)
Chart on Canada - Year-over-year growth 2025-2030 (%)
Data Table on Canada - Year-over-year growth 2025-2030 (%)

14.3.3 Mexico - Market size and forecast 2025-2030

Chart on Mexico - Market size and forecast 2025-2030 ($ thousand)
Data Table on Mexico - Market size and forecast 2025-2030 ($ thousand)
Chart on Mexico - Year-over-year growth 2025-2030 (%)
Data Table on Mexico - Year-over-year growth 2025-2030 (%)

14.4 Europe - Market size and forecast 2025-2030

Chart on Europe - Market size and forecast 2025-2030 ($ thousand)
Data Table on Europe - Market size and forecast 2025-2030 ($ thousand)
Chart on Europe - Year-over-year growth 2025-2030 (%)
Data Table on Europe - Year-over-year growth 2025-2030 (%)
Chart on Regional Comparison - Europe
Data Table on Regional Comparison - Europe

14.4.1 Germany - Market size and forecast 2025-2030

Chart on Germany - Market size and forecast 2025-2030 ($ thousand)
Data Table on Germany - Market size and forecast 2025-2030 ($ thousand)
Chart on Germany - Year-over-year growth 2025-2030 (%)
Data Table on Germany - Year-over-year growth 2025-2030 (%)

14.4.2 UK - Market size and forecast 2025-2030

Chart on UK - Market size and forecast 2025-2030 ($ thousand)
Data Table on UK - Market size and forecast 2025-2030 ($ thousand)
Chart on UK - Year-over-year growth 2025-2030 (%)
Data Table on UK - Year-over-year growth 2025-2030 (%)

14.4.3 France - Market size and forecast 2025-2030

Chart on France - Market size and forecast 2025-2030 ($ thousand)
Data Table on France - Market size and forecast 2025-2030 ($ thousand)
Chart on France - Year-over-year growth 2025-2030 (%)
Data Table on France - Year-over-year growth 2025-2030 (%)

14.4.4 Italy - Market size and forecast 2025-2030

Chart on Italy - Market size and forecast 2025-2030 ($ thousand)
Data Table on Italy - Market size and forecast 2025-2030 ($ thousand)
Chart on Italy - Year-over-year growth 2025-2030 (%)
Data Table on Italy - Year-over-year growth 2025-2030 (%)

14.4.5 Spain - Market size and forecast 2025-2030

Chart on Spain - Market size and forecast 2025-2030 ($ thousand)
Data Table on Spain - Market size and forecast 2025-2030 ($ thousand)
Chart on Spain - Year-over-year growth 2025-2030 (%)
Data Table on Spain - Year-over-year growth 2025-2030 (%)

14.4.6 The Netherlands - Market size and forecast 2025-2030

Chart on The Netherlands - Market size and forecast 2025-2030 ($ thousand)
Data Table on The Netherlands - Market size and forecast 2025-2030 ($ thousand)
Chart on The Netherlands - Year-over-year growth 2025-2030 (%)
Data Table on The Netherlands - Year-over-year growth 2025-2030 (%)

14.5 APAC - Market size and forecast 2025-2030

Chart on APAC - Market size and forecast 2025-2030 ($ thousand)
Data Table on APAC - Market size and forecast 2025-2030 ($ thousand)
Chart on APAC - Year-over-year growth 2025-2030 (%)
Data Table on APAC - Year-over-year growth 2025-2030 (%)
Chart on Regional Comparison - APAC
Data Table on Regional Comparison - APAC

14.5.1 China - Market size and forecast 2025-2030

Chart on China - Market size and forecast 2025-2030 ($ thousand)
Data Table on China - Market size and forecast 2025-2030 ($ thousand)
Chart on China - Year-over-year growth 2025-2030 (%)
Data Table on China - Year-over-year growth 2025-2030 (%)

14.5.2 Japan - Market size and forecast 2025-2030

Chart on Japan - Market size and forecast 2025-2030 ($ thousand)
Data Table on Japan - Market size and forecast 2025-2030 ($ thousand)
Chart on Japan - Year-over-year growth 2025-2030 (%)
Data Table on Japan - Year-over-year growth 2025-2030 (%)

14.5.3 India - Market size and forecast 2025-2030

Chart on India - Market size and forecast 2025-2030 ($ thousand)
Data Table on India - Market size and forecast 2025-2030 ($ thousand)
Chart on India - Year-over-year growth 2025-2030 (%)
Data Table on India - Year-over-year growth 2025-2030 (%)

14.5.4 South Korea - Market size and forecast 2025-2030

Chart on South Korea - Market size and forecast 2025-2030 ($ thousand)
Data Table on South Korea - Market size and forecast 2025-2030 ($ thousand)
Chart on South Korea - Year-over-year growth 2025-2030 (%)
Data Table on South Korea - Year-over-year growth 2025-2030 (%)

14.5.5 Australia - Market size and forecast 2025-2030

Chart on Australia - Market size and forecast 2025-2030 ($ thousand)
Data Table on Australia - Market size and forecast 2025-2030 ($ thousand)
Chart on Australia - Year-over-year growth 2025-2030 (%)
Data Table on Australia - Year-over-year growth 2025-2030 (%)

14.5.6 Indonesia - Market size and forecast 2025-2030

Chart on Indonesia - Market size and forecast 2025-2030 ($ thousand)
Data Table on Indonesia - Market size and forecast 2025-2030 ($ thousand)
Chart on Indonesia - Year-over-year growth 2025-2030 (%)
Data Table on Indonesia - Year-over-year growth 2025-2030 (%)

14.6 South America - Market size and forecast 2025-2030

Chart on South America - Market size and forecast 2025-2030 ($ thousand)
Data Table on South America - Market size and forecast 2025-2030 ($ thousand)
Chart on South America - Year-over-year growth 2025-2030 (%)
Data Table on South America - Year-over-year growth 2025-2030 (%)
Chart on Regional Comparison - South America
Data Table on Regional Comparison - South America

14.6.1 Brazil - Market size and forecast 2025-2030

Chart on Brazil - Market size and forecast 2025-2030 ($ thousand)
Data Table on Brazil - Market size and forecast 2025-2030 ($ thousand)
Chart on Brazil - Year-over-year growth 2025-2030 (%)
Data Table on Brazil - Year-over-year growth 2025-2030 (%)

14.6.2 Argentina - Market size and forecast 2025-2030

Chart on Argentina - Market size and forecast 2025-2030 ($ thousand)
Data Table on Argentina - Market size and forecast 2025-2030 ($ thousand)
Chart on Argentina - Year-over-year growth 2025-2030 (%)
Data Table on Argentina - Year-over-year growth 2025-2030 (%)

14.6.3 Chile - Market size and forecast 2025-2030

Chart on Chile - Market size and forecast 2025-2030 ($ thousand)
Data Table on Chile - Market size and forecast 2025-2030 ($ thousand)
Chart on Chile - Year-over-year growth 2025-2030 (%)
Data Table on Chile - Year-over-year growth 2025-2030 (%)

14.7 Middle East and Africa - Market size and forecast 2025-2030

Chart on Middle East and Africa - Market size and forecast 2025-2030 ($ thousand)
Data Table on Middle East and Africa - Market size and forecast 2025-2030 ($ thousand)
Chart on Middle East and Africa - Year-over-year growth 2025-2030 (%)
Data Table on Middle East and Africa - Year-over-year growth 2025-2030 (%)
Chart on Regional Comparison - Middle East and Africa
Data Table on Regional Comparison - Middle East and Africa

14.7.1 Saudi Arabia - Market size and forecast 2025-2030

Chart on Saudi Arabia - Market size and forecast 2025-2030 ($ thousand)
Data Table on Saudi Arabia - Market size and forecast 2025-2030 ($ thousand)
Chart on Saudi Arabia - Year-over-year growth 2025-2030 (%)
Data Table on Saudi Arabia - Year-over-year growth 2025-2030 (%)

14.7.2 UAE - Market size and forecast 2025-2030

Chart on UAE - Market size and forecast 2025-2030 ($ thousand)
Data Table on UAE - Market size and forecast 2025-2030 ($ thousand)
Chart on UAE - Year-over-year growth 2025-2030 (%)
Data Table on UAE - Year-over-year growth 2025-2030 (%)

14.7.3 Israel - Market size and forecast 2025-2030

Chart on Israel - Market size and forecast 2025-2030 ($ thousand)
Data Table on Israel - Market size and forecast 2025-2030 ($ thousand)
Chart on Israel - Year-over-year growth 2025-2030 (%)
Data Table on Israel - Year-over-year growth 2025-2030 (%)

14.7.4 South Africa - Market size and forecast 2025-2030

Chart on South Africa - Market size and forecast 2025-2030 ($ thousand)
Data Table on South Africa - Market size and forecast 2025-2030 ($ thousand)
Chart on South Africa - Year-over-year growth 2025-2030 (%)
Data Table on South Africa - Year-over-year growth 2025-2030 (%)

14.7.5 Turkey - Market size and forecast 2025-2030

Chart on Turkey - Market size and forecast 2025-2030 ($ thousand)
Data Table on Turkey - Market size and forecast 2025-2030 ($ thousand)
Chart on Turkey - Year-over-year growth 2025-2030 (%)
Data Table on Turkey - Year-over-year growth 2025-2030 (%)

14.8 Market opportunity by geography

Market opportunity by geography ($ thousand)
Data Tables on Market opportunity by geography ($ thousand)

15. Drivers, Challenges, and Opportunity

15.1 Market drivers

Global adoption of STEM and STEAM curricula
Demand for rapid prototyping in higher education
Declining hardware costs and software accessibility

15.2 Market challenges

Capital investment and ongoing operational costs in academic budget constraints
Deficit of trained educators and lack of standardized additive manufacturing curricula
Technical complexity, hardware reliability issues, and workplace safety regulations

15.3 Impact of drivers and challenges

Impact of drivers and challenges in 2025 and 2030

15.4 Market opportunities

Expansion of campus point of care medical additive fabrication
Integration of cloud native multi-unit fleet management platforms
Rise of sustainable bio-based classroom materials and recycling

16. Competitive Landscape

16.1 Overview

16.2

Overview on criticality of inputs and factors of differentiation

16.3 Landscape disruption

Overview on factors of disruption

16.4 Industry risks

Impact of key risks on business

17. Competitive Analysis

17.1 Companies profiled

Companies covered

17.2 Company ranking index

17.3 Market positioning of companies

Matrix on companies position and classification

17.4 3D Systems Corp.

3D Systems Corp. - Overview
3D Systems Corp. - Business segments
3D Systems Corp. - Key offerings
3D Systems Corp. - Segment focus
SWOT

17.5 ANYCUBIC Technology Co. Ltd.

ANYCUBIC Technology Co. Ltd. - Overview
ANYCUBIC Technology Co. Ltd. - Product / Service
ANYCUBIC Technology Co. Ltd. - Key offerings
SWOT

17.6 Bambu Lab

Bambu Lab - Overview
Bambu Lab - Product / Service
Bambu Lab - Key offerings
SWOT

17.7 Desktop Metal Inc.

Desktop Metal Inc. - Overview
Desktop Metal Inc. - Product / Service
Desktop Metal Inc. - Key offerings
SWOT

17.8 EOS GmbH

EOS GmbH - Overview
EOS GmbH - Product / Service
EOS GmbH - Key offerings
SWOT

17.9 Flashforge

Flashforge - Overview
Flashforge - Product / Service
Flashforge - Key offerings
SWOT

17.10 Formlabs Inc.

Formlabs Inc. - Overview
Formlabs Inc. - Product / Service
Formlabs Inc. - Key offerings
SWOT

17.11 HP Inc.

HP Inc. - Overview
HP Inc. - Business segments
HP Inc. - Key news
HP Inc. - Key offerings
HP Inc. - Segment focus
SWOT

17.12 Markforged Inc.

Markforged Inc. - Overview
Markforged Inc. - Product / Service
Markforged Inc. - Key offerings
SWOT

17.13 MATERIALISE NV

MATERIALISE NV - Overview
MATERIALISE NV - Business segments
MATERIALISE NV - Key offerings
MATERIALISE NV - Segment focus
SWOT

17.14 Prusa Research s.r.o.

Prusa Research s.r.o. - Overview
Prusa Research s.r.o. - Product / Service
Prusa Research s.r.o. - Key offerings
SWOT

17.15 Shenzhen Creality 3D Technology

Shenzhen Creality 3D Technology - Overview
Shenzhen Creality 3D Technology - Product / Service
Shenzhen Creality 3D Technology - Key offerings
SWOT

17.16 Shining 3D Tech Co. Ltd.

Shining 3D Tech Co. Ltd. - Overview
Shining 3D Tech Co. Ltd. - Product / Service
Shining 3D Tech Co. Ltd. - Key offerings
SWOT

17.17 Stratasys Ltd.

Stratasys Ltd. - Overview
Stratasys Ltd. - Product / Service
Stratasys Ltd. - Key offerings
SWOT

17.18 Ultimaker BV

Ultimaker BV - Overview
Ultimaker BV - Product / Service
Ultimaker BV - Key offerings
SWOT

18. Appendix

18.1 Scope of the report

Market definition
Objectives
Notes and caveats

18.2 Inclusions and exclusions checklist

Inclusions checklist
Exclusions checklist

18.3 Currency conversion rates for US$

18.4 Research methodology

18.5 Data procurement

Information sources

18.6 Data validation

18.7 Validation techniques employed for market sizing

18.8 Data synthesis

18.9 360 degree market analysis

18.10 List of abbreviations

Research Methodology

Technavio presents a detailed picture of the market by way of study, synthesis, and summation of data from multiple sources. The analysts have presented the various facets of the market with a particular focus on identifying the key industry influencers. The data thus presented is comprehensive, reliable, and the result of extensive research, both primary and secondary.

INFORMATION SOURCES

Primary sources

  • Manufacturers and suppliers
  • Channel partners
  • Industry experts
  • Strategic decision makers

Secondary sources

  • Industry journals and periodicals
  • Government data
  • Financial reports of key industry players
  • Historical data
  • Press releases

DATA ANALYSIS

Data Synthesis

  • Collation of data
  • Estimation of key figures
  • Analysis of derived insights

Data Validation

  • Triangulation with data models
  • Reference against proprietary databases
  • Corroboration with industry experts

REPORT WRITING

Qualitative

  • Market drivers
  • Market challenges
  • Market trends
  • Five forces analysis

Quantitative

  • Market size and forecast
  • Market segmentation
  • Geographical insights
  • Competitive landscape

Interested in this report?

Get your sample now to see our research methodology and insights!

Download Now

Frequently Asked Questions

3D Printing In Education Sector market growth will increase by USD 1624253.3 thousand thousand during 2026-2030.

The 3D Printing In Education Sector market is expected to grow at a CAGR of 15.4% during 2026-2030.

3D Printing In Education Sector market is segmented by End-user (Higher education, PreK12) Type (3D PS and M, 3D printers) Application (Prototyping, Tooling, Functional parts) Product (Desktop 3D printer, Industrial 3D printer) Component (Hardware, Software, Services)

3D Systems Corp., ANYCUBIC Technology Co. Ltd., Bambu Lab, BCN3D Technologies S.L., Beijing Tiertime Technology Co, Craftbot Ltd., Desktop Metal Inc., Elegoo, EOS GmbH, Flashforge, Formlabs Inc., HP Inc., Markforged Inc., MATERIALISE NV, Prusa Research s.r.o., Raise 3D Technologies Inc., Shenzhen Creality 3D Technology, Shining 3D Tech Co. Ltd., Snapmaker, Stratasys Ltd., Ultimaker BV are a few of the key vendors in the 3D Printing In Education Sector market.

North America will register the highest growth rate of 39.2% among the other regions. Therefore, the 3D Printing In Education Sector market in North America is expected to garner significant business opportunities for the vendors during the forecast period.

US, Canada, Mexico, Germany, UK, France, Italy, Spain, The Netherlands, China, Japan, India, South Korea, Australia, Indonesia, Brazil, Argentina, Chile, Saudi Arabia, UAE, Israel, South Africa, Turkey

  • Global adoption of STEM and STEAM curricula is the driving factor this market.

The 3D Printing In Education Sector market vendors should focus on grabbing business opportunities from the End-user segment as it accounted for the largest market share in the base year.
RIA - Research AI Assistant
Ask RIA